Stats 110 Exam 1 Flashcards
 Call Kai
 Learn
Learn Practice Test
 Spaced Repetition
 Match
Match Flashcards
 Knowt Play
1/62

There's no tags or description
Looks like no tags are added yet.
Name | Mastery | Learn | Test | Matching | Spaced | Call with Kai | Chat |
|---|
No analytics yet
Send a link to your students to track their progress
63 Terms
Population
The entire group about which the researcher wants information.
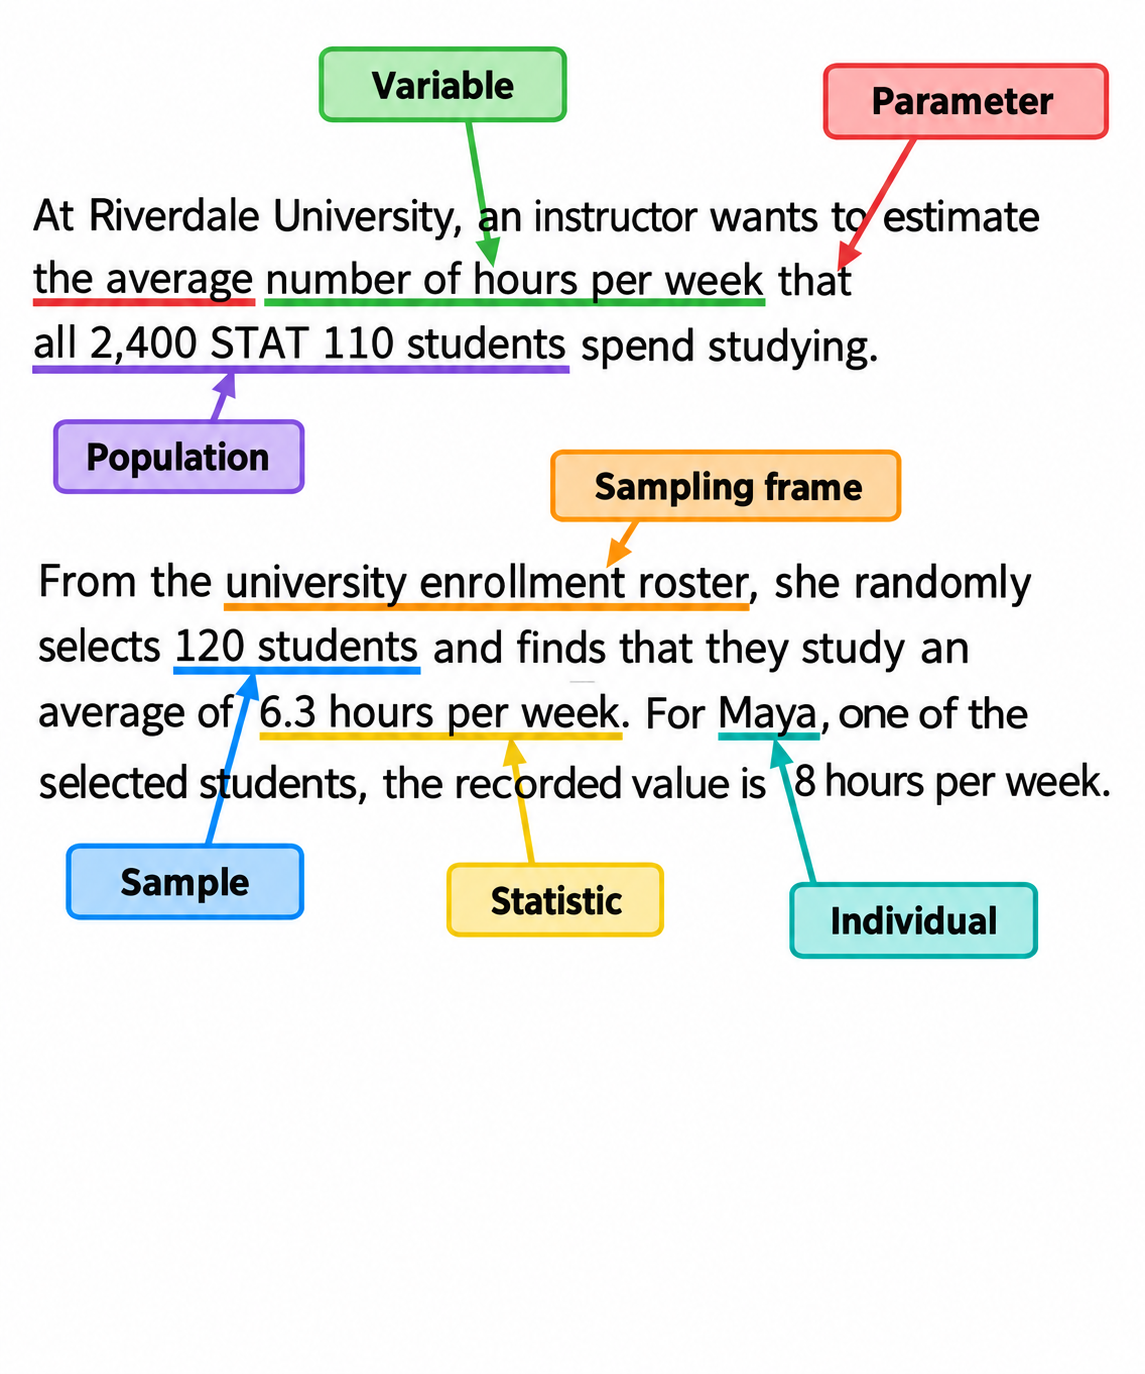
Sample
The individuals actually observed or providing usable data.

Sampling frame
The list or database from which the sample is selected. It may differ
from the target population.
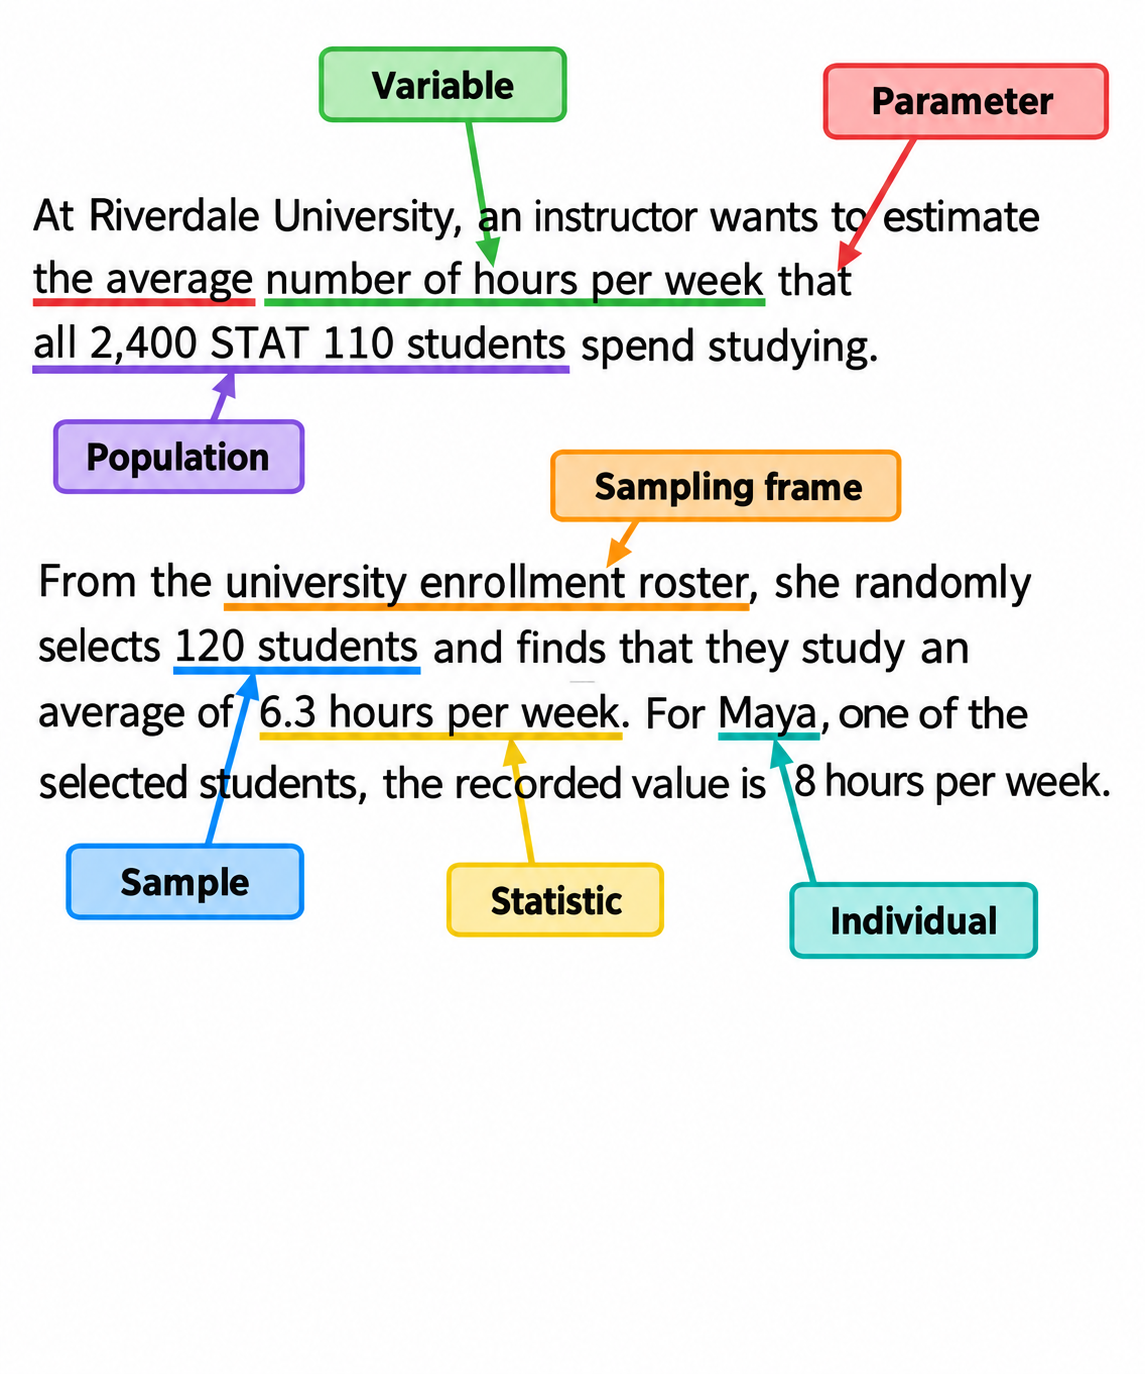
parameter
A numerical description of a population; usually unknown. Common
notation: p^

statistic
A numerical description computed from a sample. Common notation: p^
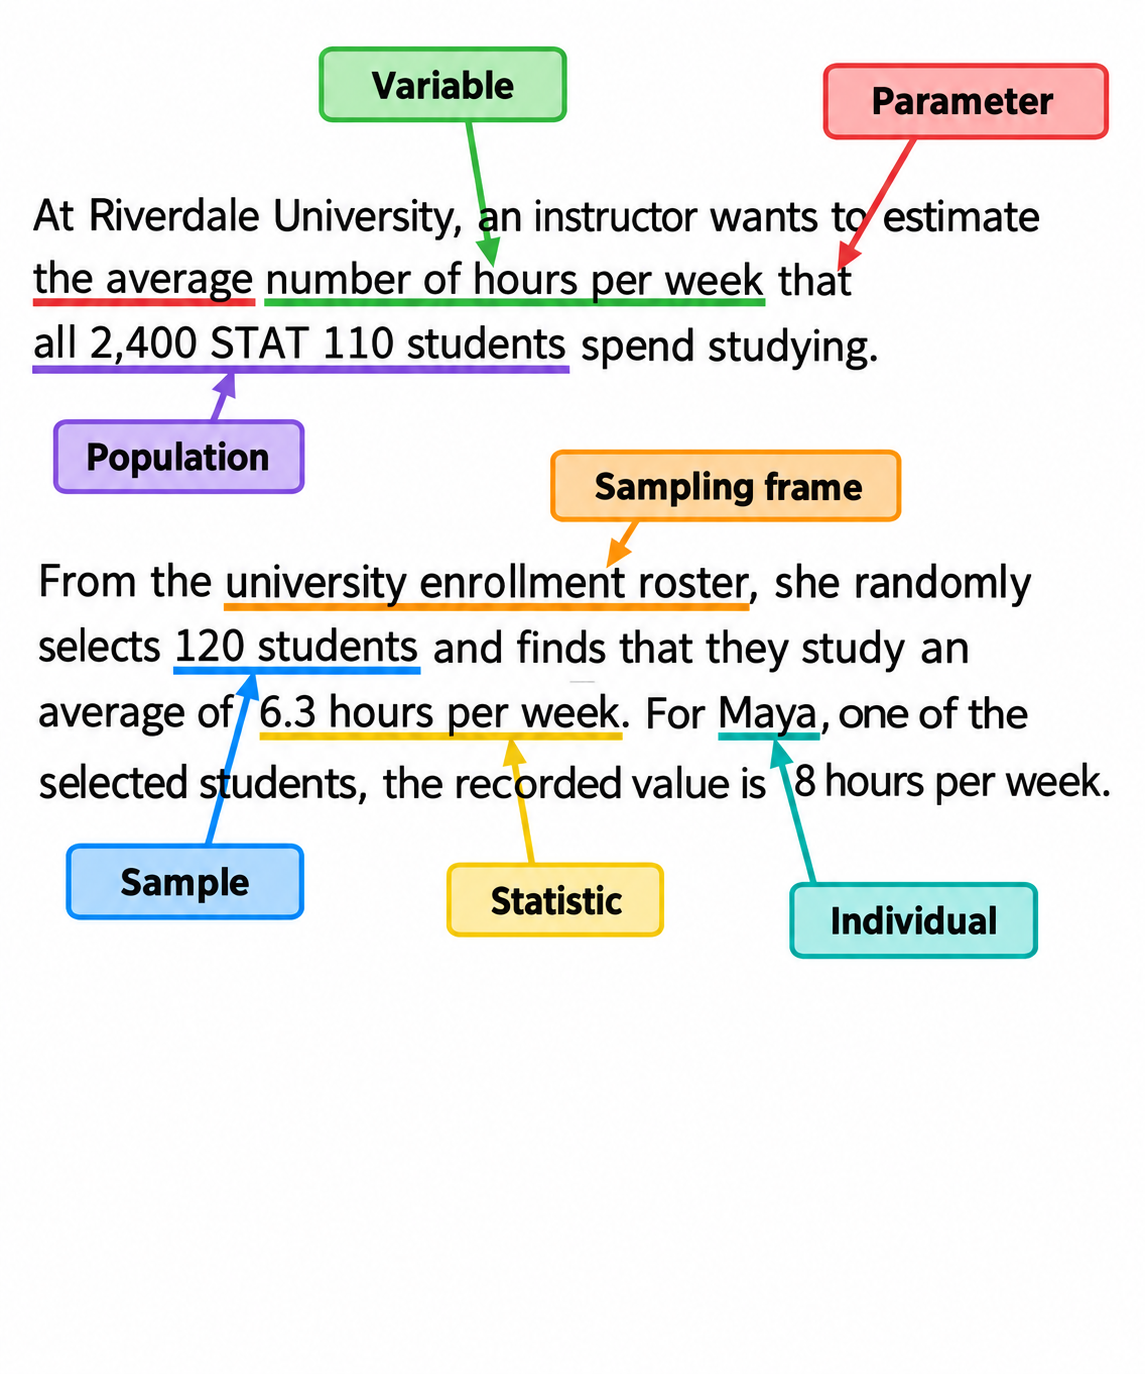
individual
One person, object, animal, or other unit about which data are
collected.A characteristic recorded for each individual.

variable
A characteristic recorded for each individual.
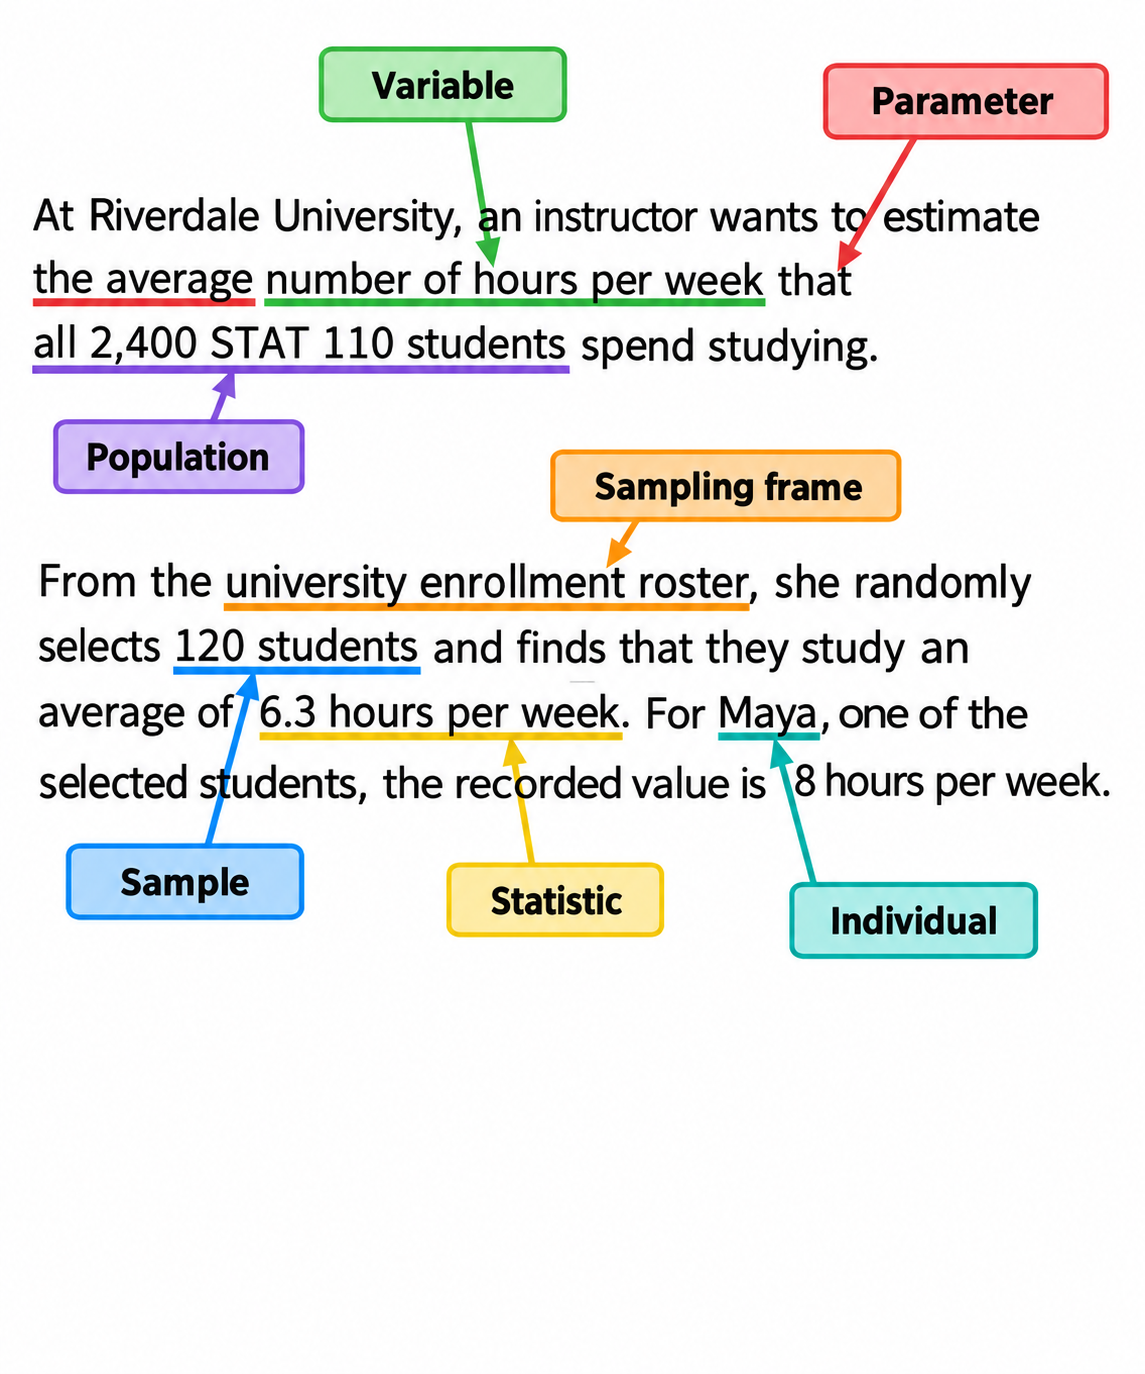
Statistical Inference
Using sample information to draw conclusions about a population.
Descriptive Statistics
Organizes, displays, and summarizes observed data.
Inferential Statistics
Uses sample results to make conclusions or predictions about a population.
Categorical Variables
Places individuals into groups. Nominal (Groups data into names, labels, or qualities that cannot be sorted or ranked.) categories have no natural order; ordinal (Places data into categories that follow a natural sequence or hierarchy) categories do.
Quantitative Variables
Numerical values for which arithmetic is meaningful. Discrete values are countable; continuous values are measured on a continuum.
Observational Studies
Observes without imposing a treatment; cannot establish cause and effect definitively.
Experimental Studies
Deliberately imposes treatments and measures responses; a well-designed randomized experiment can support causal conclusions.
Census
A complete count or study that collects information from every single member of a an entire population.
Sample Survey
a method of collecting data from a sample to make valid inferences about a population.
Convenience Sampling
Definition: Selects individuals who are easiest to reach.
Clues and Concerns: Easy availability; usually biased
Voluntary Response Sampling
Definition: Individuals choose themselves whether to participate.
Clues and Concerns: Call-in or online poll; strong opinions are often overrepresented.
Simple Random Sample (SRS)
Definition: Every possible sample of size n has an equal chance of selection.
Clues: Lottery, random digits, or random-number generator.
Stratified Random Sample
Definition: Divide into homogeneous strata and take an SRS from every stratum
Clues: Ensures representation; compare subgroups. (doesn’t survey the collective group)
Cluster Sample
Definition: Divide into natural, internally diverse clusters; randomly select some clusters and survey all members in them.
Clues: Saves time and cost.
Systematic Sample
Definition: Choose a random start, then select every kth member.
Clue: “Every 25th name.”
SRS Random-Digit Table Steps
1. Label each individual in the population with a sequence of digits.
2. If there are 231 individuals in the population, label individuals with 3-digit sequences, such as 001 to 231.
3. Begin looking in the table at a random spot and read across by 3-digit sequences.
4. If the sequence you read corresponds to a labeled individual, select it for the sample.
5. If the sequence does not correspond to any label, or if the label has already been selected, ignore it and read on.
6. Stop when you have the needed number of individuals in the sample.

SRS Random-Digit Example:
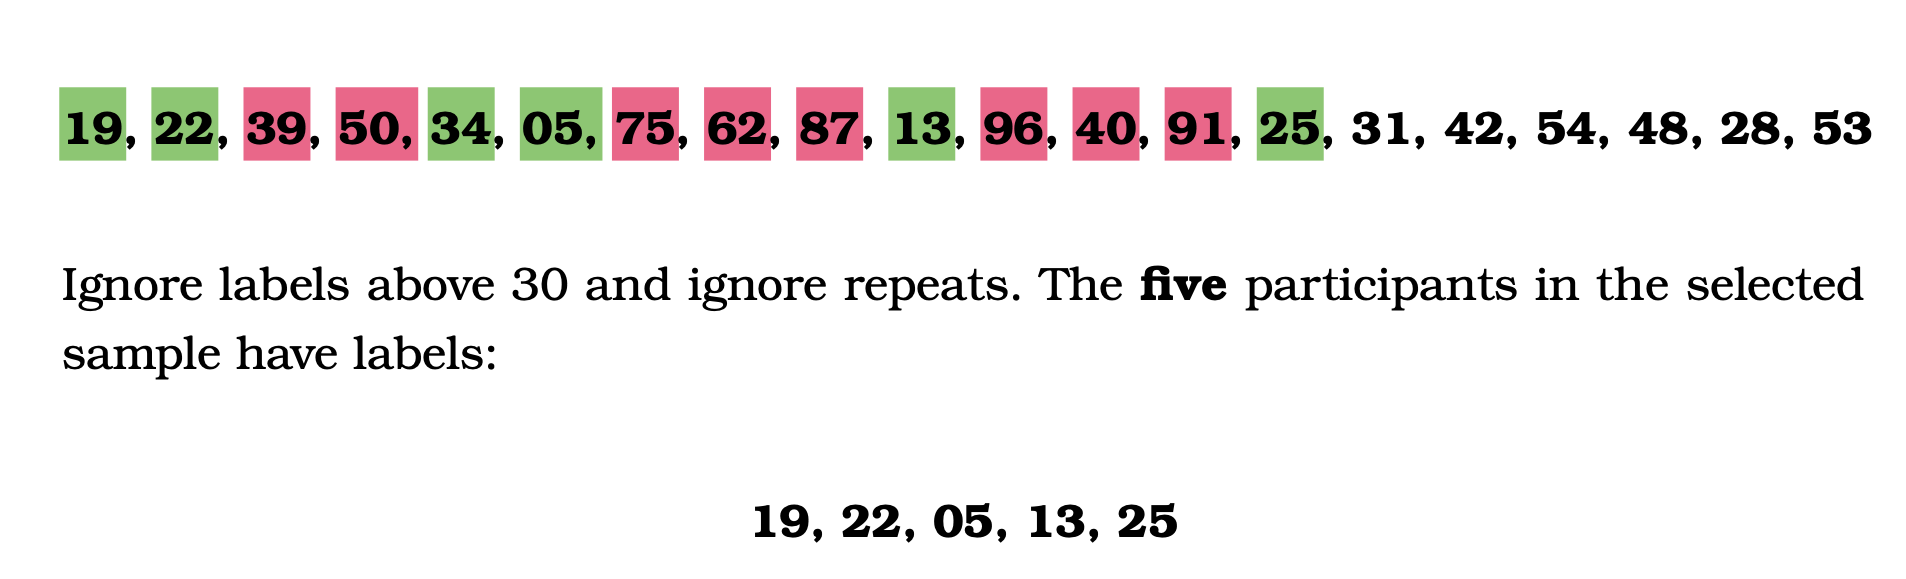
Suppose you want to take a simple random sample of size 5 from 30 students in your Zumba exercise class. You label the students using two digits, 01 to 30, in alphabetical order. For uniformity, use line 101 of the table of random digits:
19, 22, 05, 13, 25
Random Sampling Error
Chance difference between a sample statistic and the population
parameter. It is reflected in the margin of error and generally
decreases with larger random samples.
Systematic Sampling Error
Persistent over- or underestimation caused by a biased selection
process, including undercoverage and poor sampling designs.
Nonsampling Error
Error not caused by random selection: nonresponse, inaccurate
responses, leading wording, interviewer influence, and data-entry or
processing mistakes. It can occur even in a census.
Bias
A method systematically favors certain outcomes. Larger samples do not repair a biased design.
Variability
Different random samples produce different statistics. Increase the
random sample size to reduce variability.
Margin of Error
a statistical measure that quantifies the maximum expected difference between a sample statistic (like a sample mean or sample proportion) and the true population parameter
What the margin of error does and does not measure.
The reported margin of error accounts only for random sampling variability. It does not account for undercoverage, nonresponse, voluntary response, misleading wording, interviewer effects, or
data-processing mistakes.
Calculating p^

Calculating Margin of Error (not 95%)

Quick Calculation for MOE 95% Confidence Level

Calculating Confidence Interval

How Sample Size and Confidence Level Affect Interval Width.
Larger Sample Sizes Make Confidence Intervals Narrower.
Response Variable
The measured outcome; also called the outcome or dependent variable.
Explanatory Variable
The factor thought to explain or cause changes; also called the
predictor or independent variable.
Randomization
Uses chance to assign treatments; helps balance other variables and reduces systematic differences
Control
Provides a baseline and holds other conditions as similar as possible.
Replication
Uses enough experimental units to reduce the influence of unusual
individuals and chance variation.
Completely Randomized
Assign all experimental units directly to treatments at random.
Randomized Block
First group similar units into blocks; then randomize treatments
separately within each block.
Matched Pairs
Compare two treatments using closely matched pairs or the same
subject under both treatments.
Placebo Effect
A response caused by the expectation of treatment rather than an
active ingredient.
Lurking Variable
An unmeasured or unrecognized variable that may influence the
observed relationship.
Confounding
Effects of two variables on the response cannot be separated.
(Researchers are aware of these variables)
Single-Blind
Participants do not know their assignments.
Double-Blind
Participants and the people interacting with them or assessing outcomes do not know assignments.
Triple-Blind
participants, researchers, and analysts are unaware of assignments
Statistical Significance
A result is statistically significant when an observed effect would rarely occur by chance alone under the relevant no-effect explanation.
Statistical significance does not guarantee practical importance, perfect methods, or replication of the result.
Preclinical Phase
In vitro and in vivo research before testing in humans.
Phase 1
First human testing; safety, toxicity, dosage range, side
effects.
Phase 2
Initial effectiveness, dose finding, continued safety and
tolerability.
Phase 3
Confirm effectiveness; compare with usual treatments;
monitor efficacy, toxicity, and side effects.
Phase 4
Post-marketing study of risks, benefits, adverse effects, and
optimal use.
Nuremberg Code (1947)
Fundamental ethical guidelines developed after Nazi medical
experiments.
Declaration of Helsinki (1964)
Strengthened ethical standards for medical research involving
humans.
FDA oversight (1960s–1970s)
Formalized drug approval processes requiring randomized controlled trials.
Belmont Report (1979)
Respect for persons, beneficence, and justice.
Institutional Review Board (IRB)
Reviews a study before it begins; evaluates risks, ethical treatment,
and informed consent.
Informed consent
Participants receive clear information about purpose, risks, benefits,
and the right to leave before agreeing.
Data Safety Monitoring Board
Independently monitors some ongoing trials and may recommend
early stopping for benefit, harm, or futility.