Confidence Interval Week 3/Module 3
1/22
There's no tags or description
Looks like no tags are added yet.
Name | Mastery | Learn | Test | Matching | Spaced |
|---|
No study sessions yet.
23 Terms
Confidence interval
95% interval → means that we are 95% confident that the true population parameter is contained within the confidence interval.
If we repeatedly take random samples and construct intervals from them, about 95% of those intervals would contain the true population parameter does
“plausible range where we expect our true population parameter to fall”
Writing def
An interval in which for 95% of samples with intervals created for them have the true mean within the interval
And distance between statistic and true mean is < 1.96
Wrong interpretations of CI
CI represents the probability that the true parameter value is contained within the interval
NO!
Population parameter has only 1 value, if you repeat the sampling process, the population parameter still has only 1 value
it is either in the interval or isn’t in it
Larger Confidence Intervals implications (99vs95)
99% means larger intervals
because you need larger ranges to make sure you have a better chance to cover the true mean
so intervals are wider
Sample size and confidence intervals
as the sample size increases, the intervals become narrower
SD magnitude and confidence intervals
Smaller SD means narrower values
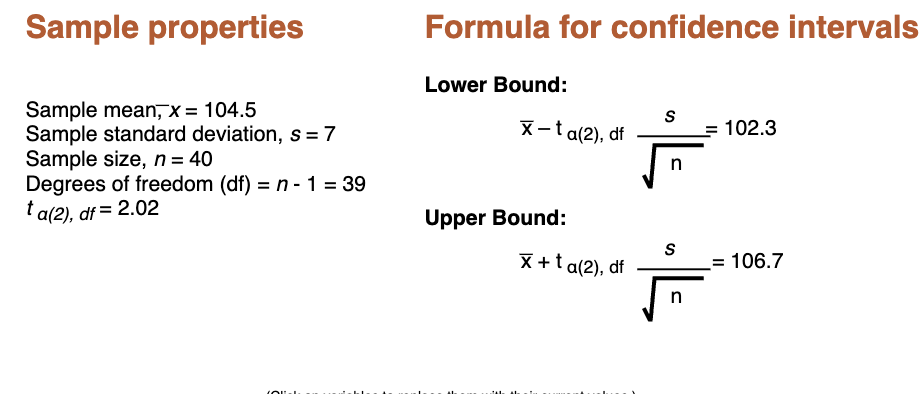
Formula for confidence intervals
used to find the appropriate standard errors in calculations
qnorm(%+remaining area of left or right)
or 1-CI for a and a/2 for second part
so for 90% it would be (0.9+0.5) = qnorm(0.95)
95% corresponds to 1.98 in a t-dist since the area becomes n-1 = 99
t_critical <- qt(0.975, df)
CI depends on the sample you collect
since the Confidence Interval depends on a given sample
if you collect a different sample your CI will almost certainly be different
Point estimate
Best estimate of the population parameter value
Confidence vs Precision trade-off
Higher level of confidence → larger interval, less precise
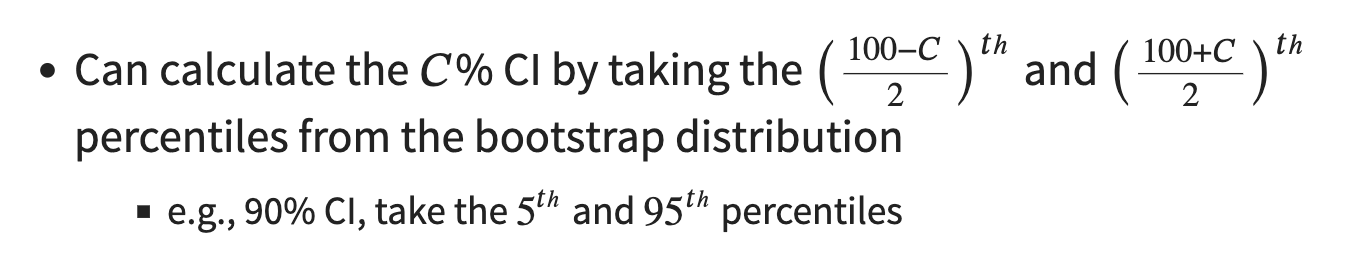
Percentile method
This method sets the lower endpoint of the confidence interval at the 2.5th percentile of the bootstrap distribution and similarly sets the upper endpoint at the 97.5th percentile. The resulting interval captures the middle 95% of the values of the sample mean in the bootstrap distribution.
theory based CI
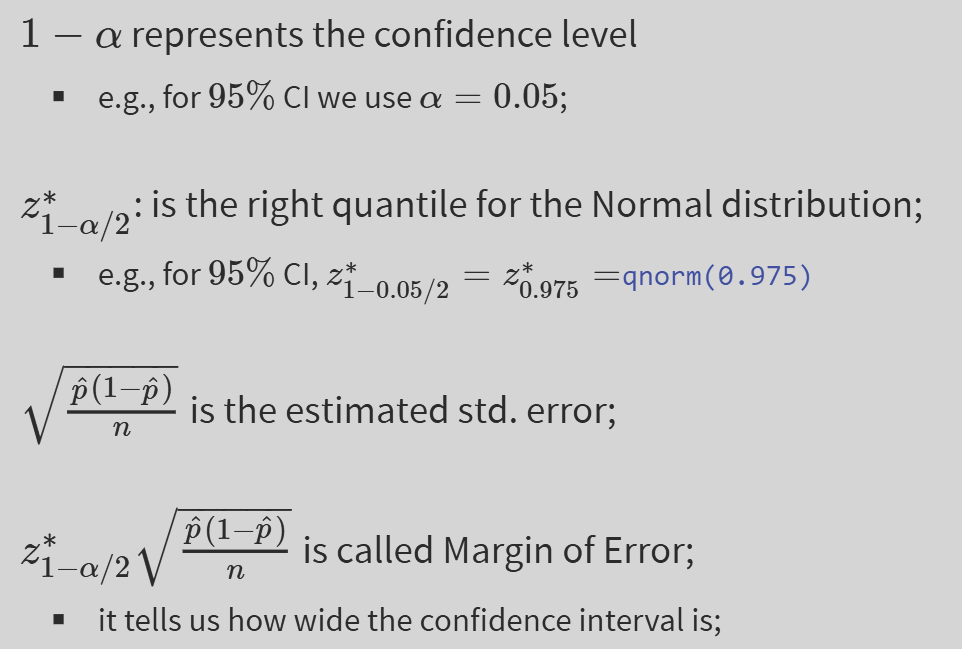
Quantiles for the CI

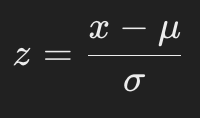
Z-score
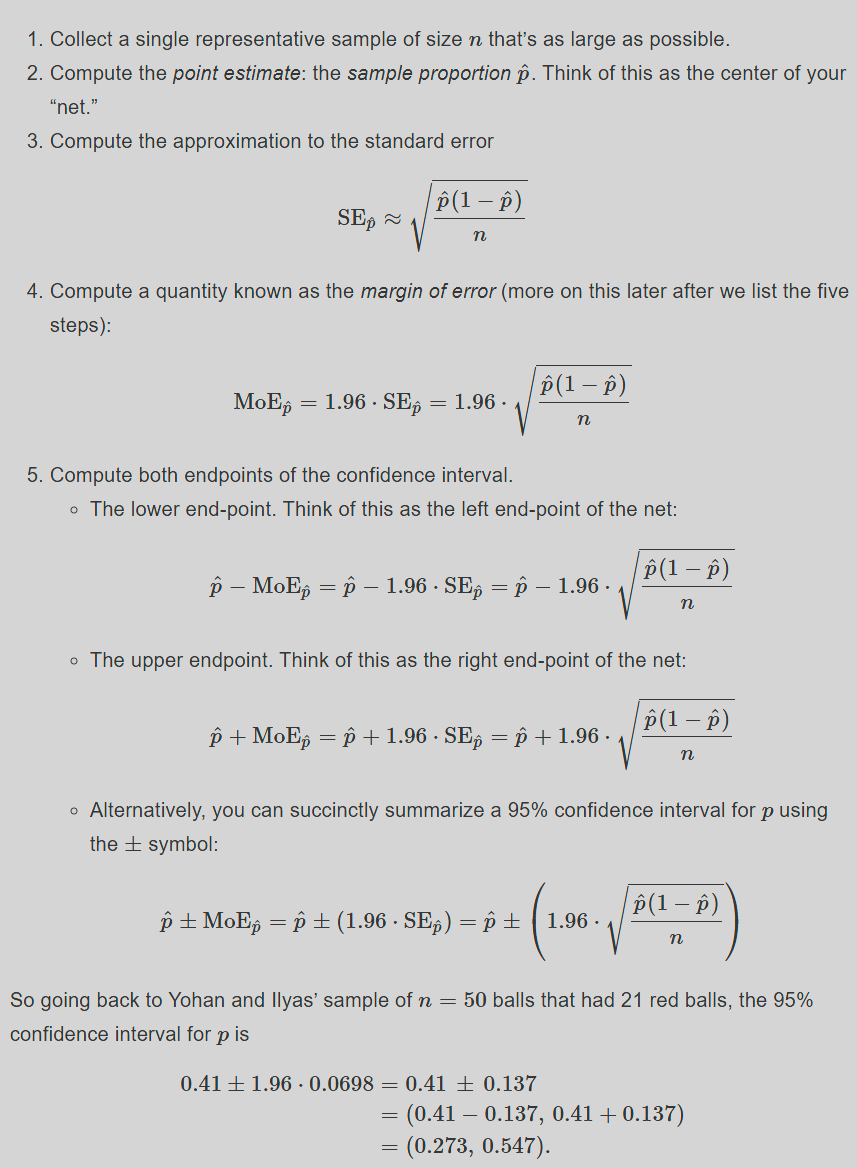
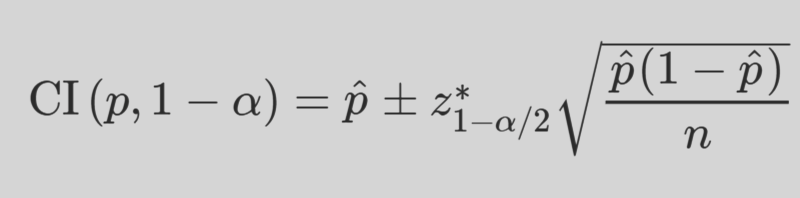
CI for proportion via CLT
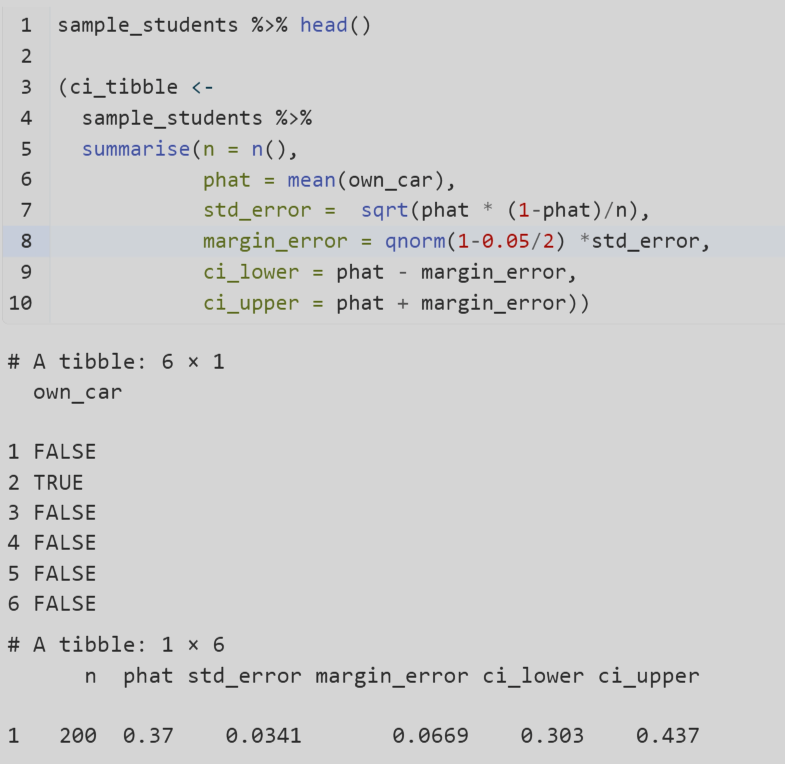
ci_lower <- qnorm(0.025, phat, sqrt(phat*(1-phat)/n))ci_upper <- qnorm(0.975, phat, sqrt(phat*(1-phat)/n))
R code for proportion
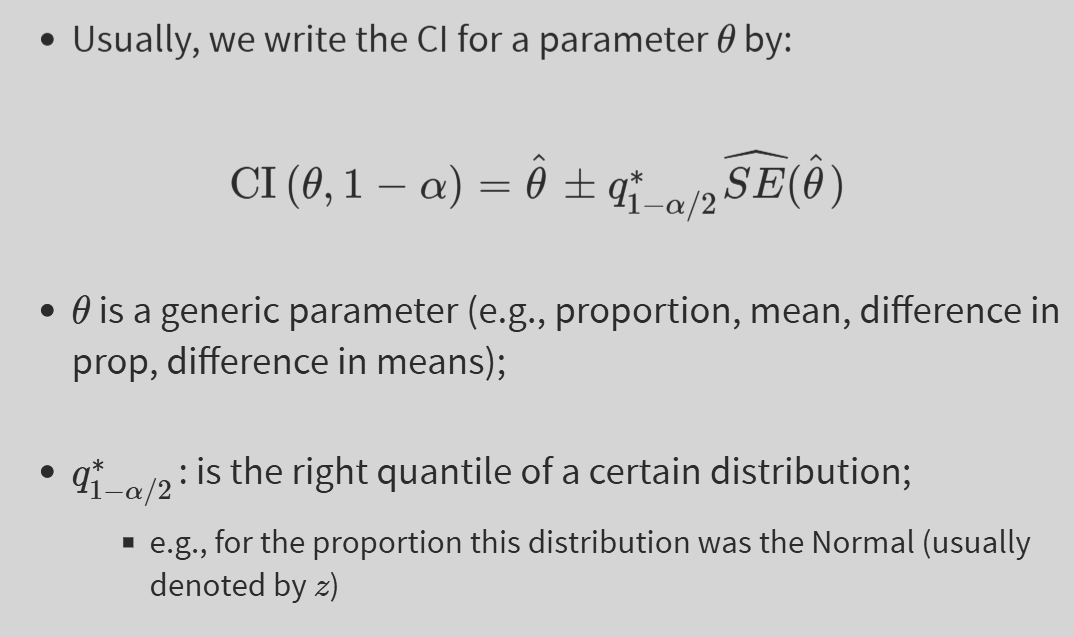
General formula for CI for a parameter
SE^(0^) is the estimated std. error
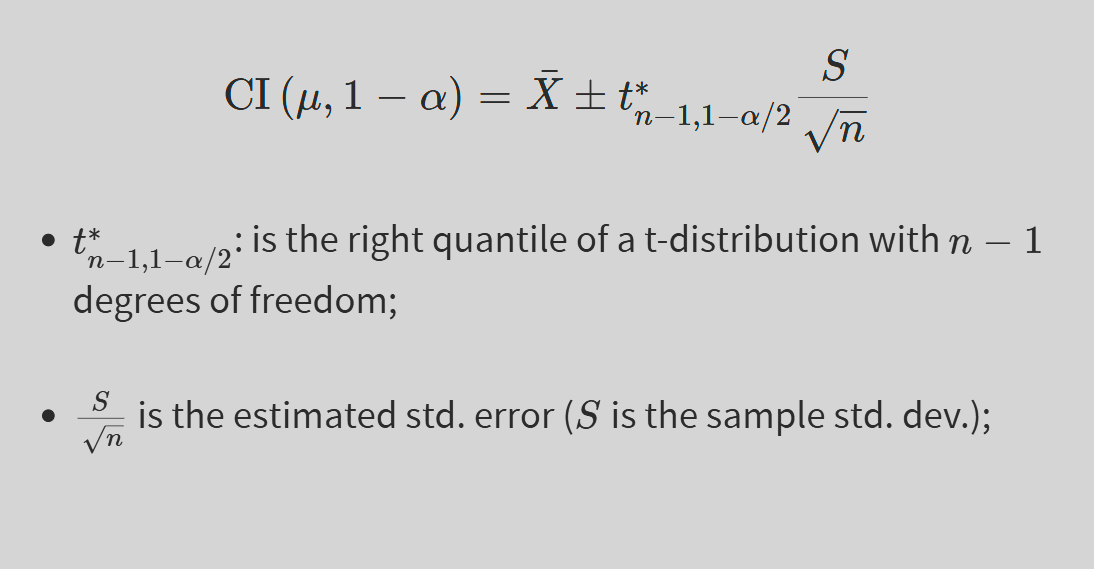
Code for confidence interval for one mean using a t-dist
when specifying a quantile from a t distribution (t*), you need to specify the degrees of freedom, as well as the quantile you want
1−α is the confidence level (e.g., 95% confidence means α=0.05).
X- is the sample mean, an estimate of mu
tn−1,1−α/2 is the critical t-value from the t-distribution with n−1 degrees of freedom.
S is the sample standard deviation (since the population standard deviation σ\sigmaσ is unknown).
S/sqrt(n) is the standard error of the mean.
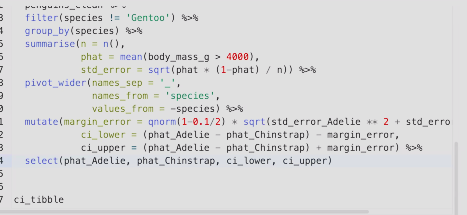
CI difference in proportions

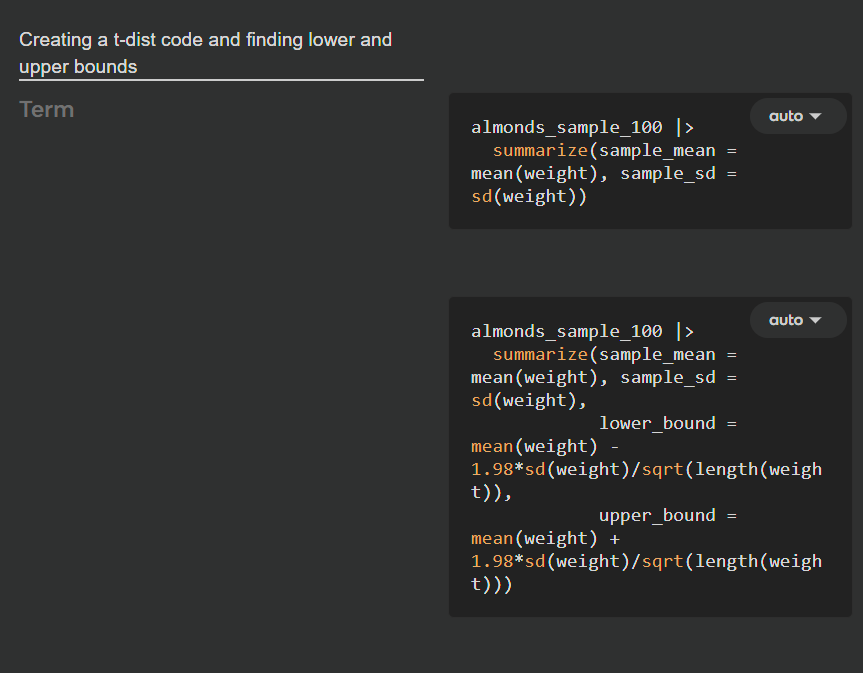
t-dist code
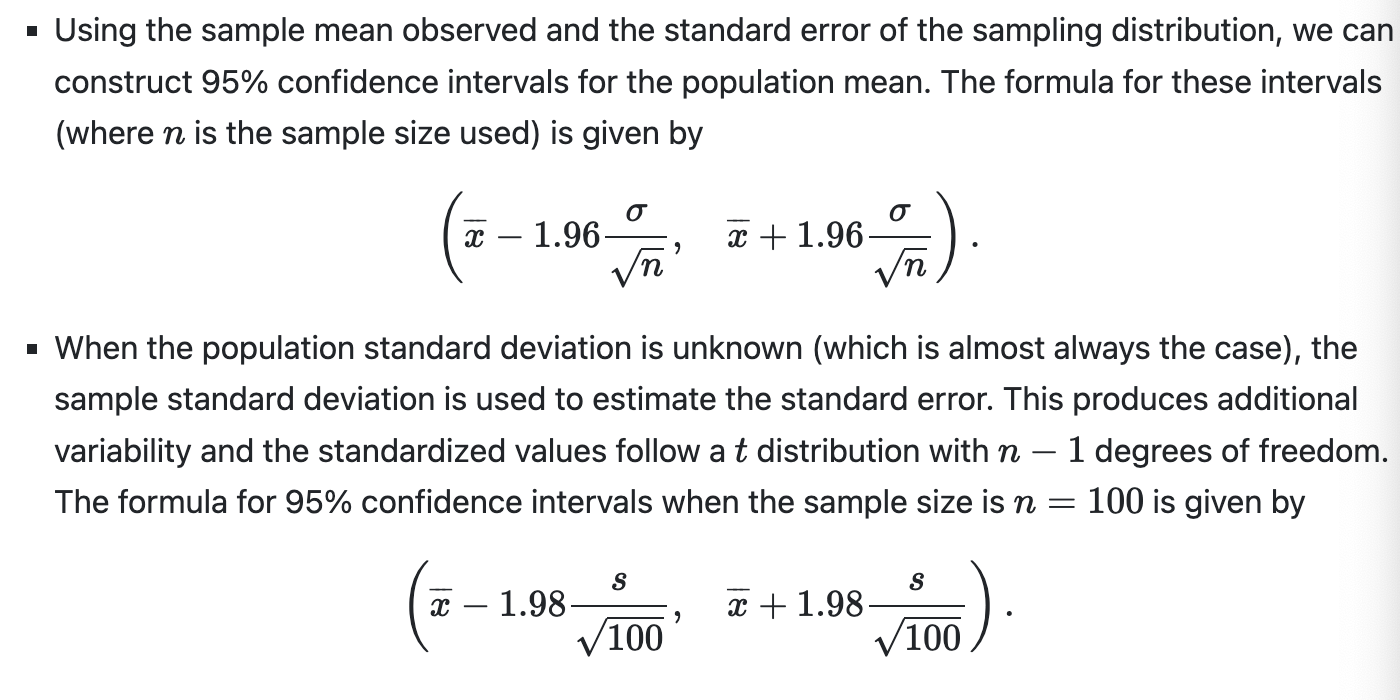
Comparison between construction of CI with and without known sigma
95% corresponds to 1.98 in a t-dist. since the area becomes n-1 = 99
so then z score moves down
t_critical <- qt(0.975, df)