Machine Learning
1/82
There's no tags or description
Looks like no tags are added yet.
Name | Mastery | Learn | Test | Matching | Spaced |
|---|
No study sessions yet.
83 Terms
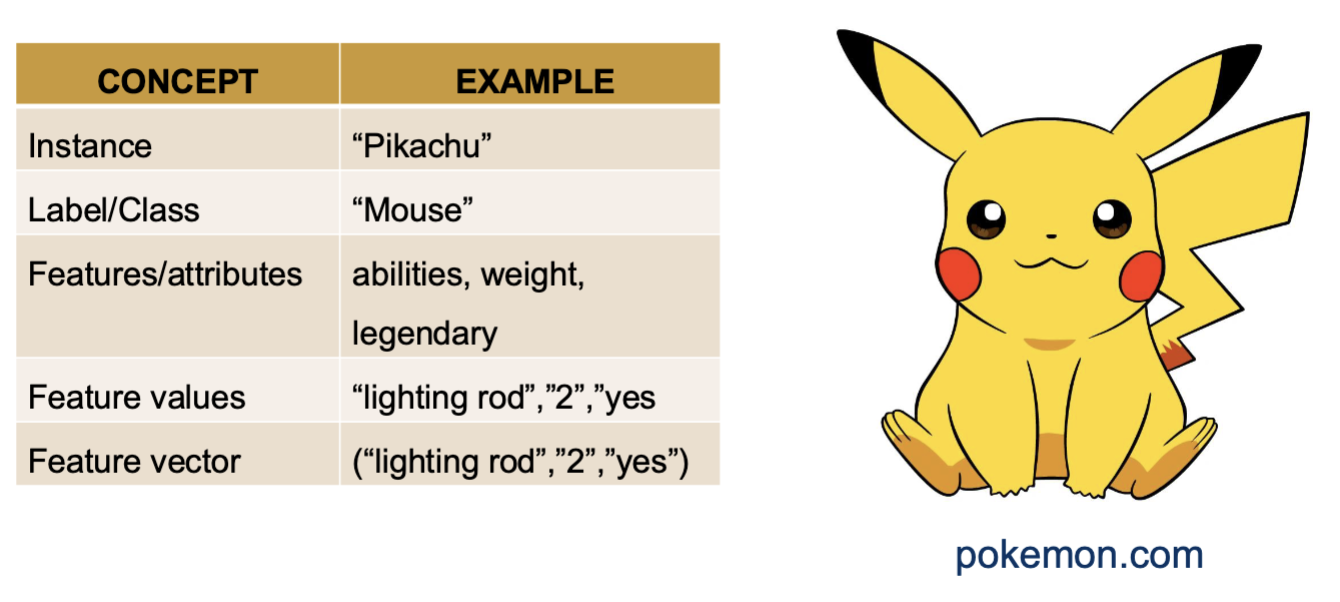
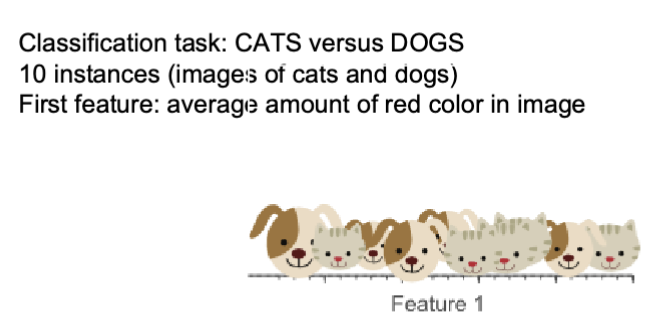
What is machine learning?
Teaching a computer to do a task using “data” (ex. examples of what we want it to do)
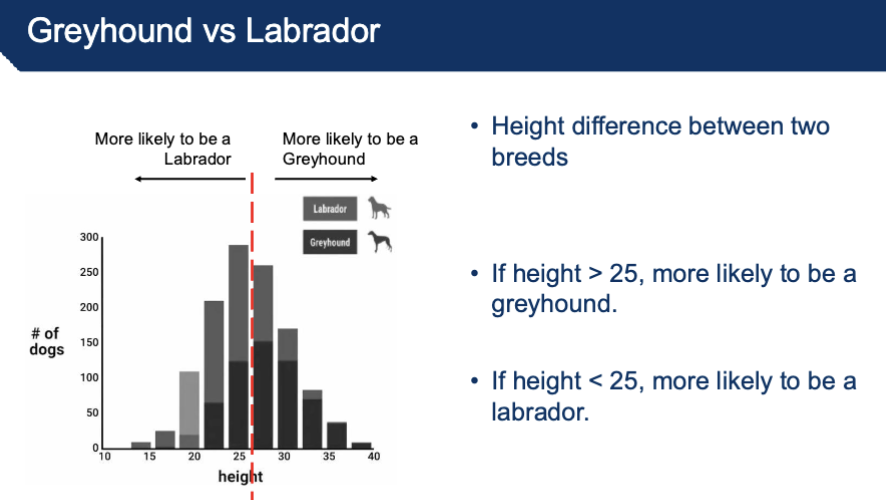
ex. trying to distinguish between a greyhound vs labrador
Create Dataset: Collect some examples of Greyhounds and Labradors
Collect photos of dogs in each breed
Describe each dog to the computer
Height of specific dog *
Weight
Color
*machine learning doesn’t predict randomness but instead learns from patterns in the data + learning from experience
exposure to more data increases learning quality → optimization issue (trying to minimize error)
How do you increase the prediction quality in machine learning - distinguishing between a labrador vs greyhound?
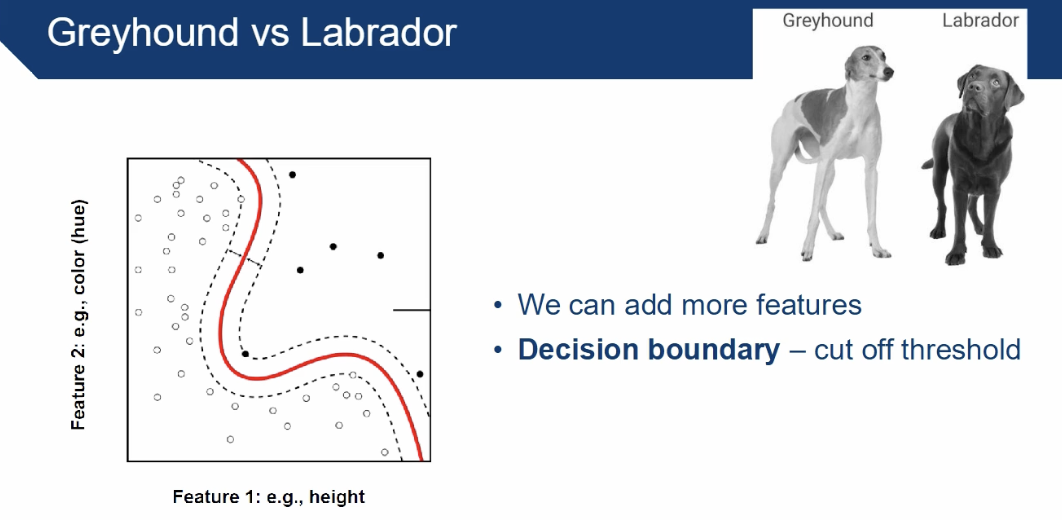
Adding more features increases the prediction quality
too many features = exhaust resources
too little features = more errors
feature value = ex. 68 years, male
target value = ex. has diabetes
feature = ex. age
Decision boundary - cut off threshold
Why did machine learning become more relevant?
The evolution of digital data → huge expansion
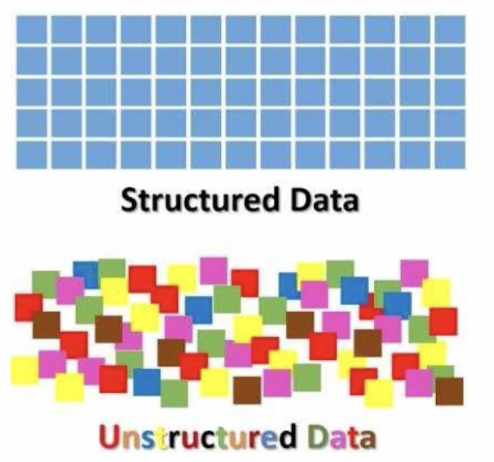
used to have structured data → highly organized, excel spreadsheets..
now we have unstructured data → emails, text and video files, pictures, satellite data…
Volume of data collected grows daily
More than 90% of the data in this world within the past two years!!!
Data is cheap and abundant but ... knowledge is expensive and scare
To make sense of all the unstructured data: we need knowledge discovery
Machine learning: computers learn from data to aid knowledge discovery
What are the 3 main branches of machine learning?
supervised learning: have data and labels, model predicts a label for new data
unsupervised learning: might not have labels, bunch of cat pics but no labels, without any prior labeling
reinforcement learning: reward system, maximize reward, system learns by doing
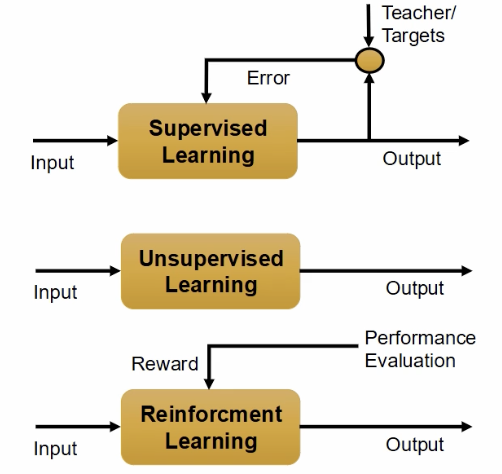
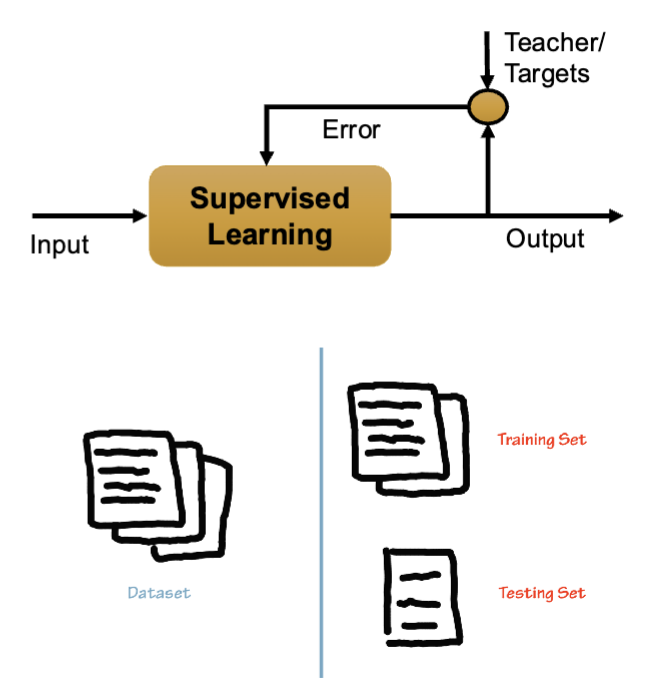
Describe Supervised learning
Given a set of data and labels, a model learns to predict a label for new data, labels
• Given D = {Xi,Yi} learn a model (or function) F: Xk → Yk
Often used to automate manual labor
ex. you might annotate part of a dataset manually, then learn a machine learning model from these annotations, and use the model to annotate the rest of your data
examples:
Given a satellite image, what is the terrain in the image?
Xi = pixels (image regions), Yi = terrain type
Given some test results from a patient, will the patient have diabetes?
Xi = test results, Yi = diabetes/no diabetes
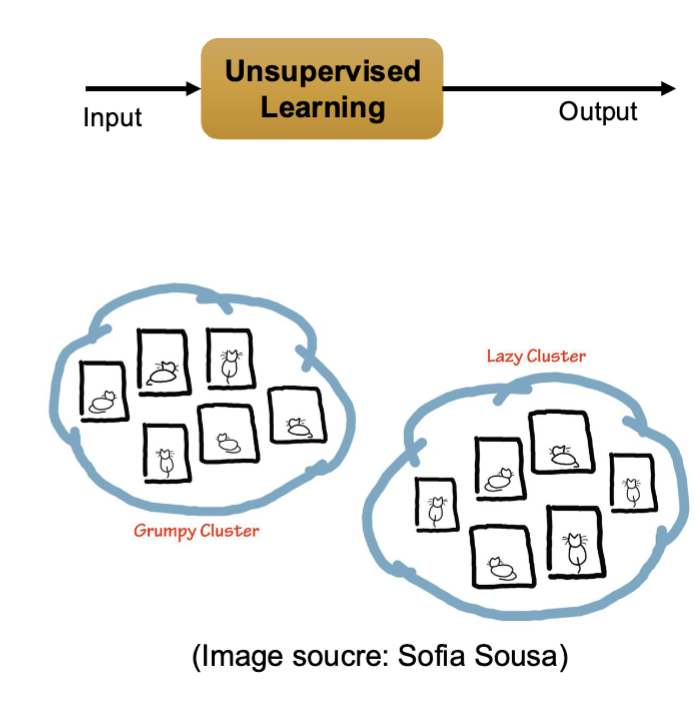
Describe Unsupervised learning
Discover patterns in data, no labels
Given D = {Xi} group the data into Y classes using a model (or function)
F: Xi → Yj
examples:
Discovering trending topics on Twitter or in the news
Grouping data into clusters for easier analysis
Outlier detection (ex. Fraud detection and security systems)
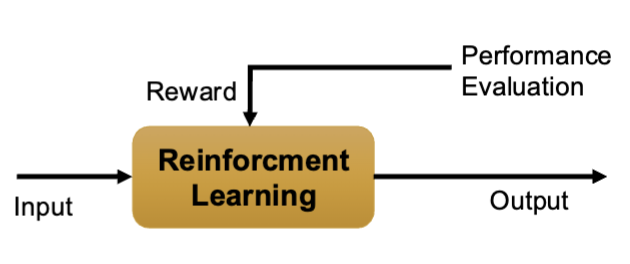
Describe Reinforcement learning
Reasoning under uncertainty to make optimal decisions, reward mechanism, optimization of minimizing error
how agents should to take actions in an environment to maximize some reward.
Given D = {environment (e), actions (a), rewards (r)} learn a policy and utility functions:
policy: F1: {e,r} → a
utility: F2: {a,e} → r
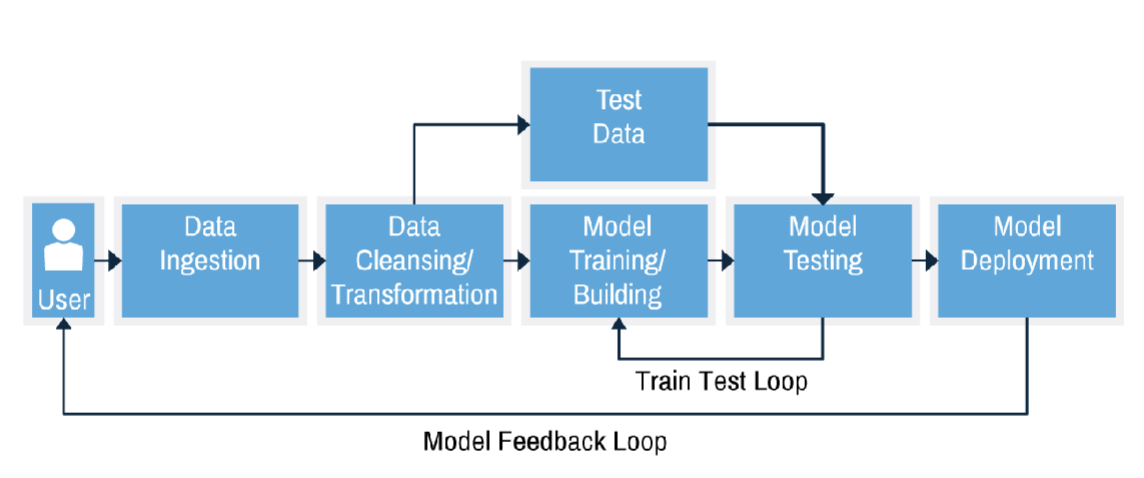
Describe Machine Learning workflow
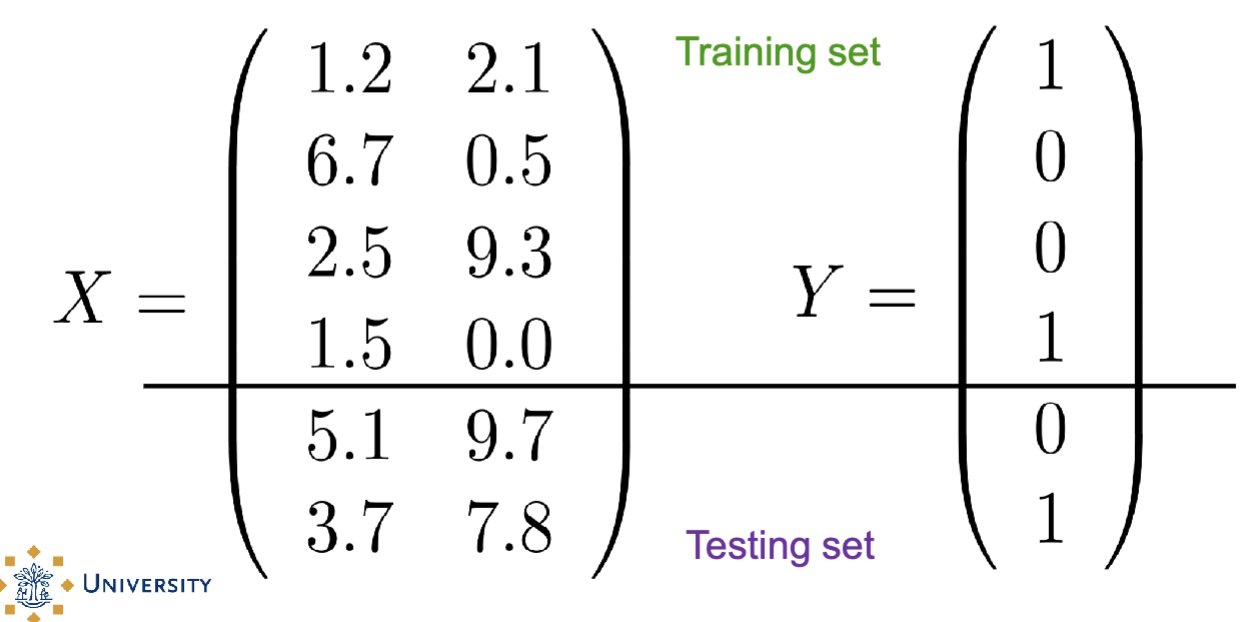
user gets data, you choose algorithm and clean data, include and exclude data, split label data into training set test set, learn the model, test learned relationship on unseen data
Pre-processing data is related to which model you use
What is a model and score functions/score metrics?
A model: an equation that links the values of some features to the predicted value of the target variable; finding the equation (and coefficients in it) is called ‘building a model’ (see also ‘fitting a model’).
Score functions/Fit statistics/Score metrics: measures of how well the model fits the data.
What is feature selection and extraction?
Feature selection: reducing the number of predictors by selecting the important ones (dimensionality reduction).
Feature extraction: transform the data onto a new feature space by means of a mathematical operation (ex. PCA).
decreases number of features
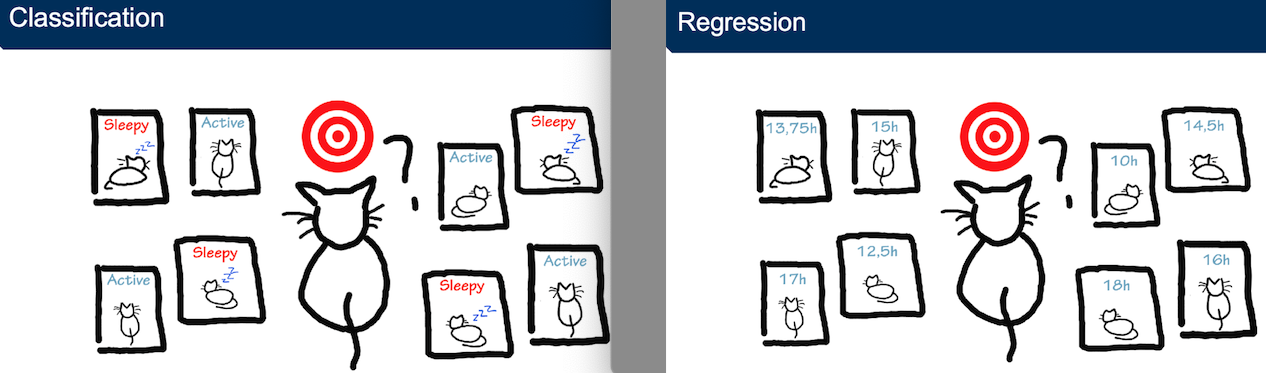
What are the 2 main types of supervised learning?
classification: discrete output (labels)
ex. color, yes/no
examine the stats of two football teams and predict which team will win tmmrs match, discrete task
regression: continuous output (numbers)
ex. temp, age, distance
predict numerical value: predict the number of microsoft shares that will be traded tomorrow
binary classification: used to predict only 2 discrete-valued outputs such as 0 and 1
What are the DummyClassifier and DummyRegressor?
Do not generate any insight about the data
Serve as a simple baseline to compare against other, more complex classifiers/regressors
see how much better your model is compared to randomness
DummyClassifier
classifies the given data using only simple strategies; most-frequent, uniform, constant...
if mean is always closer to actual label, DummyClassifier beats you
DummyRegressor
makes predictions using simple strategies; mean, median ...
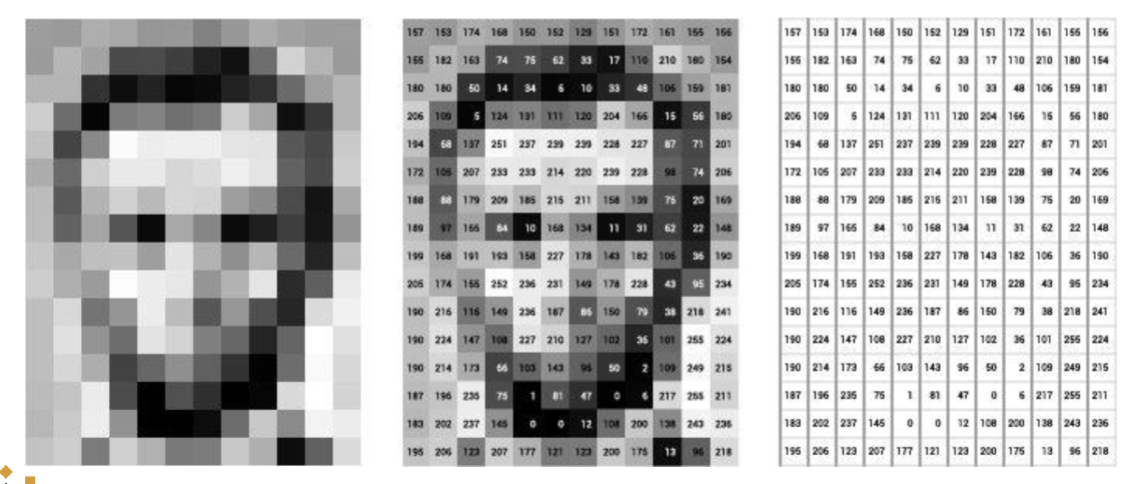
Describe Images used for machine learning data
Computers work with numbers
Images are arrays of numbers (RGB values for each pixel)
every pixel has a depth and a further grey scale, computer understands numerical values
number of pixels gives you number of features in dataset
Describe Text used for machine learning data
Words/ Letters need to be converted in a format computers can understand
have unstructured sentences, split by spaces (tokenize)…
issues with space to store all of this → use too much memory to store as 0 and 1 so they store the location of it instead (smaller dataset)
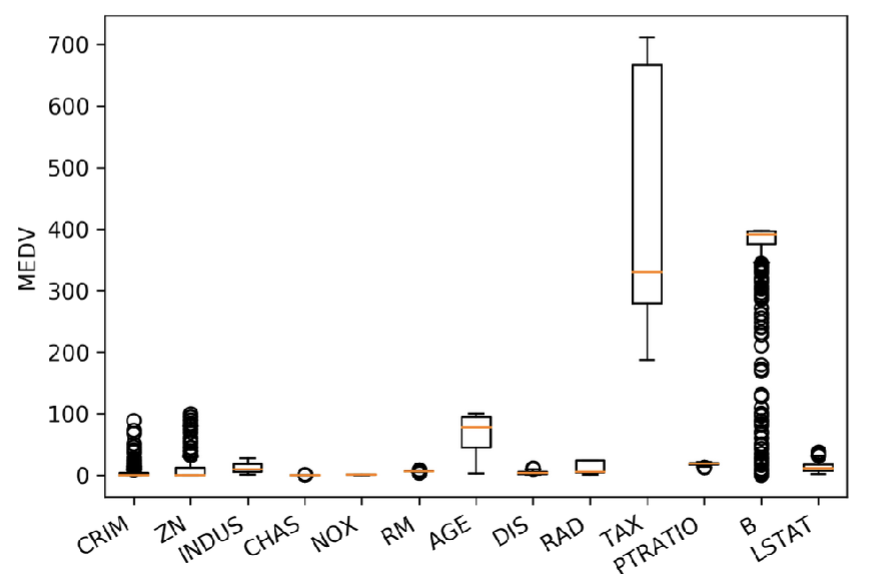
What happens with scaling data? - preprocessing
With few exceptions, Machine Learning algorithms don’t perform well when the input numerical attributes have very different scale
scales of features are different from each other so the feature with largest scale could have too much power to determine outcome → prevent this by scaling the data down
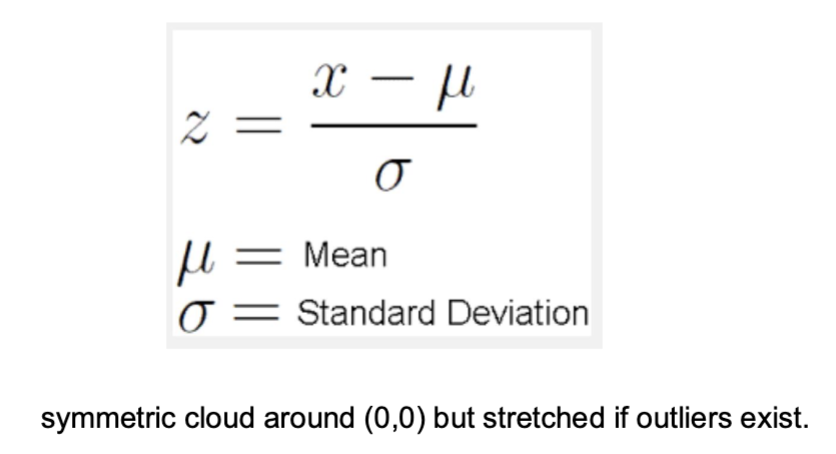
What is the standard scaler?
z-scores (standard scores): mean of 0 and standard deviation of 1
common method in data normalization (good for non-skewed data)
*outliers have more weight when determining the mean
What is the robust scaler?
Same as Standard Scaler, but with median instead of mean and interquartile range instead of standard deviation.
Better for skewed data
Deals better with outliers
*tighter cluster around (0,0), with axes more stable, outliers less extreme
What is the MinMax scaler?
Shifts data to an interval set by xmin and xmax
*between 0 and 1 interval
What is the normalizer?
Does not work by feature (column) but by row
Each row of data is rescaled so that its norm (magnitude) becomes 1, but the relative proportions of features within that row are preserved.
Compute the norm of the vector (square root of the squared elements)
Divide each element by the norm
Used only when the direction of data matters
Helpful for histograms - Histograms often compare feature distributions across samples, Without normalization, histograms could be dominated by the largest- magnitude samples
*scales things per row, makes the length of every vector 1, good for histograms
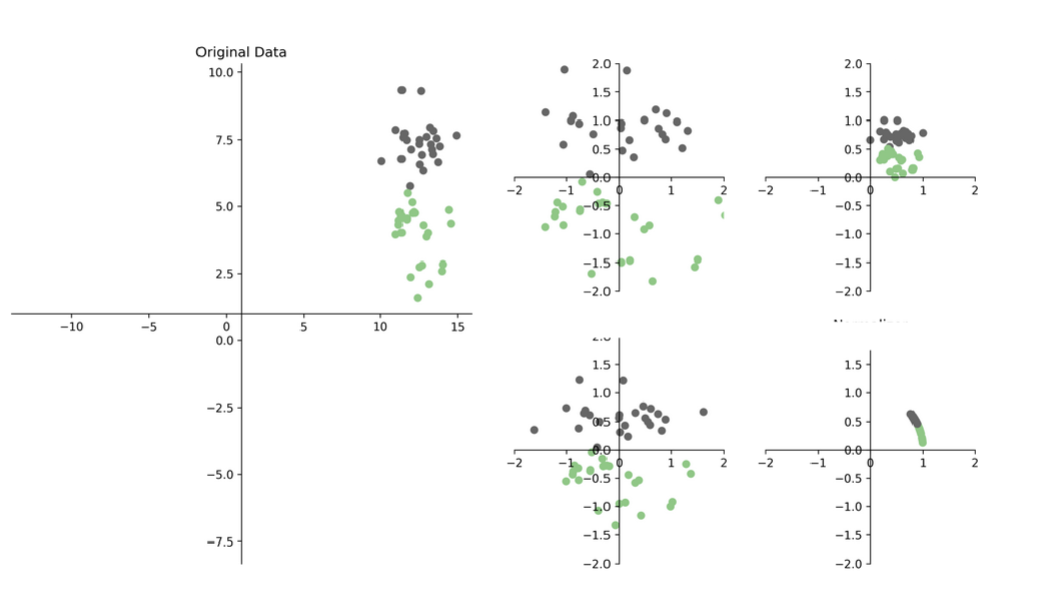
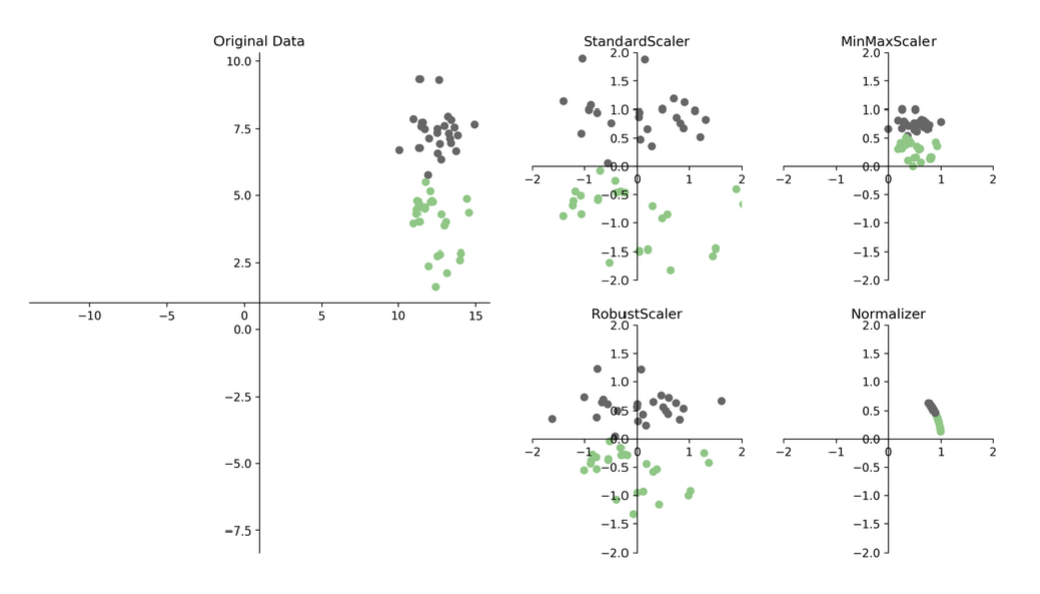
What are the 4 types of scaled data?
standard → more scattered
robust → tighter
minmax → between 0 and 1
normalizer → height of 1
What are Univariate Transformations?
Examples of univariate transformations: logarithmic, geometric, power ...
Most ML models perform best with Gaussian distributed data (bell curve)
Methods to transform data to Gaussian include Box-Cox transform and Yeo-Johnson transform
Parameters can be automatically estimated so that skewness is minimized and variance is stabilized
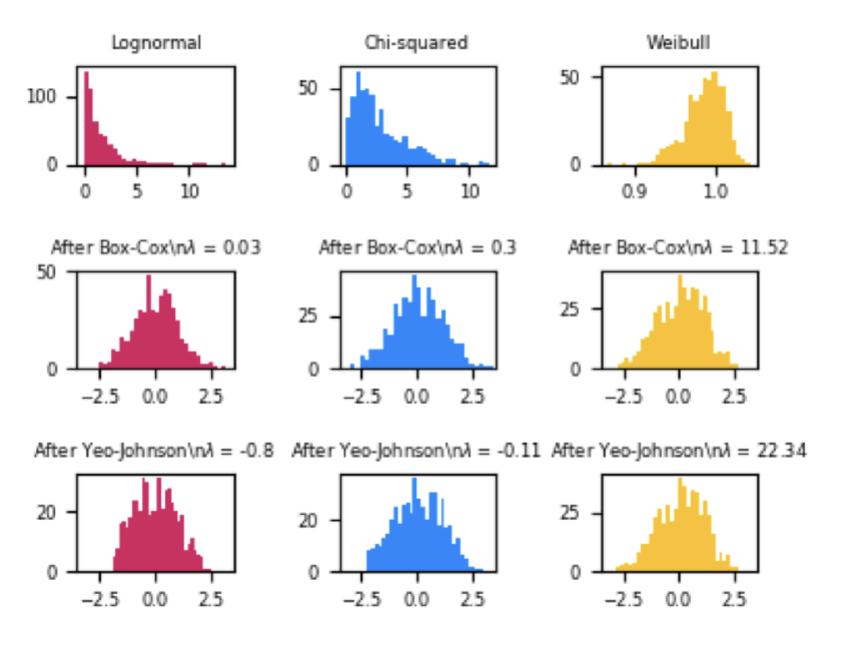
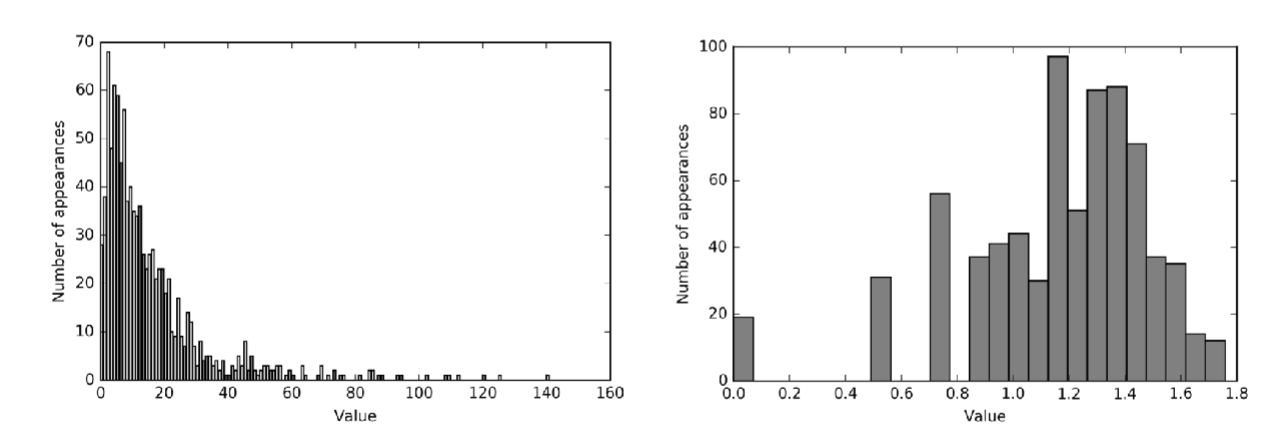
How do you transform to the log scale? - Univariate Transformations
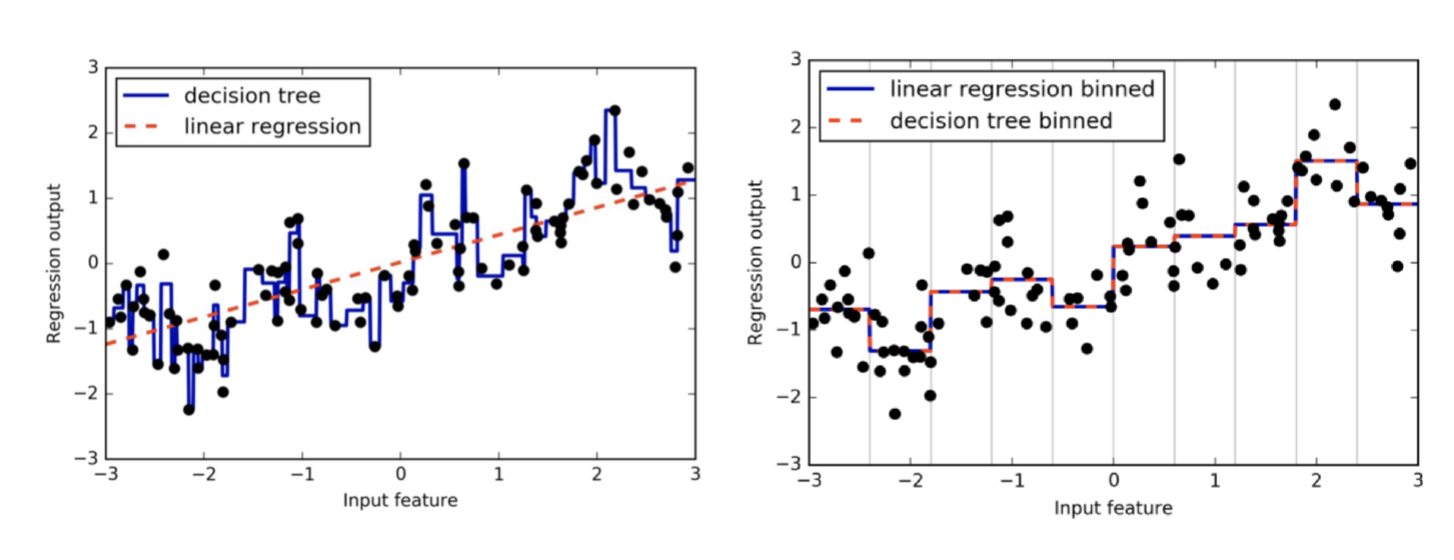
What is Binning?
Separate feature values into n categories (ex. equally spaced over the range of values)
Replace all values within a category by a single value, ex. mean
Effective for models with few parameters, such as regression, but not effective for models with many parameters, such as decision trees
*way of preprocessing the data, but not common practice
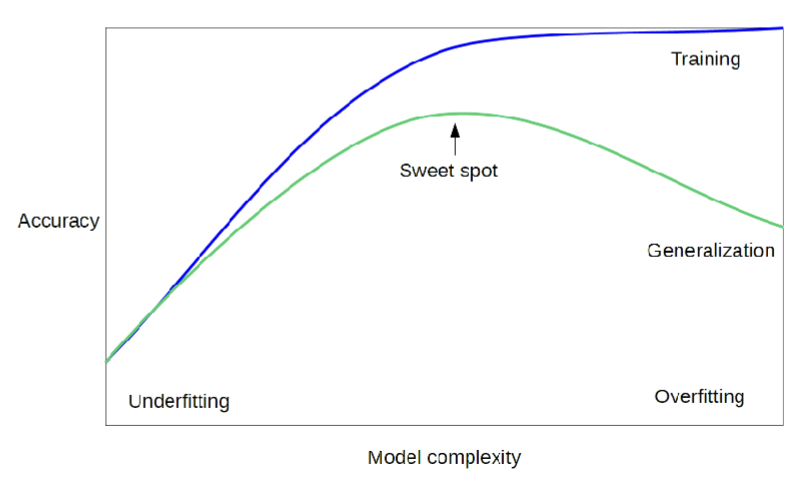
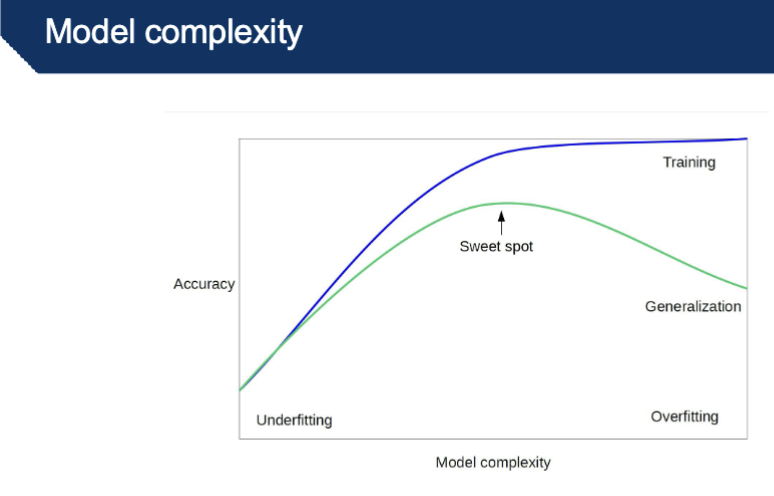
What does it mean to measure classification success?
How “predictive” are the models we have learnt?
New data is probably not exactly the same as the training data
What happens if we overfit our data?
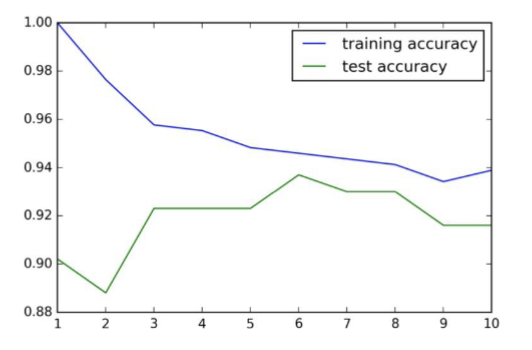
*accuracy is a way to measure how well your model generalizes to unseen data, a more complex model = accuracy goes closer to 1
green = test set
blue = training set
overfitting: model is 100% tailored to training set
underfitting: model isn’t 100% tailored to training set
How to you avoid over-fitting?
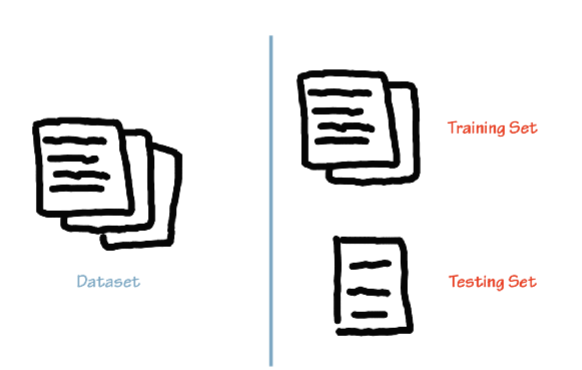
Build a classifier using the training set and evaluate it using the test set
use more data points for training set, make it more representative of the data universe
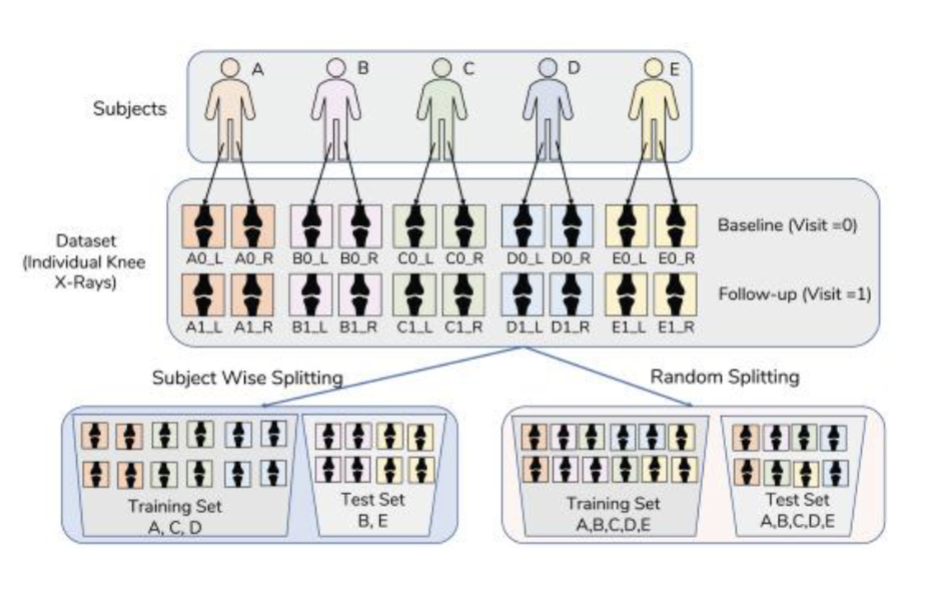
Subject-wise splitting
you want to include all the info on patients in either training or test set
leakage = not including all data on humans in either training or test set
What is cross validation?
To evaluate (test) your model’s ability to predict new data
Detect overfitting or selection bias
What is a cross validation technique?
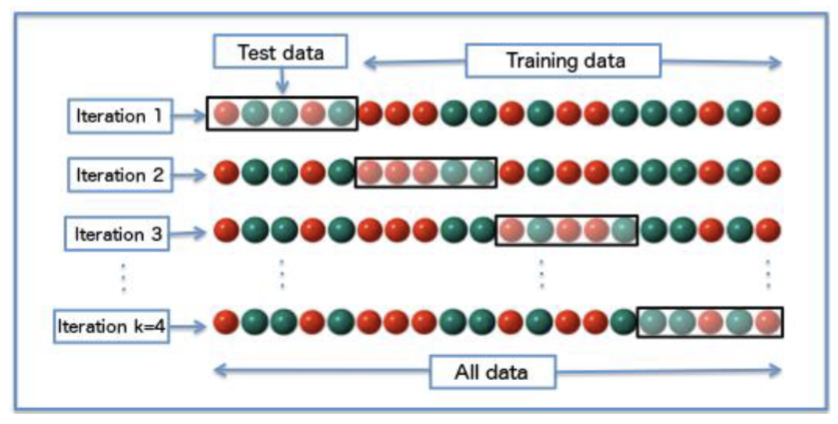
K-fold cross-validation
leave one out (K-fold cross-validation to the extreme)
*split data into tables and in each batch use as training or test set so all data points are used in the model, calculate accuracy 4 times…
*important for small datasets
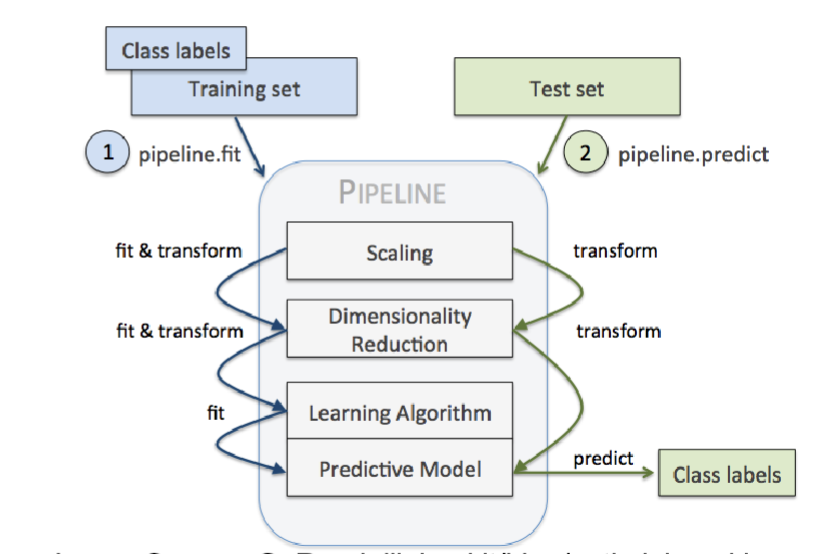
What are Machine learning pipelines?
Workflows to execute a sequence of tasks
Data normalization (scaling)
Imputation of missing values
Dimensionality Reduction
Classification
What is clustering?
Making a new classification system for pokemon characters according to similarities in their characteristic such as strength, speed, defensiveness → features, unsupervised learning, no labels
Lecture 2 - Feature Engineering
What is Missing Values Imputation?
In real world datasets, missing input values are very common
No standard encoding (blank, 0, “NA”, NaN, Null, ...)
Imputation: replacing missing value with estimate for that value
Mean / median
KNN
Model-driven
Iterative
*
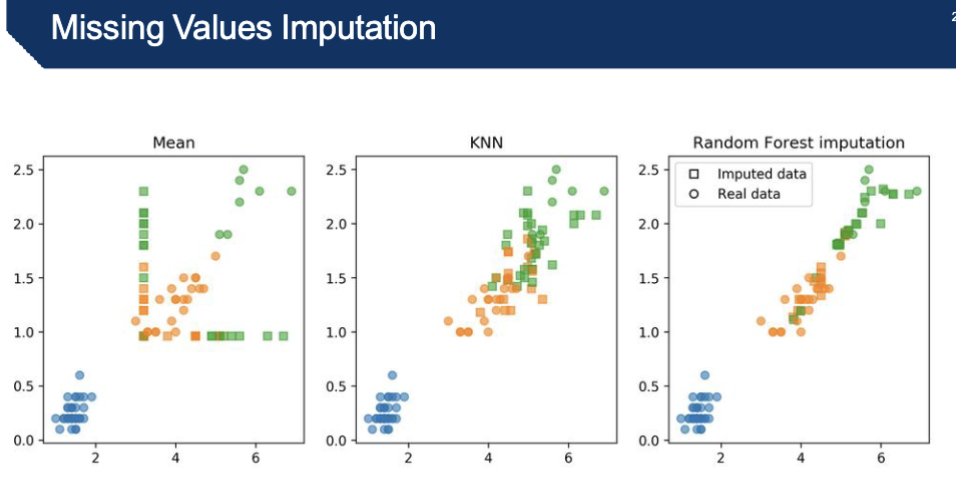
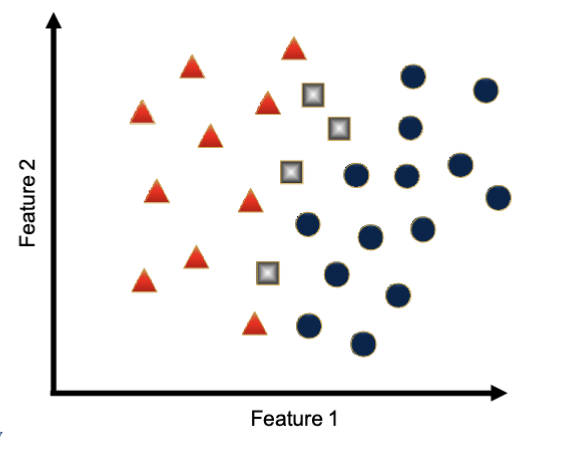
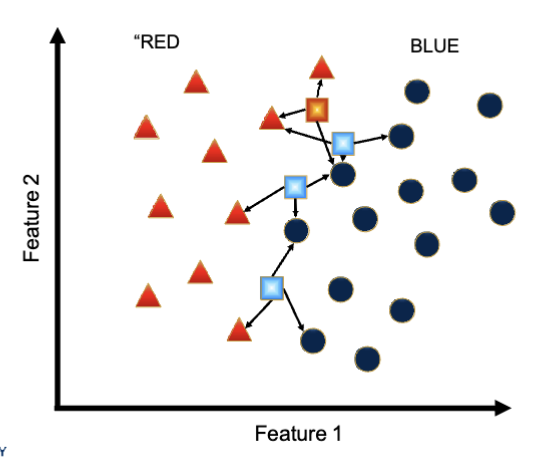
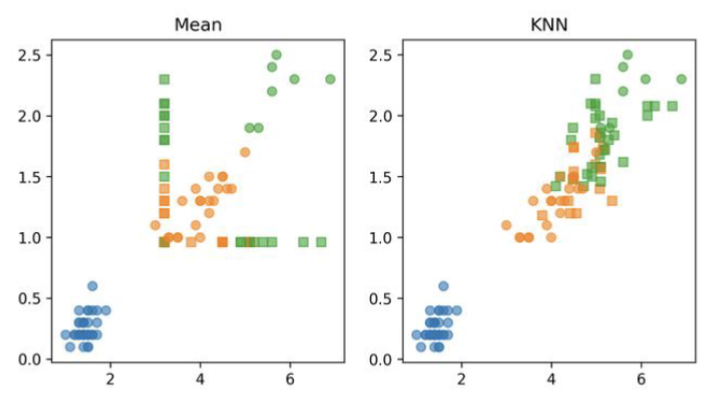
Describe the 3 approaches for missing values imputation
Mean: Taking the mean gives you an unrealistic data set
in image, rounded dots are original feature values, colors indicate labels
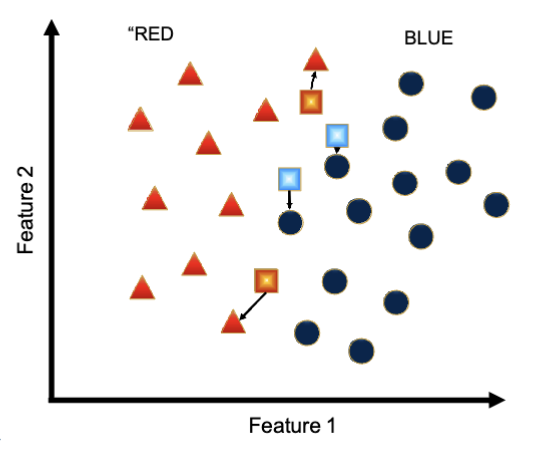
you can take another approach → KNN
KNN:
more realistic bcs all the squares are in the neighborhood of the actual data points, calculated based on things surrounding data point
k = number of neighbors you’re taking into account
*can also drop the missing value
What are categorical variables?
Data often has categorical (or discrete) features → non-numerical, no order (gender, city…)
Remember measurement levels: categorical – ordinal – interval – ratio.
Often necessary to represent categorical features as numbers.
One Hot encoding
Count-based encoding
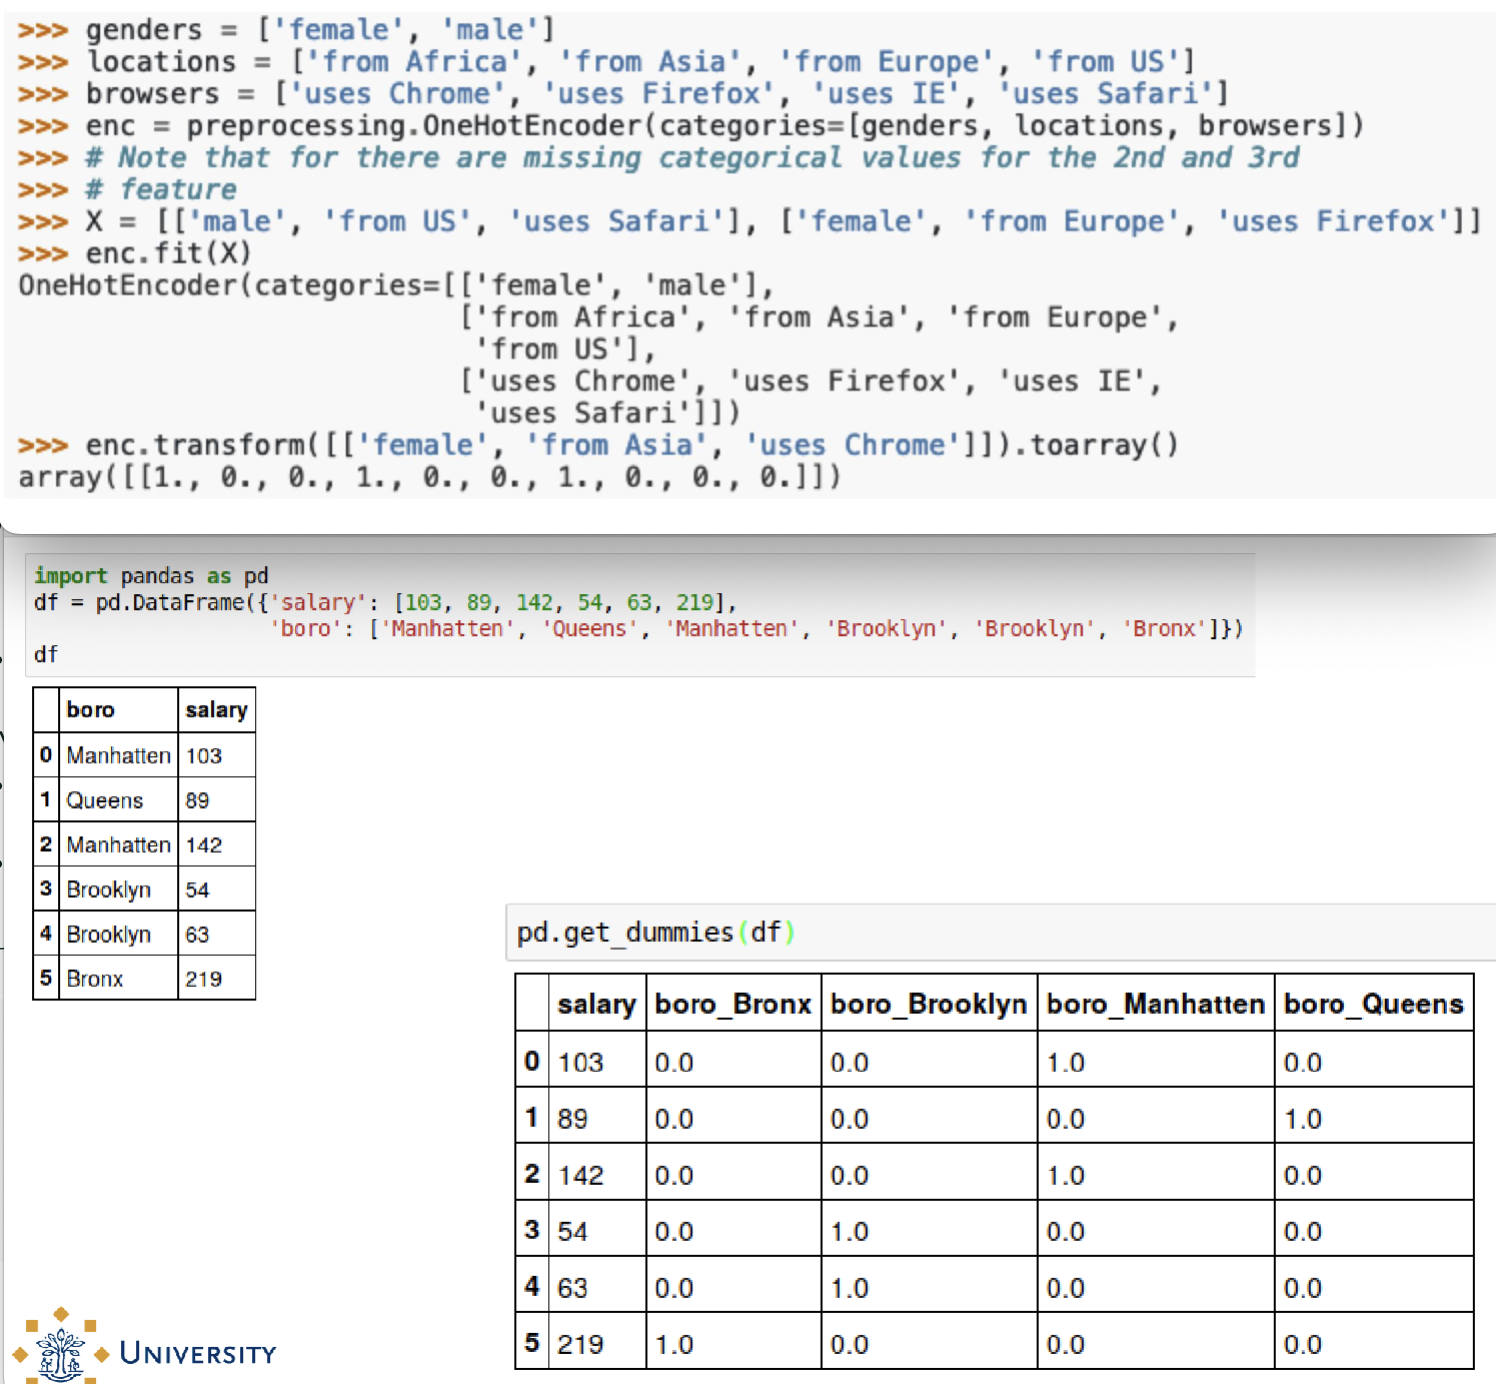
What is One Hot Encoding?
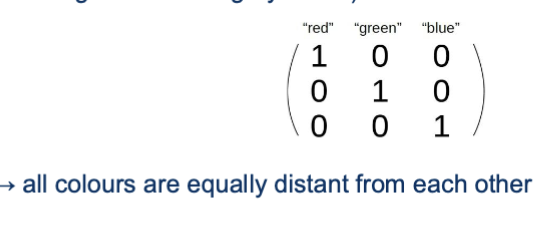
gives every category a numerical value → ex. 3 colors red,green,blue get 3 vectors of 1,0,0 + 0,1,0 + 0,0,1
*values dont have importance, more abt labeling and organizing
important that the math used by machine learning models is not affected by the encoding → impossible to use 1,2,3, ...
Adding one feature for each category (feature encodes whether a sample belongs to this category or not)
→ all colours are equally distant from each other
What is Count-Based Encoding?
For high cardinality categorical features → ex. countries
Instead of 50 one-hot variables, replace label with the value of a variable aggregated over that label.
For regression: “people in this state have an average response of y”
Binary classification: “people in this state have likelihood p for class 1”
Multiclass: One feature per class: probability distribution
*choose the average value of the concept you’re interested in, ex. for every city put the average temp
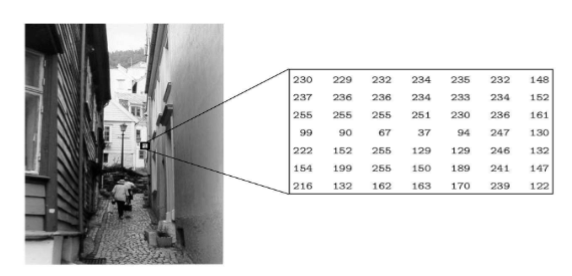
Describe how digital images are processed
The values are all discrete and integers.
Can be considered as a large array of discrete dots
Each dot has a brightness associated with it.
These dots are called picture elements - pixels
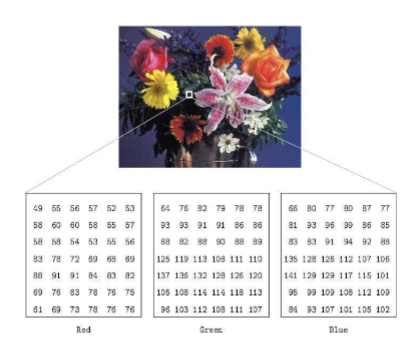
images consist of pixels, each pixel has 3 colors, each color has an intensity
every pixel is a dot, every dot has either red, green, blue
every color has intensity → has 3 values
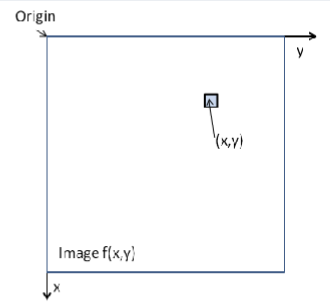
Describe Arrays and Images
Images are represented as matrices (e.g. numpy arrays)
Can be written as a function f(x,y)
Types of images: Binary Images, Grayscale Images and Color Images
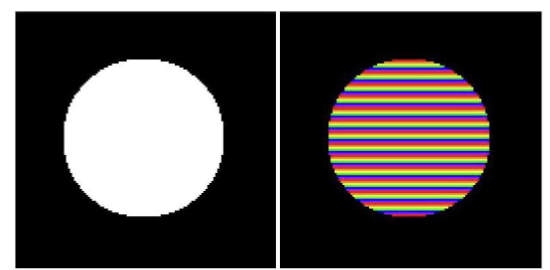
Describe Greyscale Images
Each pixel is a shade of gray
Normally from 0 (black) to 255 (white). Each pixel can be represented by eight bits, or exactly one byte.
Other grayscale ranges are used, but generally are a power of 2. (22 = 4, 24 = 64)
*only have one intensity value
Describe Multi-channel Images
Such images is a stack of multiple matrices; representing the multiple channel values for each pixel
Ex. RGB color is described by the amount of red, green and blue in it
*3 ranges, 3 values for every pixel, intensities for each color
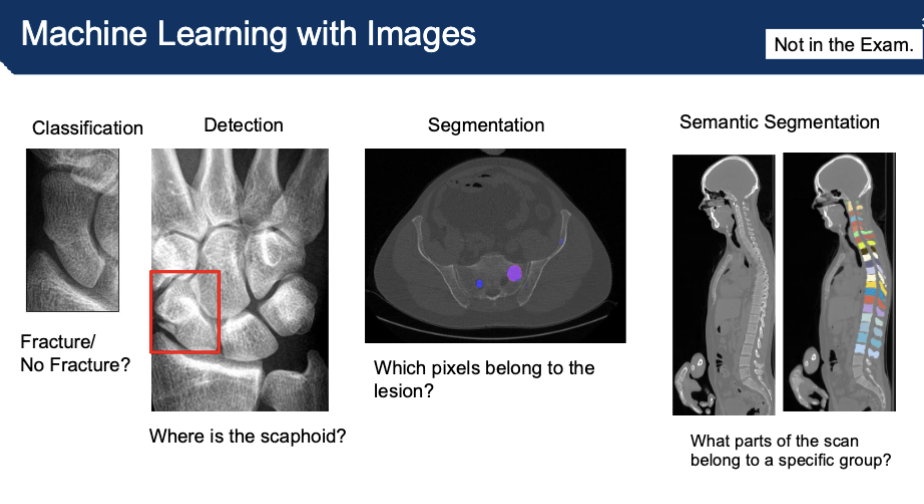
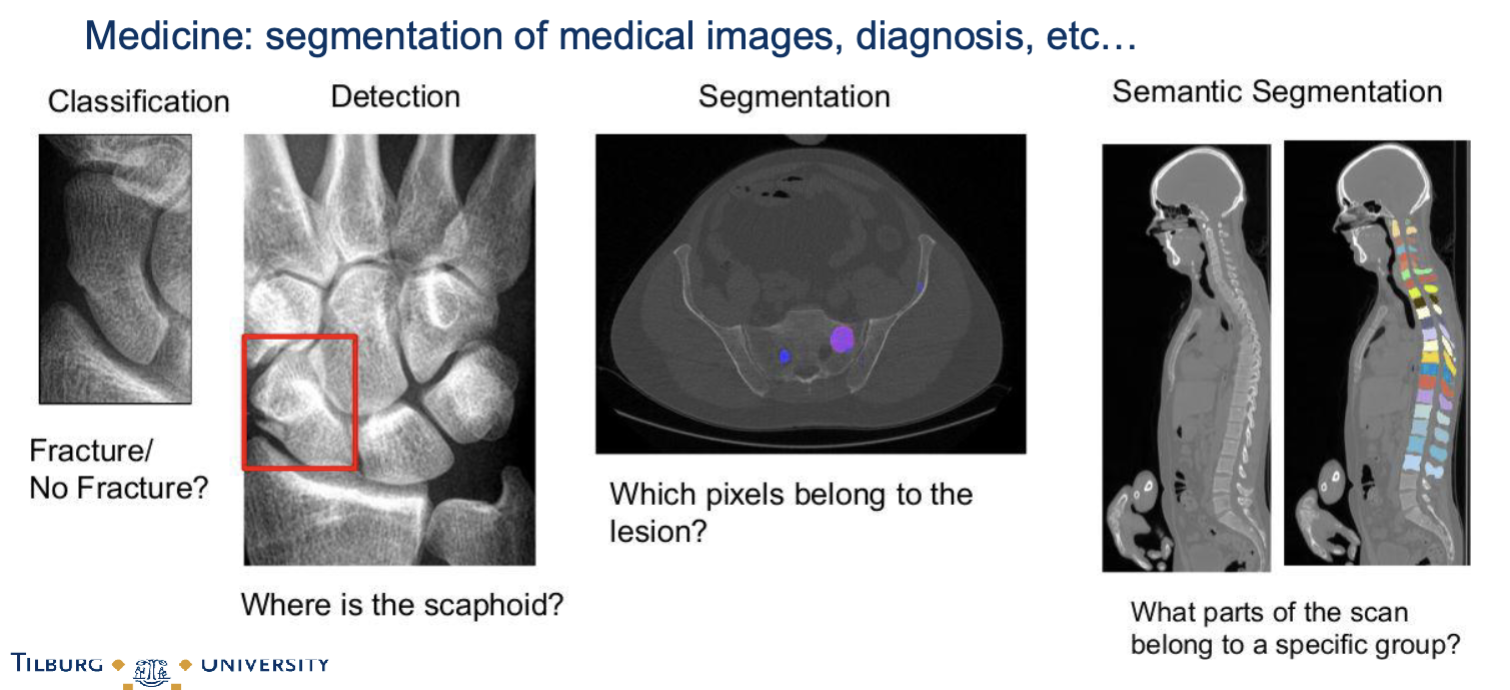
What are measures for segmentation for machine learning with images?
A segmentation result can be measured if the ground truth is known
Empirical Measures:
Accuracy, Precision and Recall
F-score, Jaccard Index
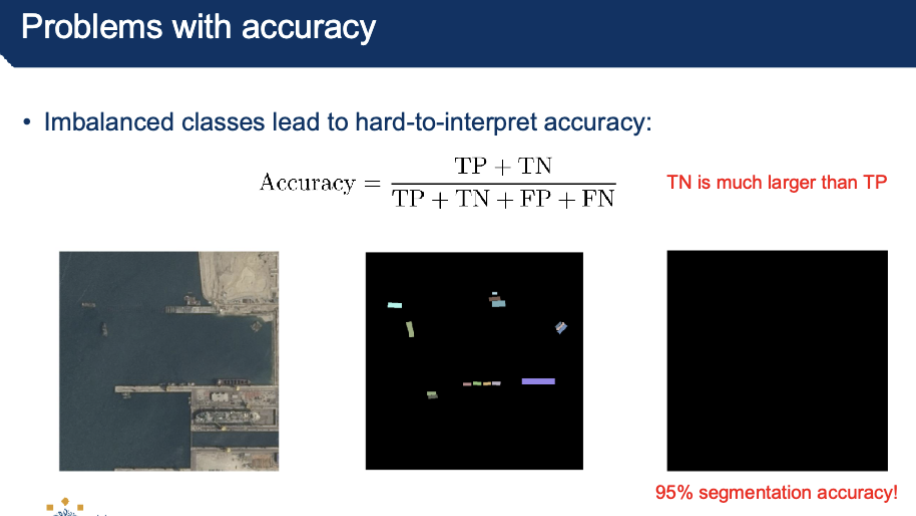
What is accuracy and what are problems with it?
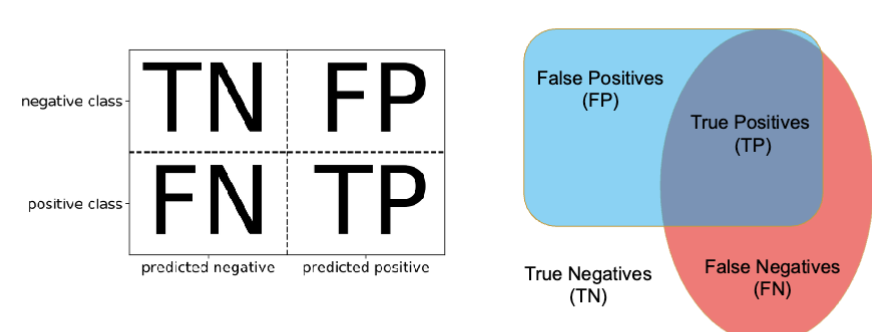
Accuracy: sum of diagonals over everything → TP+TN / TP+TN+FP+FN
Problems with accuracy:
Imbalanced classes lead to hard-to-interpret accuracy
positive = there, negative = not there
*want to minimize false positives in SPAM email case for example
*false negative = you miss smth, detrimental in healthcare diagnosis instances
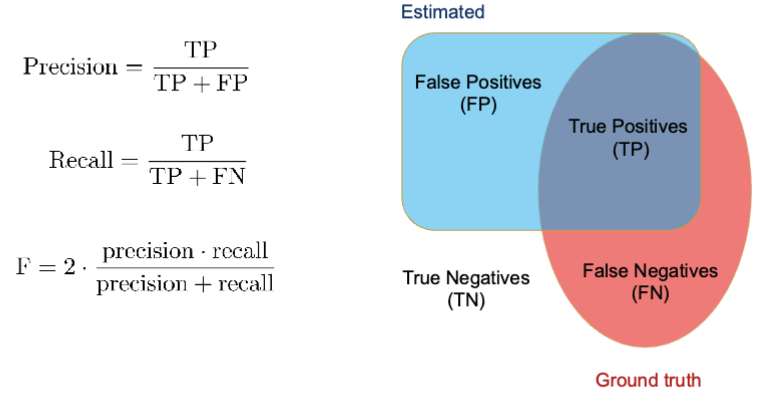
Precision, Recall, F-score
precision is inversely proportional with false positives → use to minimize FP
recall is inversely proportional with FN → use to minimize FN
*use when data set isn’t balanced
Describe how machine learning works with text data
Most Machine Learning algorithms prefer to work with numbers
So far:
Fixed number of features
Continuous
Categorical
Working with Text Data
no pre-defined features
Need to create fixed-length descriptions
*super unstructured and abundant
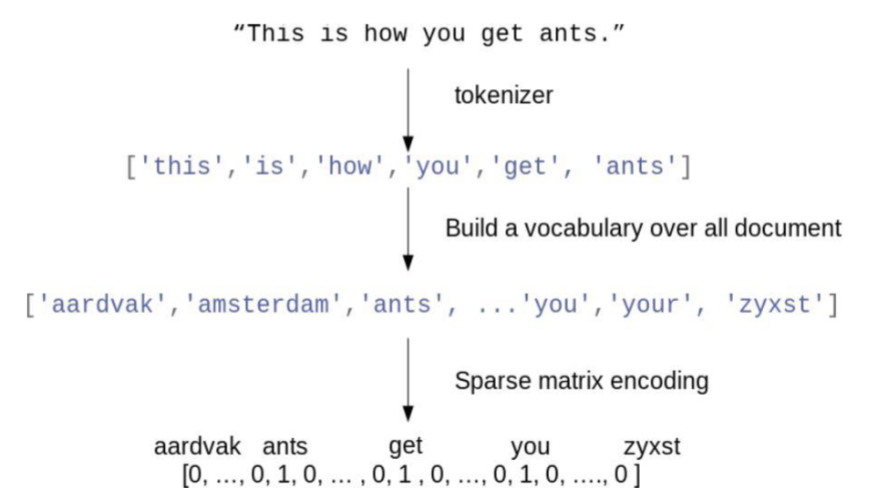
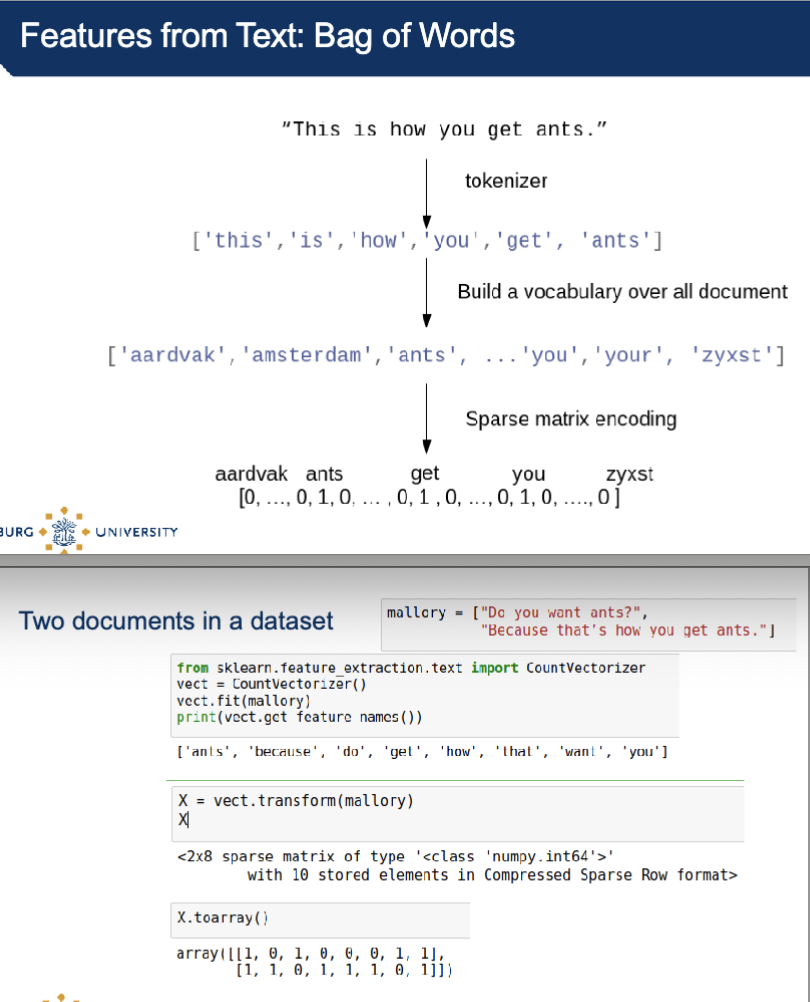
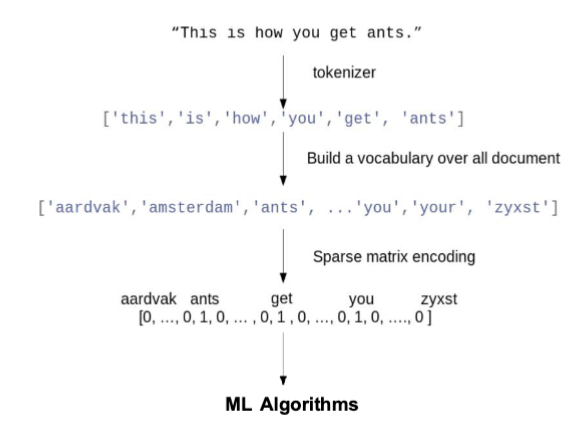
Features from text: Bag of words
split into parts: tokenizer
build a vocabulary with all the words
create a dictionary
represent into numerical form
1 = word is there
0 = word is not there
length of array = how many words you have in the document
*more 1’s means more words present
Describe Text Data Reprocessing
Tokenization — convert sentences to words
Removing unnecessary punctuation, tags
Removing stop words— frequent words such as ”the”, ”is”, etc. that have low semantic content
Stemming — words are reduced to a root by removing inflection through dropping unnecessary characters, usually a suffix.
Lemmatization —Another approach to remove inflection by determining the part of speech and utilizing detailed database of the language
What is Tokenization?
Process of breaking a stream of textual content up into words, terms, symbols, or some other meaningful elements called tokens
The list of tokens turns into input for in additional processing including parsing or text mining
Tokenization can swap out sensitive data
Ex. Typically payment card or bank account numbers—with a randomized number in the same format
What is Stemming and Lemmatization?
Stemming — words are reduced to a root by removing inflection through dropping unnecessary characters, usually a suffix.
The stemmed form of studies is: studi
The stemmed form of studying is: study
Lemmatization —Another approach to remove inflection by determining the part of speech and utilizing detailed database of the language
The lemmatized form of studies is: study
The lemmatized form of studying is: study
How do you Restrict the Vocabulary?
Removing unnecessary punctuation, tags
Removing stop words— frequent words such as ”the”, ”is”, etc. that have low semantic content
Removing infrequent words
Words that appear only once or twice might not be helpful
Restrict vocabulary size to only most frequent words (for less features)
What is Bag of Words?
Most common technique to numerically represent text is Bag of Words.
Represents each sentence or document as a vector with a value for each word in the vocabulary.
Binary: word present or absent in the document
Count: how often the word appears in the document
Popular approach: Term Frequency x Inverse Document Frequency (TF-IDF)
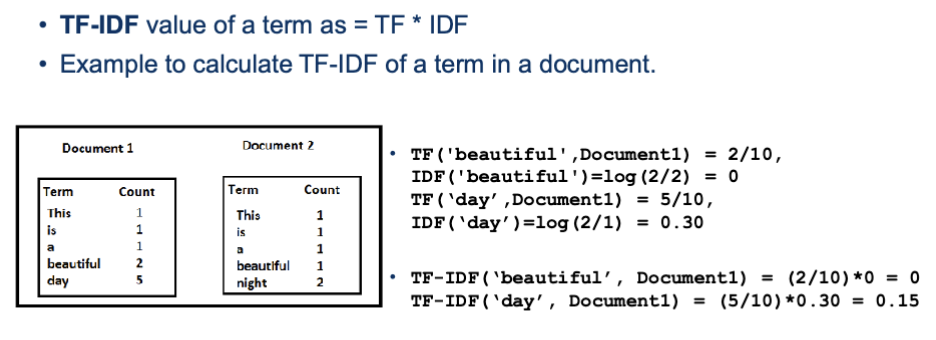
What is Term Frequency-Inverse Document Frequency (TF-IDF)?
Term Frequency (TF) = Number of times term t appears in a document/Number of terms in the document
Inverse Document Frequency (IDF) = log(N/n), where, N is the number of documents and n is the number of documents a term t has appeared in. The IDF of a rare word is high, whereas the IDF of a frequent word is likely to be low. Thus having the effect of highlighting words that are distinct.
We calculate TF-IDF value of a term as = TF * IDF
Working with Text Data
Describe Feature Selection
Why select features?
Avoid overfitting
Faster prediction and training
Less storage for model and dataset
Strategies
Univariate statistics
Model-based selection
Iterative selection
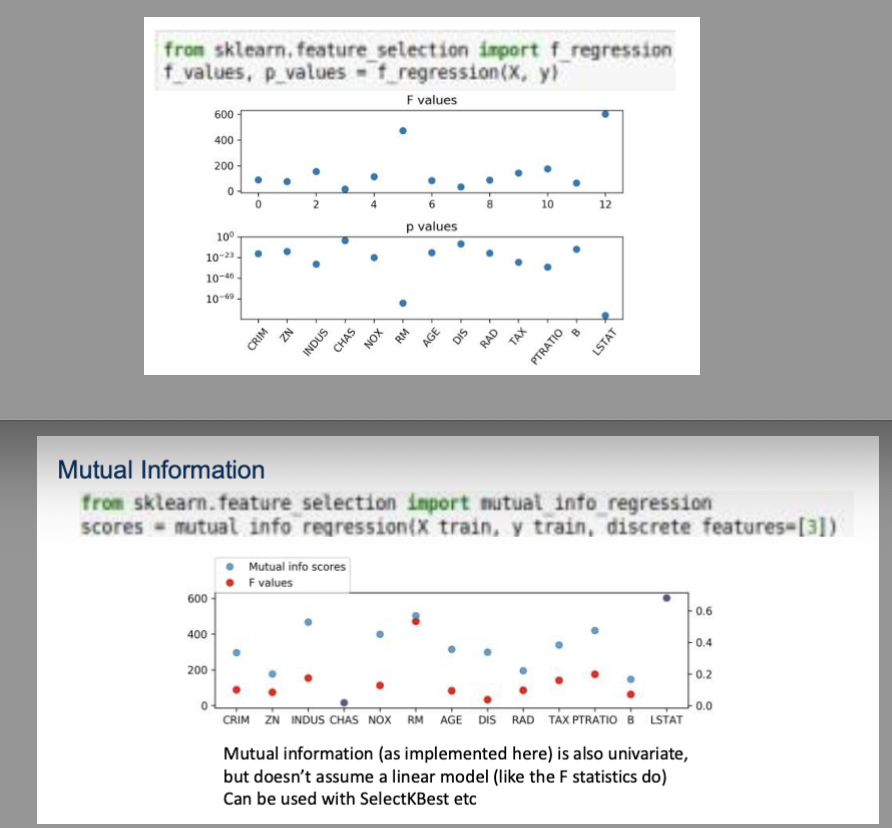
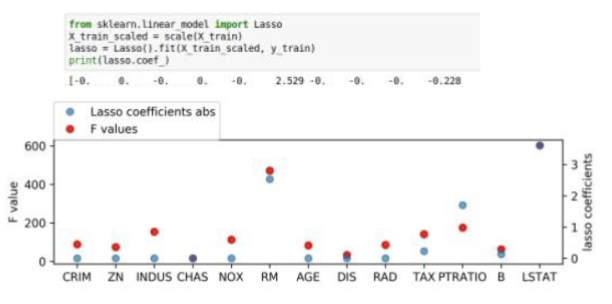
What are Univariate Statistics?
Look at each feature individually
Features will be removed if they do not have a significant relationship with the target
Features that are significant only in combination with another feature (interaction) will be removed.
Selecting features with highest confidence is related to ANOVA (from statistics)
Pick statistic, check p-values!
f_regression, f_classif, chi2 in scikit-learn
What is Model-Based Feature Selection?
Get best fit for a particular model
Ideally: exhaustive search over all possible combinations
Exhaustive is infeasible (and has multiple testing issues)
Use heuristics in practice
What is Model based (single fit)?
Build a model, select features most important to model.
Lasso, other linear models, tree-based models
Multivariate – linear models assume linear relation
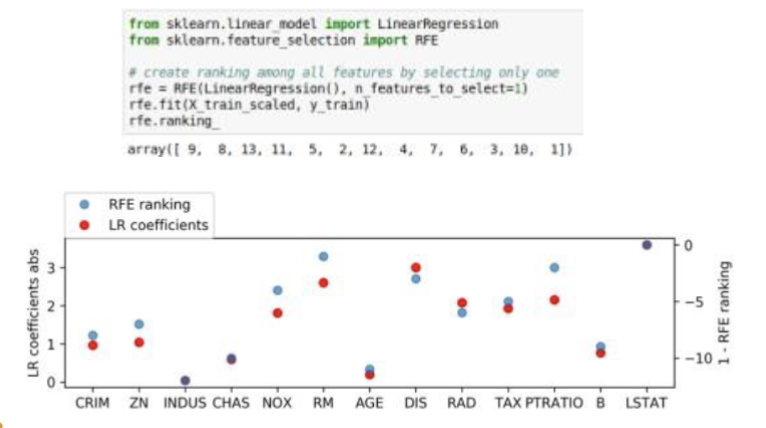
What is iterative Model-Based Selection?
Forwards: Start with single feature, find most important feature, add, iterate
Backwards: Fit model, find least important feature, remove, iterate
Computationally expensive
RFE : Recursive feature elimination and selection
LECTURE 3 - KNN
What is k-NN? (k-nearest neighbors)
way of labeling data points in the absence of labels in a dataset
k-NN can be used for both regression and classification problems → need to label data points and predict the label, you look at the nearest neighbors to determine the target value
algorithm depends on distance
k = hyperparameter (choose the value)
if k decreases you will have decision boundaries in the dataset → use the closest neighbor, might imply overfitting
k of 5 is a larger population to make a prediction
downsides: requires a lot of calculations, but doesn’t require a training process
What are the unknown data points? (1-NN)
What is the k-NN classifier?
The hyperparameter k represents the number of labeled neighbours to consider
Test points are assigned the majority label of the k nearest neighbours
Special cases:
k = N: since all datapoints are considered, the predicted label for a test point will always be the the majority label of all datapoints. Equivalent to a majority classifier.
Ties: in case of an tie between predicted labels, there are different possibilities. The most common one is random selection from the tied labels
*if k is even, it’s problematic, ambiguity in the process
What is the nearest-neighbor? (3-NN)
taking more neighbors into account can change the predicted value
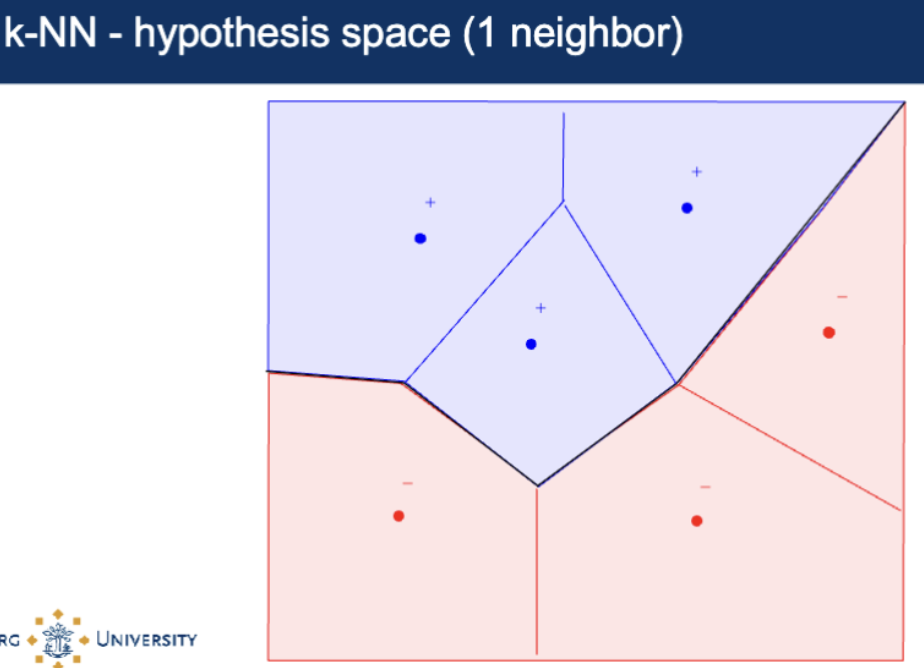
What is K-Nearest Neighbours Hypothesis Space?
two-dimensional feature space split into some regions whose centroid are the data points
concept seen in nature → skin of giraffes
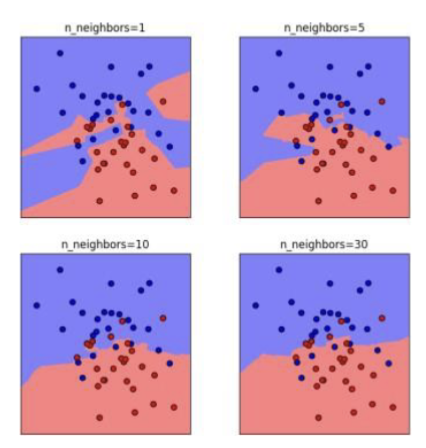
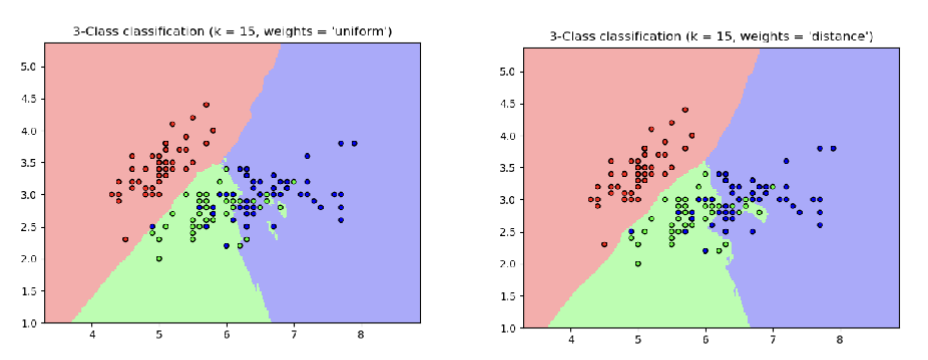
What is the influence of k on the decision boundary?
smaller k, you take into account the neighbors closest
increasing k means you have a smoother decision boundary
*large k = less complex model bcs you take a lot of data points into decision which makes the decision boundary smoother
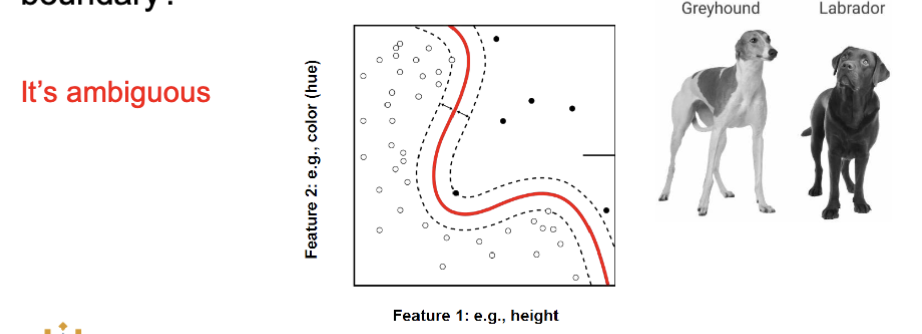
What is the label (class) of a point on the decision boundary?
it’s ambigious
you can’t make a decision on the problem with one feature
cant find the closest neighbor
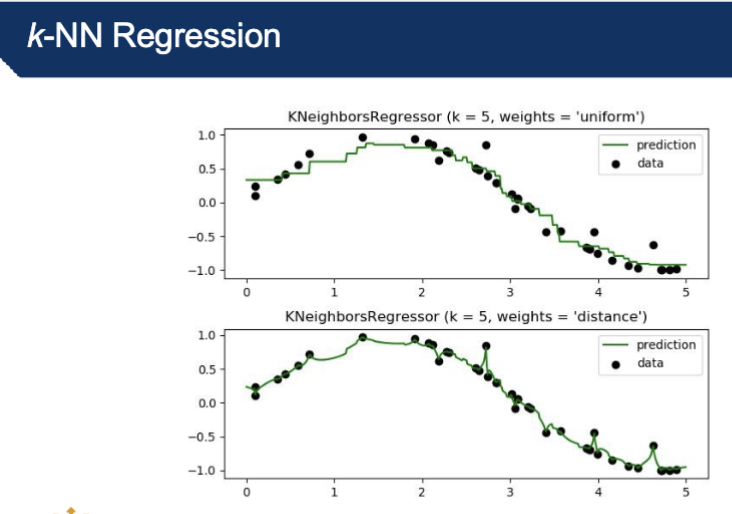
Describe weights in k-NN
weights help to make machine learning algorithms smoother
having 2 close neighbors + 1 far creates a risk → fix by applying neighbors that are closer
can make weights uniform (all have equal importance), use distance, make weights different → flexibility of k-NN
Extension of the basic algorithm: not all neighbors get an equal vote
Distance-weighting: each neighbor has a weight which is based on its distance to the data point to be classified
Inverse distance weighting – each point has a weight equal to the inverse of its distance to the point to be classified (neighboring points have a higher vote)
Inverse of the square of the distance
Kernel functions (Gaussian kernel, tricube kernel)
If we change the distance function, the results will change.
Implication: with distance weighting, k=n is no longer equivalent to a majority based classifier. Weights in k-NN
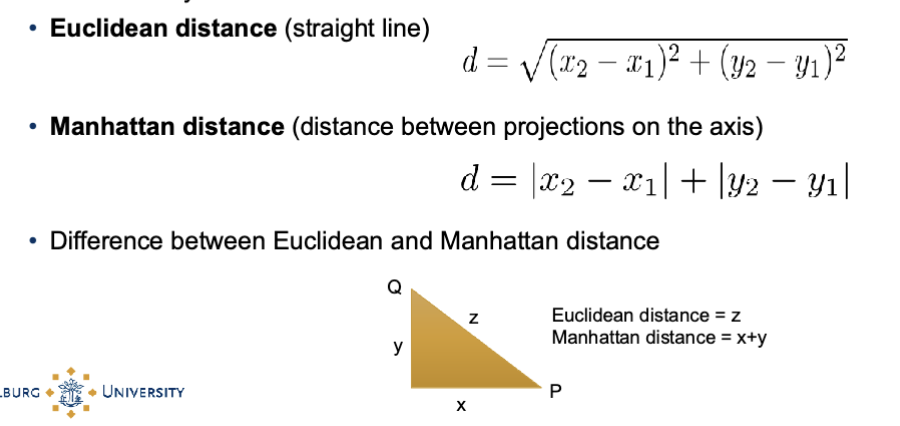
How do you compute distance in k-NN?
Different ways to define the distance function
Euclidean distance (straight line)
Manhattan distance (distance between projections on the axis)
Difference between Euclidean and Manhattan distance
How does k determine model complexity?
The model in k-NN is the decision boundary that separates the classes (In regression, the model is the line that fits the data)
Smaller k leads to more complex decision boundaries
k too low → danger of overfitting, high complexity
k too high → danger of underfitting, low complexity
*doing well on unseen data points = generalization
What is the bias variance trade off?
Variance: how sensitive the model is to small changes in the training data.
A high-variance model will give very different decision boundaries if you slightly change the dataset.
In kNN:
Small 𝑘:?
Large 𝑘: ?
Bias: how far the model’s average prediction is from the true underlying relationship.
A high-bias model makes strong assumptions and might miss important patterns.
In kNN:
Small 𝑘: ?
Large 𝑘: ?
A high-variance model will give very different decision boundaries if you slightly change the dataset.
In kNN:
Small 𝑘(e.g. 𝑘=1): decision boundary can shift a lot if just one training point changes → high variance.
Large 𝑘: more stable, since predictions average over many neighbors → low variance.
A high-bias model makes strong assumptions and might miss important patterns.
In kNN:
Small 𝑘: very flexible → low bias, because it can fit even complicated shapes.
Large 𝑘: very smooth boundaries → high bias, because it might oversimplify (e.g. blur two nearby classes to
How do you determine model complexity?
Depends on complexity of the separation between the classes
Start with the simplest model (large k in k-NN), and increase complexity (smaller k)
-trying to see generalization
-overfitting decreases w larger k value
How do you choose k?
Typically odd for an even number of classes (ex. 1, 3, 5, 7..)
As you decrease k, accuracy might increase, but so does complexity
In other words, a small value of k is likely to lead to overfitting (fitting “noise”)
A rule of thumb used by some data-miners: 𝑘 = sqrt(𝑛)
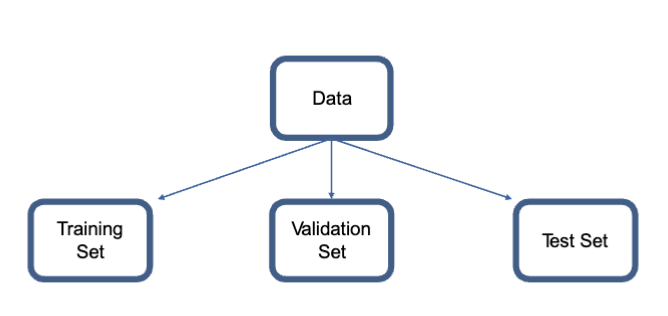
What 3 sets is your data divided into to tune hyperparameters?
training
validation
test
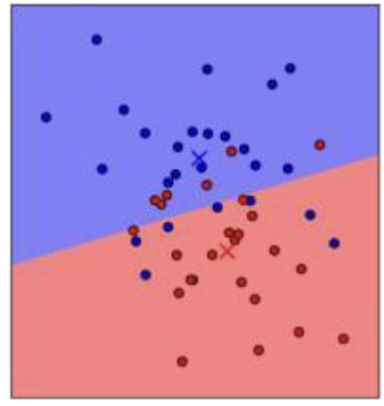
What is the nearest centroid?
simple method to take the centroid of every cross, calculate one number for one cross and then for new data points you just look at which is closer to either the blue or red cross
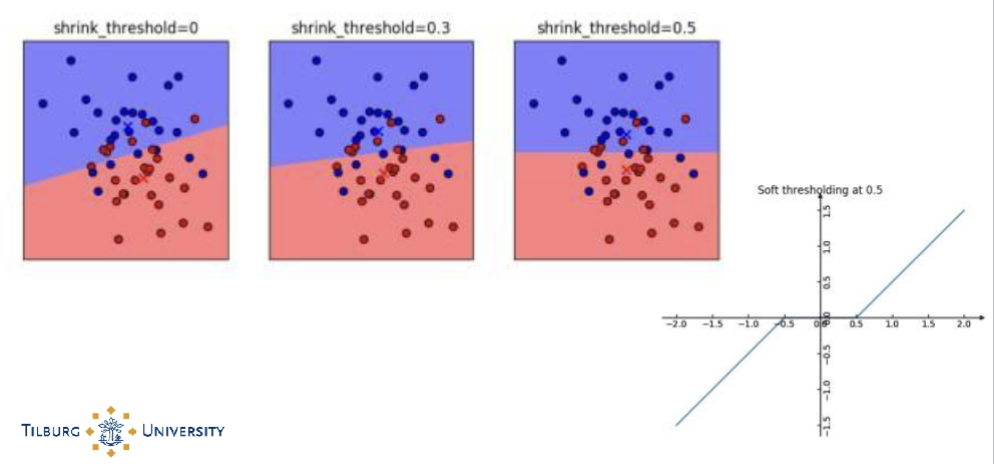
What is the nearest shrunken centroid?
Nearest centroid classification:
Takes a new sample, and compares it to each of these class centroids. The class whose centroid it is closest to, in squared distance, is the predicted class for that new sample.
Nearest shrunken centroid classification:
"shrinks" each of the class centroids toward the overall centroid for all classes by an amount we call the threshold. This shrinkage consists of moving the centroid towards zero by threshold, setting it equal to zero if it hits zero. For example if threshold was 2.0, a centroid of 3.2 would be shrunk to 1.2, a centroid of -3.4 would be shrunk to -1.4, and a centroid of 1.2 would be shrunk to zero.
After shrinking the centroids, the new sample is classified by the usual nearest centroid rule, but using the shrunken class centroids
-increasing threshold = moving closer to the center
-useful when you have a huge number of features
-helps to eliminate the features, unimportant ones
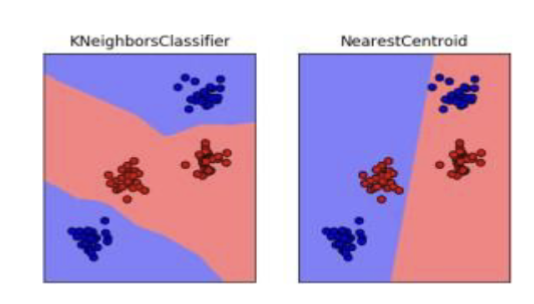
How is nearest centroid problematic? kNN vs nearest centroid
nearest centroid would misclassify data points
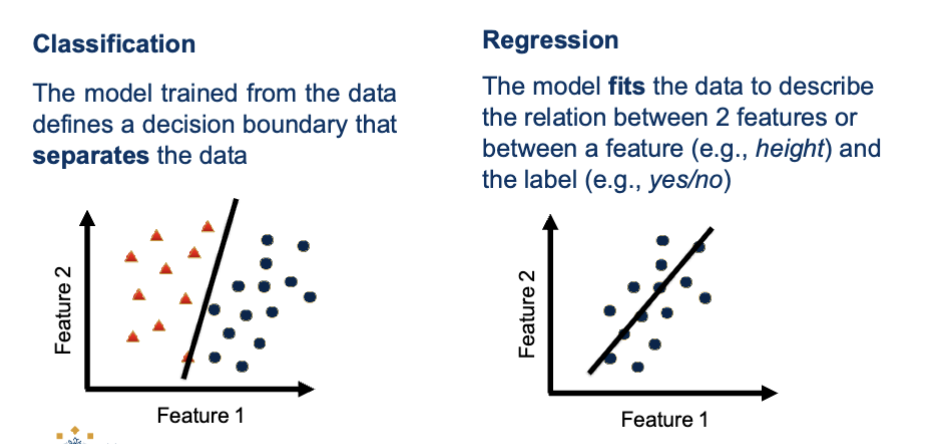
Describe classification vs regression
Classification: The model trained from the data defines a decision boundary that separates the data
Regression: The model fits the data to describe the relation between 2 features or between a feature (ex. height) and the label (ex. yes/no)
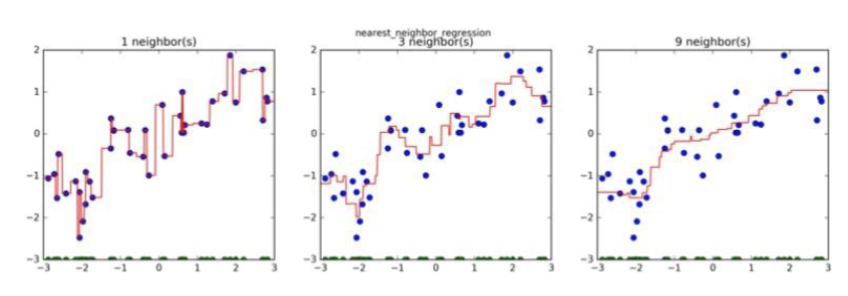
What is k-NN regression?
k-NN classification combines the discrete predictions of k-neighbours
k-NN regression combines continuous predictions
k-NN regression fits the best line between the neighbors
in the diagram you use weights, 2 versions of the same regression task, top uniform, bottom distance
What are 3 k-NN advantages?
The cost of the learning process is zero
No assumptions about the characteristics of the concepts to learn have to be done
Complex concepts can be learned by local approximation using simple procedures
Describe kNN for missing values imputation
What are 3 k-NN disadvantages?
The model can not be interpreted (there is no description of the learned concepts)
It is computationally expensive to find the k nearest neighbours when the dataset is very large
Performance depends on the number of dimensions that we have (curse of dimensionality)
What is the curse of dimensionality and overfitting?
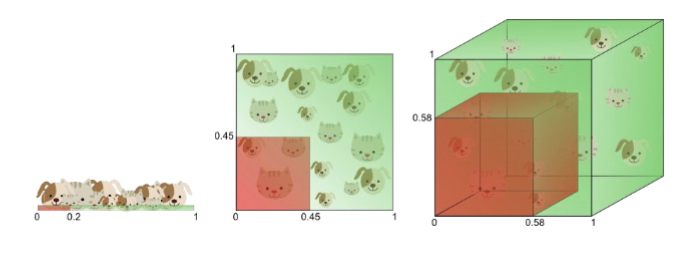
Slide 1:
More information is needed for classification, therefore we add a second feature
Feature 2: average amount of green color in image
Slide 2:
Even more information is needed for classification, therefore we add a third feature
Feature 3: average amount of blue color in image
Slide 3:
In three dimensions (= three features), perfect separation of CATS and DOGS is possible with a decision boundary (plane)
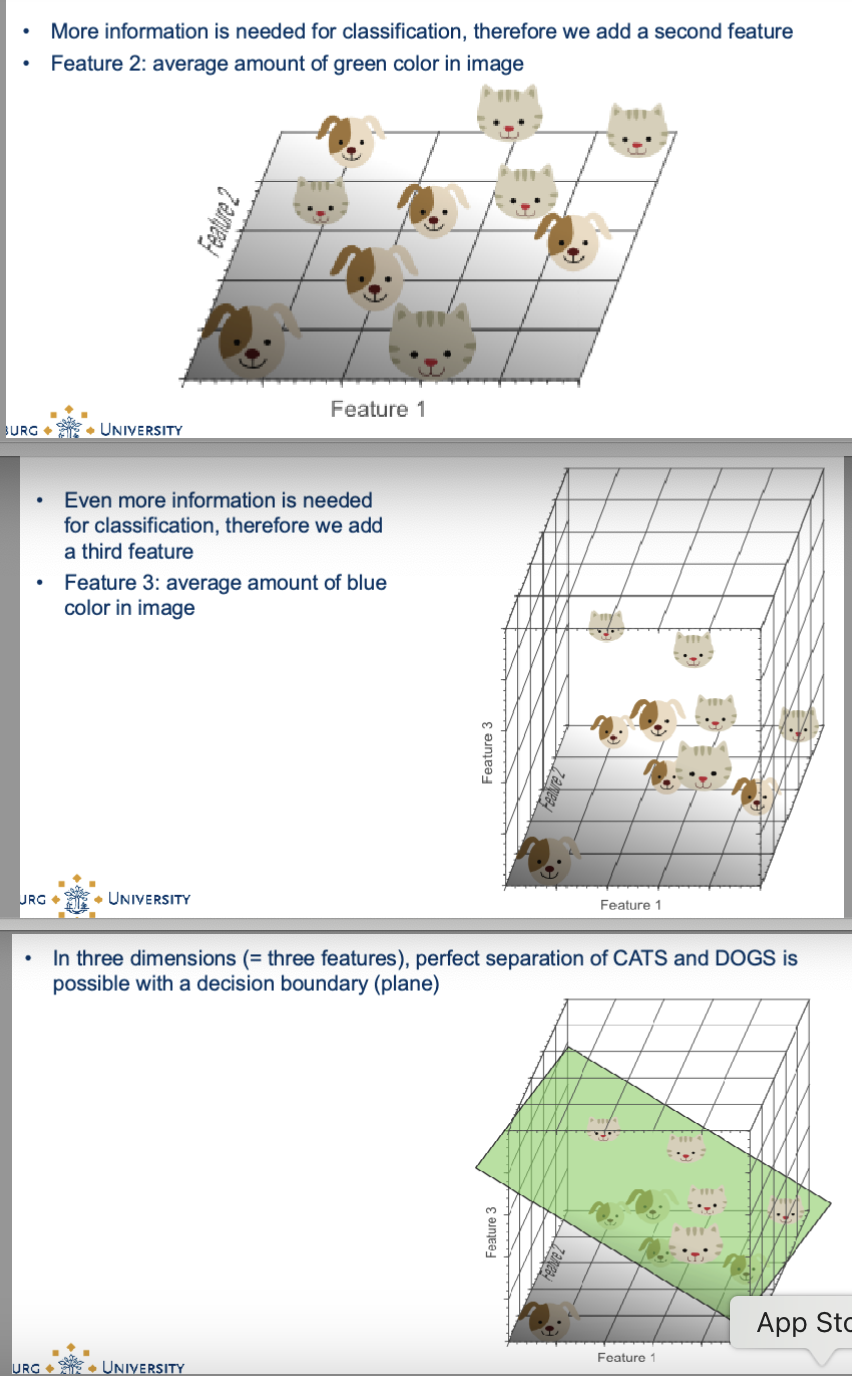
In the dog-cat example, Does adding features improve classification?
This example suggests that by adding (informative) features, classification is improved. This is often the case, but... Adding new features increases the volume of feature space exponentially
For instance: 1 feature has 10 different values
1 feature: 10 possible feature values
2 features: 100 possible feature values
3 features: 1000 possible feature values
as more features are added, data becomes sparse, distances lose meaning, and algorithms that depend on “closeness” struggle.
Examples? k-nn
Solution: models less sensitive to raw distances (ex. trees, boosted methods
Or dimensionality reduction, feature selection