P3 - REVIEWER - MANAGERIAL ECONOMICS
1/42
Earn XP
Description and Tags
P3 Module 1 - Lesson 1
Name | Mastery | Learn | Test | Matching | Spaced | Call with Kai |
|---|
No analytics yet
Send a link to your students to track their progress
43 Terms
Supply
- refers to the willingness and ability of sellers to produce and offer different quantities of a good at different prices during a specific period.
For example, if a small-scale "taho" vendor notices people are willing to pay P25 for a cup of taho in a busy tourist spot instead of the usual P10 in a residential area, they will be motivated to prepare and sell more cups to that location.
Remember this important point about supply: Unless both willingness and ability to sell are present, there is no supply.
The Law of Supply
Will sellers produce and offer more units of a good at higher prices than at lower prices?
For example, will a clothing manufacturer produce more shirts if they can sell each for ₱1,500 than if they can only sell each for ₱300?
The Law of Supply
- states that as the price of a good rises, the quantity supplied of the good rises, and as the price of a good falls, the quantity supplied of the good falls, ceteris paribus.
- simply put, the price of a good and the quantity supplied of the good are directly related, ceteris paribus.
Supply: Formula
𝑃 ↑ 𝑄𝑆 ↑
𝑃 ↓ 𝑄𝑆 ↓, ceteris paribus,
where 𝑃 = price and 𝑄𝑠 = quantity supplied.
The Law of Supply
Other Ways to Represent the Law of Supply
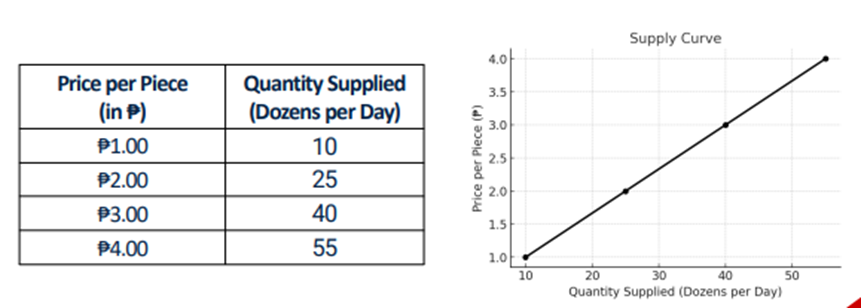
Supply schedule - a table that shows the relationship between the price of a product and the quantity a seller is willing and able to supply.
Supply Curve - a (upward-sloping) supply curve is the graphical representation of the direct relationship between the price of a product and the quantity a seller is willing and able to supply.
Supply schedule -
a table that shows the relationship between the price of a product and the quantity a seller is willing and able to supply.
Supply Curve -
a (upward-sloping) supply curve is the graphical representation of the direct relationship between the price of a product and the quantity a seller is willing and able to supply.
The Law of Supply
Other Ways to Represent the Law of Supply
The Law of Supply
The law of supply usually works for most goods. But it doesn’t apply when more goods can’t be produced right away, or when some goods can’t be produced at all.
The law of supply usually works for most goods. But it doesn’t apply when more goods can’t be produced right away, or when some goods can’t be produced at all.
The Law of Supply
Why Most Supply Curves Are Upward Sloping?
Law of diminishing marginal returns, higher prices encourage producers to supply more, as they can earn greater profits.
For example, if the price of a product rises while production costs remain the same, producers gain more profit per unit and are motivated to increase supply.
However, producing more goods costs more; as production increases, the cost of making each extra unit also goes up. The upward-sloping supply curve shows this link between higher prices, higher costs, and more supply.
The Law of Supply
What Factors Cause the Supply Curve to Shift?
✓ the prices of relevant resources,
✓ technology,
✓ the prices of related goods,
✓ the number of sellers,
✓ expectations of future price,
✓ taxes and subsidies, and
✓ government restrictions.
✓ Prices of relevant resources
Resources are used to produce goods. If the cost of a resource falls (e.g., cheaper wood for doors), production becomes less expensive. Producers earn more profit and supply increases. If resource costs rise, supply decreases.
✓ Technology
It means the knowledge and skills used in production. When technology improves, producers can make more with the same resources at lower costs. This increases profits and supply.
✓ Prices of Other Goods
If the price of another good rises, producers may switch to making that good instead. For example, when corn becomes more profitable, farmers shift resources from wheat to corn, reducing wheat supply and increasing corn supply.
✓ Number of Sellers
When more sellers enter the market, supply increases. If sellers leave the market, supply decreases.
✓ Expectations of Future Price
If producers expect prices to rise in the future, they may hold back supply now to sell later. If they expect prices to fall, they may increase supply now.
✓ Taxes and Subsidies
Taxes raise production costs and reduce supply. Subsidies lower costs and increase supply.
✓ Government Restrictions
Government rules can also affect supply. For example, import quotas reduce supply by limiting foreign goods; while removing quotas increases supply and licenses restrict supply by requiring sellers to meet certain standards before entering the market.
Demand Price Sensitivity
- also known as price elasticity of demand
Demand Price Sensitivitiy
- a measure
of how much the quantity of a product people are willing to buy changes when its price changes.
Demand Price Sensitivitiy
-a fundamental concept
n economics that helps businesses predict consumer behavior and set effective prices.
Demand Price Sensitivity
Price sensitivity is about the relationship between price and consumer demand.
✓ When a product is price-sensitive, a small change in its price can lead to a large change in the quantity demanded. This is also called elastic demand.
✓ When a product is price-insensitive, a change in its price has little to no effect on the quantity demanded. This is known as inelastic demand.
elastic demand.
✓ When a product is price-sensitive, a small change in its price can lead to a large change in the quantity demanded. This is also called
inelastic demand.
✓ When a product is price-insensitive, a change in its price has little to no effect on the quantity demanded. This is known as
Demand Price Sensitivity
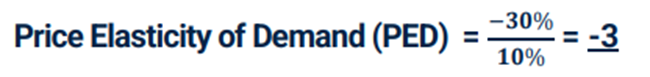
To calculate price sensitivity, you use the price elasticity of demand formula:
The result is usually a negative number since price and quantity demanded
move in opposite directions (as price increases, demand decreases).
However, for simplicity, economists often use the absolute value of the result.

Demand Price Sensitivity
For example, a hotel increases its room price from ₱1,000 to ₱1,100 (a +10% change in price). As a result, bookings fall from 100 rooms to 70 rooms (a –30% change in Qd).
▪ If price increases, the % change in price is
positive.
negative.
▪ If quantity demanded decreases, the % change in Qd is
Demand Price Sensitivity
Price Elasticity of Demand (PED) Classifications
▪ If the result is greater than 1, demand is elastic (highly price-sensitive). A 1% price change leads to a greater than 1% change in demand.
▪ If the result is less than 1, demand is inelastic (not very price-sensitive). A 1% price change leads to a less than 1% change in demand.
▪ If the result is equal to 1, demand is unit elastic, meaning the percentage change in price is equal to the percentage change in demand.
elastic
▪ If the result is greater than 1, demand is ——— (highly price-sensitive). A 1% price change leads to a greater than 1% change in demand.
inelastic
▪ If the result is less than 1, demand is ———-(not very price-sensitive). A 1% price change leads to a less than 1% change in demand.
unit elastic,
▪ If the result is equal to 1, demand is ———- meaning the percentage change in price is equal to the percentage change in demand.
Demand Price Sensitivity
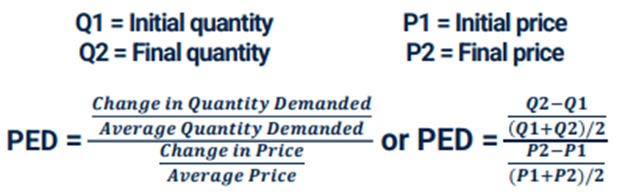
Calculating PED: The Midpoint Formula
- When calculating elasticity over a range of prices, it's best to use the midpoint formula.
- This formula gives a more accurate value by using the average of the starting and ending points.
Demand Price Sensitivity
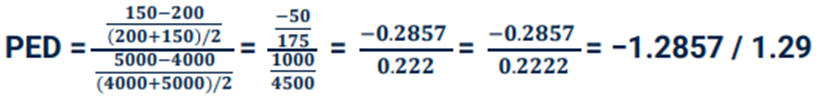
For example, a resort raises its room rate from ₱4,000 (P1) to ₱5,000 (P2). At ₱4,000, they sold 200 rooms (Q1). At ₱5,000, they sold 150 rooms (Q2).
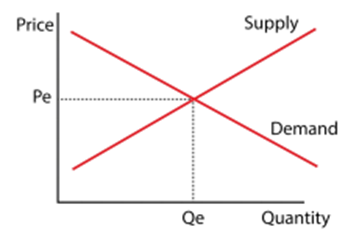
Market Equilibrium
- the state where the quantity of a good that consumers are willing and able to buy is equal to the quantity that producers are willing and able to sell.
At this point, there is no surplus or shortage in the market.
Market Equilibrium
▪ Equilibrium Price (Pe): This is the price where the supply curve and the demand curve intersect. At this price, the quantity supplied equals the quantity demanded.
It's often called the "market-clearing price" because it clears the market of any excess supply or demand.
▪ Equilibrium Quantity (Qe): This is the quantity of the good that is both bought and sold at the equilibrium price.
▪ Equilibrium Price (Pe):
This is the price where the supply curve and the demand curve intersect. At this price, the quantity supplied equals the quantity demanded.
market-clearing price
It's often called the " " because it clears the market of any excess supply or demand.
▪ Equilibrium Quantity (Qe):
This is the quantity of the good that is both bought and sold at the equilibrium price.
Market Disequilibrium
When the market is not at equilibrium, it is in a state of disequilibrium, which leads to either a surplus or a shortage.
Surplus (Excess Supply):
✓ This occurs when the market price is above the equilibrium price.
✓ At this higher price, the quantity supplied is greater than the quantity demanded.
✓ Producers have more goods than consumers are willing to buy, which puts downward pressure on the price.
✓ To sell their excess inventory, producers will eventually lower the price, moving the market back toward equilibrium.
surplus or a shortage.
When the market is not at equilibrium, it is in a state of disequilibrium, which leads to either a
Surplus (Excess Supply):
✓ This occurs when the market price is above the equilibrium price.
✓ At this higher price, the quantity supplied is greater than the quantity demanded.
✓ Producers have more goods than consumers are willing to buy, which puts downward pressure on the price.
✓ To sell their excess inventory, producers will eventually lower the price, moving the market back toward equilibrium.
Shortage (Excess Demand):
✓ This occurs when the market price is below the equilibrium price.
✓ At this lower price, the quantity demanded is greater than the quantity supplied.
✓ Consumers want to buy more of the good than producers are willing to sell.
✓ This shortage puts upward pressure on the price as buyers compete for the limited supply, and producers realize they can charge more.
✓ The rising price will move the market back toward equilibrium.