Diverse Places
1/41
There's no tags or description
Looks like no tags are added yet.
Name | Mastery | Learn | Test | Matching | Spaced | Call with Kai |
|---|
No analytics yet
Send a link to your students to track their progress
42 Terms
KEY DEFINITIONS:
Birth Rate
Mortality/Death Rate
General fertility rate
total fertility rate
immigration
emigration
net migration
natural change
Demographic
Place
Population density
meaning
Ethnicity
population distribution
cultural diversity
the number of live births per 1,000 people, per year
the number of deaths per 1,000 people, per year
the number of live births per 1,000 women between the ages of 15 and 44
average number of children born to a woman during her lifetime
people coming into the country to stay
people moving out of the country to live elsewhere
the difference between immigration and emigration
the outcome of the balance between births and deaths. Natural increase occurs when births exceed deaths and natural decrease occurs when deaths exceed births.
Of or relating to some aspect of a population, for example its size, rate of change, density and composition. (age, ethnicity)
an area/location that doesn’t necessarily have definite boundaries. It is dynamic and shaped by internal and external connections. A place contains meaning at an individual, social or cultural level.
The number of people per unit area (usually per km2); i.e, the total population of a given area (country, region or city) divided by its area.
relates to how people percieve and engage with and form attachments to particular places
the quality or fact of belonging to a population group or subgroup made up of people who share a common cultural background or descent.
Population distribution is a measure of how spread out a population is in any given area. The simplest way to measure population distribution is to calculate the percentage of a population over a specific geographic area.
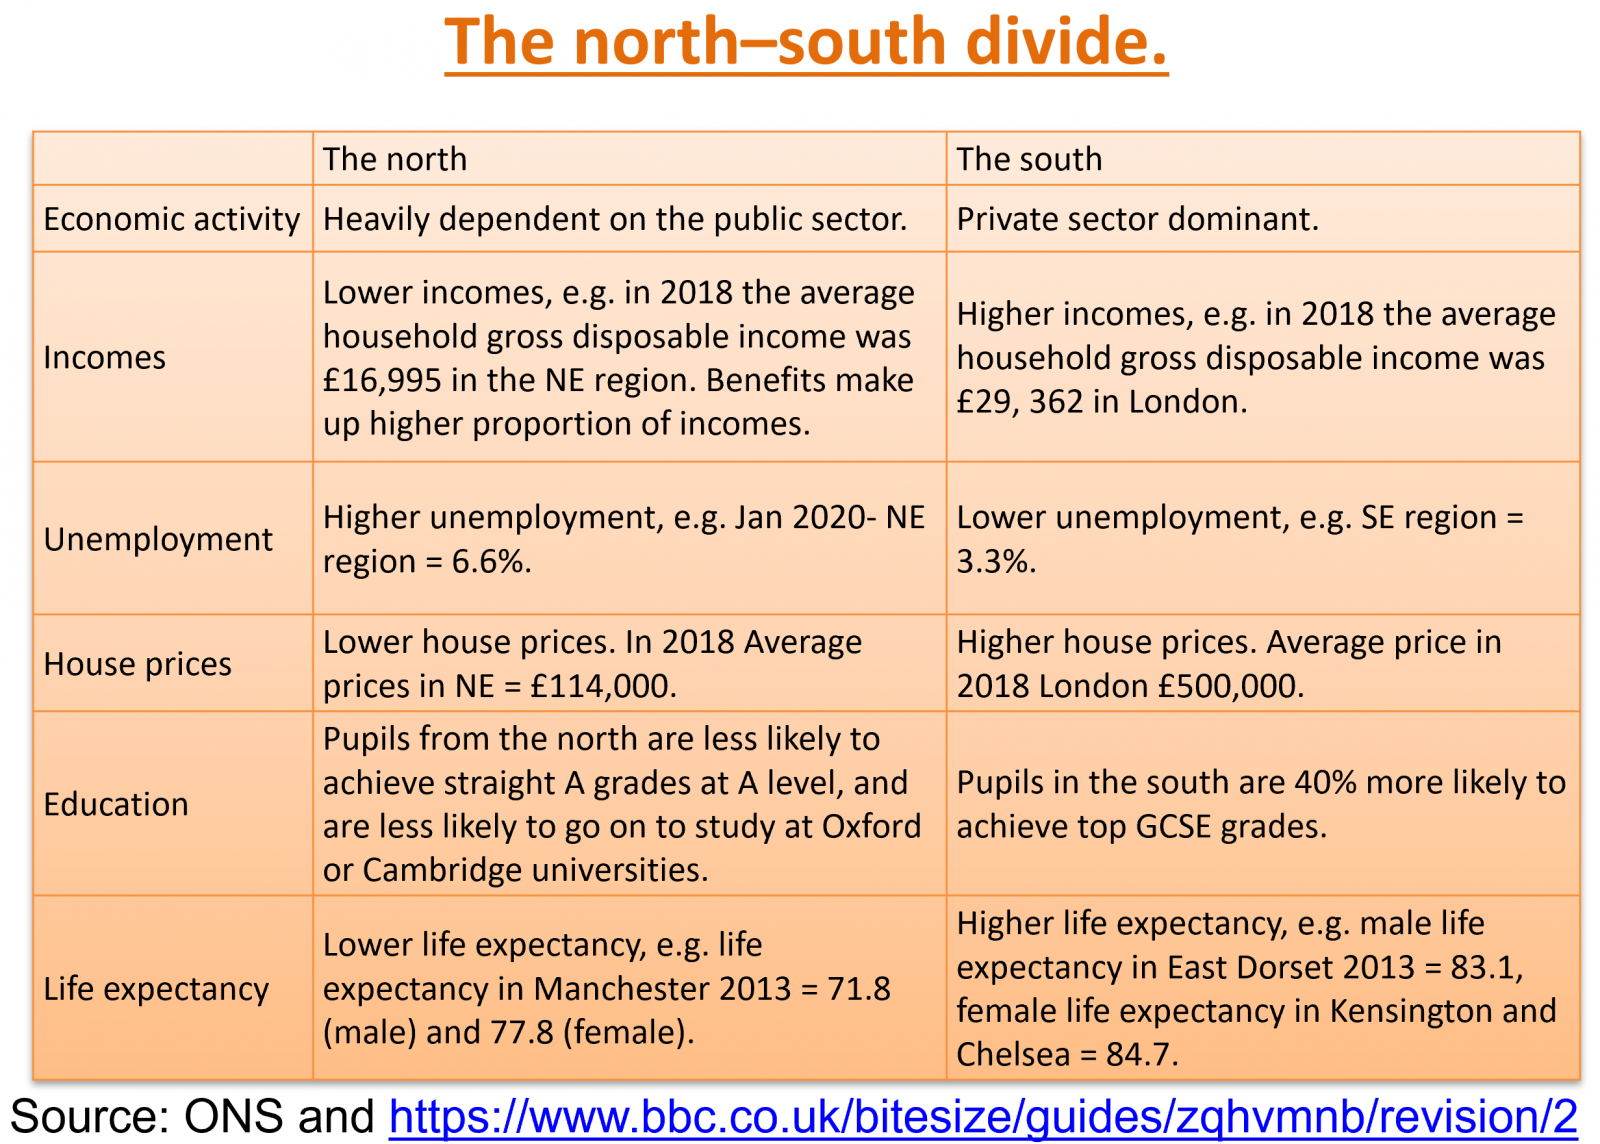
The population of the UK has grown unevenly in the last 50 years, with some regions growing rapidly ( London and the south-east) whilst others have grown more slowly ( the north-east of England).
The UK’s population has gradually increased from 1801 to 2011, it has increased from 9 million to 55 million. As of 2023 up to 68 million.
The population was lower in 1951 due to the war. Uneven population increase has led to challenges with overcrowding, education, housing and healthcare.
Population growth has been concentrated in England, especially in the southeast.
In comparison, much of the North/north-east of England experienced relatively little growth- some areas experiencing a sustained population decline.
These changes are due to:
The rising economic prosperity of London and the South East as a global centre of finance and business, as well as a hub of modern service industries. The physical location of the southeast makes it easier to access from continental Europe via coastal ports like Dover. Transport links are stronger e.g. HS1,2 and Westminster- Parliament is located in London (the quinary sector). Businesses and people are attracted to SE UK because jobs are likely to pay higher if they are doing well and there are more job opportunties. 794 businesses per 10,000 adults in the North in comparison to 1058 in the South.
Also, a larger population multiplier effect and therefore increased investment- so it is more attractive to live there. Average housing prices are 3.5x what they are in the North- attractive because they can increase in value and ultimately act as more of an asset than a hindrance.
There are many nearby commuter towns and transport links for travelling to London
There is a high level of internal migration from north to south with people searching for a job in the tertiary sector. Most internal migration to the North is students or retirees (some also retire to the further South) This causes a Spiral of Decline as fewer people in NE> loss of services> loss of investment- e.g. Transport in the North spends a tenth of the National average
84% of the population live in England, which has low-lying hospitable land.
Declining populations at Scottish coast and Cumbria from lack of employment opportunities and counter-urbanisation from deindustrialised cities like Bradford
There is a very slow population growth in the North East and Wales 3.2%
The decline of the manufacturing industry in its former strongholds in the Midlands and the North of England. The collapse of traditional heavy industries in the Northeast, such as coal mining, iron and steel making, shipbuilding and chemicals, in the face of foreign competition -the region is still slowly recovering.
The North is more dependent on public sector jobs 18.9% compared to everywhere else 15.7%- less desirable place as there are fewer job opportunities.
The redistribution of population resulting from this spatial pattern of growth and decline is often referred to as the North-South drift or divide.
The North Sea oil and Gas Industry expansion did change demographic fortunes of the north of Scotland in the 70s.
Population of mid-Wales has largely been revived.
Remember that a high percentage change figure can be produced by a very modest increase in a small existing population.
The Northern Power house – “One Agenda, One Economy, One North”
For many decades now governments have tried to iron out the differences between the north and the south. The latest idea (created during the parliaments of 2010 to 2015 and 2015+) is to create a “Northern Powerhouse” of well linked northern cities to match, rival and compete with the economic muscle of London.
The proposal for a Northern Powerhouse is based around linking the regional “core” cities of Liverpool, Leeds, Manchester, Sheffield, Hull and Newcastle. Other regional centres would be integrated such as Cumbria, Lancashire, Cheshire, North Yorkshire and the Tees Valley.
Linking these urban areas should help industries perform better and help to even out the UK’s economy
The Demographic Transition model
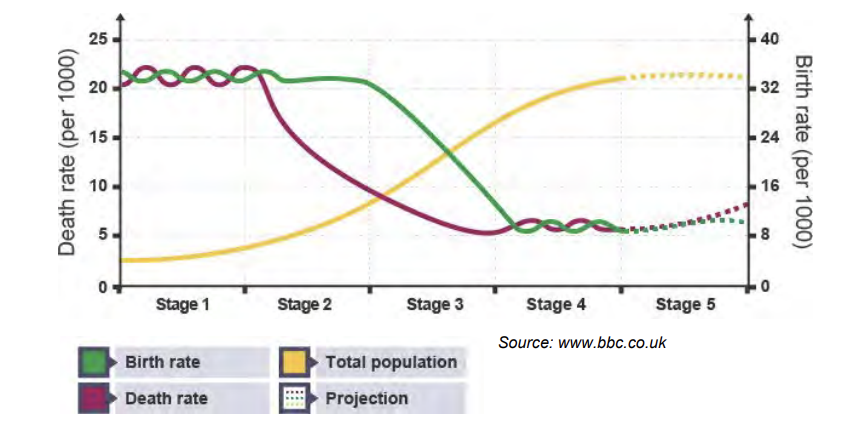
1. Stage 1 - High birth and death rates- meaning the total population tends to be quite low and there isn’t much change in population size. The country tends to be poorly developed, so has little wealth to spend on services such as health education. Most employment is in primary industries (farming, mining, etc) which can be intensive labour work and low income. Birth rates are high due to factors such as a lack of access to contraception, religious beliefs, lack of education etc. Death rates are high for various reasons including lack of safe drinking water and sanitation, malnutrition, lack of access to healthcare.
2. Stage 2 - Death rate begins to decrease while birth rate stays high this means that the population size starts to increase. This is because the country often becomes more developed, meaning it has more money spent on hospitals and doctors, which has a huge effect on reducing the death rate. The population will increase as a result of fewer people dying. Epidemics and disease are better understood, with households developing basic knowledge of sanitation and transmission of diseases. Improvements in farming and mining practices - use of machinery, for example - will reduce injuries and fatalities in the workplace. As development increases, secondary industry (manufacturing and production) will also develop; secondary industry can offer higher-paid, more secure jobs (workers are paid for how many hours they work rather than the crops they produce, and jobs aren’t seasonal). This means income is more consistent and often standards of living improve and malnutrition decreases.
3. Stage 3 - Death rate continues to decrease while birth rates decrease which means the population expands more rapidly. Often women have more rights and therefore have more education and improved access to contraception and family-planning advice. A focus on career may mean women start having children later and they also have less children. A move away from the primary industry means most families don’t need so many children to work on the land.
4. Stage 4 - Birth rate and death rates are much lower and have plateaued. Despite this, population continues to increase for MEDCs as migrants from other countries are attracted to employment opportunities and the better quality of life provided. If controlled, migration can fill skills gaps and keep services and industries growing. (The UK used international migrants to fill a skills gap in the NHS in 2000, so medical services could be maintained for the growing population)
The Demographic Transition Model suggests that there is a correlation between the development of a country and its birth and death rates and any changes to these rates are gradual. There are a few exceptions, such as the UAE, whose sudden population growth is predominantly due to economic migration.
Also, the model doesn’t consider countries whose development worsens; countries devastated by conflict or natural disaster.
For example: ● Syria’s development has significantly declined due to the conflict there. There has been significant outward migration to avoid bombing, infrastructure and services have collapsed as a result, and death rates are significantly larger than the model suggests for LEDC countries.
● Haiti was devastated by an earthquake in 2010. Most countries will experience an increased death rate following a natural hazard. However, Haiti hasn’t recovered and following the 2010 Earthquake has experienced:
➔ Cholera Epidemics, claiming 9200 lives by 2016, as the Artibonite River became contaminated with sewage.
➔ Annual hurricane seasons causing storm surges, severe winds and threatening temporary shelters built for the displaced.
➔ Two years after the earthquake, only half the rubble created during the earthquake had been cleared.
The main drivers of population change in the UK since 1992:
Net increase migration change
- 2004 - more EU A8 countries (eg Poland joined)
- Migration declined in 2008 during the financial crisis
- As migration increases, births increase as well
[UK net migration in 2022 revised up to record 745,000]
Net migration is driven by non EU Nationals:
- More people coming back due to Covid and not wanting to be away from family
- People leave the UK from the EU (doctors, nurses, EU)
- Lots of international students coming in as they pay lots of school fees which subsidised fees of locals
UK population growth
• Post world war 2 baby boom would be around 70 now
• Swinging 60s - less strict or traditional attitude towards things such as the contraception
• Mid 1970s (73-75) recession so less babies being born
• In migration of 20-30 yrs old after 2004 EU enlargement A8, more people of a younger generation migrating
In 2014 -27% of all births were to non UK born mothers
increase in population in England in 10 years (2011 census)
SE: 7.9%
London: 14.0% London’s high population growth rate resulted from its expanding knowledge economy, which has lead to an influx of highly qualified workers and their families.
London's booming economy has led to rapid internal migration (within the UK), particularly of young graduates, and international migration (from overseas).
NE: 3.2%
Overall: 7.88%
average growth of economy 1997-2012 for the North is 3.8% and rest of England is 4.3%
Population structure and density varies according to placement in the rural-urban continuum and, therefore accessibility, physical factors, historical development and the role of planning.
Population structure is the composition of the population of a particular country, region or area. Significant aspects of this composition are how the population is made up in terms of age, life expectancy, family, size, marital status, and ethnicity.
There are considerable variations in density within urban areas. There does seem to be a gradient of declining population densities with increasing distance from the town or city centre- but this is oversimplified!
England currently has over ¾ of the population of the Uk on just over half of the total area.
There is a high average density of 406.5 persons per km.
Scotland population- 8.4%- spread over 1/3 of Uk’s total area - density is 67.3 persons per km
Countries of Uk do not have populations strictly proportional to their shares of the total land area- so population density varies greatly
Choropleth maps are often used to represent different degrees of population density via shading.
In England, there are parts of the country where densities are below that figure, namely in the South West, over much of East Anglia and in the North.
- These areas of relatively low density help to define a broad belt of above-average density stretching from the South East to the North West and which includes the leading cities of London, Birmingham, Manchester and Liverpool.
- In Wales, the highest population densities are to be found in the South. Much of the rest of the country is sparsely populated except for an area in North Wales.
- Much of Scotland's population is concentrated in the Central Lowlands, particularly in the cities of Edinburgh and Glasgow and, to a lesser degree, along part of the east coast. Large areas of the country — the Highlands, Western Isles and the Southern Uplands — have a population density of less than 25 persons per km2 (one-tenth of the UK average).
- In Northern Ireland, there appears to be a rather more even spread of population, but with higher densities around the city of Belfast.
East Devon- • Lower population density
• More older people as it is a popular area to retire to
• Less public transport (1 bus every half hour)- connected to closest city Exeter. Jobs based in tourism, farming etc
Tower Hamlets - Has UK's lowest proportion of over 65's
• Better public transport connections- connected to all parts of the UK e.g. tube and available for longer e.g. 24hrs on a weekend.
• Greater ethnic diversity
• More expensive to live
• Expanding knowledge economy (finance, law, advertising, media etc)
Greater job vacancies
The Burgess Model
CBD = low density due to commercial activity & public buildings.
• Inner city = High density terraced housing. Some replaced by re-developed social (but still high density) housing.
• Suburbs = low density interwar housing (1918-1939) - mainly semi detached.
• Urban rural fringe = higher density? As greenbelt is established at the edge of a city (to stop urban sprawl) housing developments are forced to become high density. Areas of greenfield are becoming in-filled as the government looks for more areas to build and house builders look to maximise profit by building in areas of high demand.
The Rural- urban continuum is the unbroken transition from sparsely populated or unpopulated, remote rural places to densely populated, intensively used urban places (towns and city centres)
Cloke 1979
geographical model shows a pattern of how settlements change but not all areas fit the model
Remote rural, accessible rural, urban
Factors affecting urban population density:
Physical environment
Fairly flat areas lend themselves to development (flood plains and steep slopes are expensive to build on) - historically, spread of urban areas, tended to finger outwards along low lying corridors
Socio-economic status
More wealthy members of society will live in nicer and more expensive housing - typically areas of low population density - also will wish to be far away from various forms of pollution - therefore richer people tend to live west of city, as the wind will blow it the other way
Dwelling type and Household
dwelling unit impacts population density, e.g. high incidence of flats leads to high population density - household size will also have an impact (e.g. multiple generations together)
functions
distribution of non-residential activities has direct and indirect impacts on population density - it will be directly lowered when housing is intermixed with non-residential activities - location of manufacturing can have a negative impact on the quality of life of local residents, and therefore is an indirect factor - but these areas are likely to be occupied by high density, cheap housing
role of planning
Impacted by green belt, but planners also control the density of all new residential development - planning consent will stipulate how many units should be built per hectare
Government policy
At the end of WW2 there was an influx of Caribbean economic migrants which came to Brixton and Notting Hill. The British Nationality Act allowed everyone from the old colonies to live in the UK.
Social Clustering
safety in numbers, shops, cost of housing
The Office for National Statistics (ONS) projects the population will increase by 6.6 million people (9.9%) between 2021 and 2036.
• This includes a net migration of 6.1 million people and about 500,000 more births than deaths.
• By 2036, the size of the UK population aged 85 years and over is projected to increase from 1.6 million (2.5% of the total population) to 2.6 million (3.5%).
The various characteristics of a population that come under the heading of population structure also change and vary in the same two dimensions of time and space.
Age and gender are particularly significant
Population pyramids
The detailed shape of a population pyramid can tell us much about what has happened to the population over the last 75 or more years. It can also provide some pointers about how the population is likely to change in the future.
can often show how a nation or country has moved through the demographic transition
e.g. UK- 1800s, low life expectancy - 40 years due to a small percentage of elderly across the whole population
bulge in 50s-40s- baby boom of the 1950s!
Demographic transition- a model representing changing rates of fertility and mortality over time, their changing balances and their net effect on rates of population growth.
Limitations:
They overlook gender distribution as a decisive factor influencing population growth trends. They neglect migration rates affecting a country's demographic dynamics. They fail to depict age distribution accurately due to their graphical nature.
However, there are limitations to a population pyramid where you’ll need additional information to properly assess and analyse the causes and effects of a specific population.
For example, you’re trying to understand why the upper half of the pyramid shows rapidly declining numbers. In this case, there are multiple possible causes you might not be able to figure out just by looking at the pyramid. High mortality or migration rates are both possible reasons, and you’ll need more data to conclude which one justifies the trend
only used to show population structure
- figures are age-cohorts so some detail is lost in the data
Population structure and dynamics are a result of differences in fertility and mortality rates as well as international and internal migration.
Birth rates in the UK have continued to decrease due to:
The use of free contraception + more widespread sex education
Religion- Secularisation- so less pressure to have children, get married later and use contraception
Increasing financial cost- some families choose to have fewer children
Government policy- maternity/paternity leave.
Advancement of women- wanting to pursue careers so postpone having children.
Death rates have decreased due to medicine, immunisation to disease and clean water/sanitation: 96% of UK households are connected to the main sewage system and 100% have access to clean water, hence reducing the risk of water-borne diseases and diarrhoea
The Death rate of Western countries is limited by their lifestyle choices- reduce average life expectancy
Smoking and alcohol consumption and Unbalanced diets.
There has been a large increase in inward international migration to the UK since WWII:
Political alliances, especially with Commonwealth countries.
Lower price of long-distance travel
War and conflict
Increased employment opportunities in foreign countries
1971- Immigration Act- introduced patrials- British birth of parents or grandparents grants you the right to live in the UK
Changes to the UK over time:
The Windrush's arrival has become symbolic of the generation of Commonwealth citizens who came to live in Britain between 1948 and 1971.
1960s
working-class new homes due to large-scale construction
social housing, but mainly tower blocks = increased crime rates and reduced quality of life
immigration from Pakistan and India
1950s- jet aircraft and containerisation accelerated the movement of people and goods in the 1960s
Commonwealth Act- 1962- Restricts the flow of Commonwealth migrants to those with skills, encouraging economic migration
1970s
decline in secondary industry in northern cities
an increase in unemployment + poor city living conditions encouraged migration away from major city hubs
Improving plane transportation rendered docks unnecessary- dereliction in London, Liverpool and Salford
Inward international migration from Vietnam, Bangladesh and Chile after military coup
1980s
economic recession continues to cause unemployment + deindustrialisation in many towns and cities- discourages international migrants
gov offer tax incentives and SEZs to try and encourage FDI and the establishment of offices or manufacturing within the UK
first basic internet develops- 1984- online banking- capital and financial transactions can transfer around the world quickly
immigration from China, Sri Lanka, Sudan, Somalia and Australia
1990s
growth mainly due to net migration
conflict in The Congo, Balkans, Yemen and Kosovo encourages international migration to the UK + collapse of soviet union
1994- first smartphone
NHS begin recruiting overseas, trying to use migrants to fill skill gaps
2000s
Race Relations Amendment Act- aimed to reduce racial tensions and reduce discrimination by the Police and Government
Suburbanisation accelerates, creating new towns for highly-paid migrants to move into- offering a more rural lifestyle but with an urban job
EU Freedom of movement- reduced limitations
increase in the creation of religious primary and secondary schools- Jewish and Muslim
Development of social media- more global business and personal connections
Expansion of the EU- previously Soviet states- increased number of migrants
2010s
London’s reputation continues to attract new migrants, acts as a multi-cultural city- shown through the Olympic Games- election of Sadiq Khan and more ethnic enclaves and clusters forming
conflict in Syria- influx of asylum seekers
BREXIT- uncertainty in population patterns, closure of some TNCS, outflow of some British wishing to live in Spain/France
A longer average life expectancy, caused largely by falling mortality rates amongst those aged over 65, means that the UK’s population as a whole is now living longer. Falling mortality rates (e.g. due to increased cancer survival), and improved care of the elderly have resulted in increased life expectancy – especially in London, the North East, North West and Midlands. In London, male life expectancy rose from 73.3 in 1993 to 80.0 in 2013.
Accession 8 or A8 - In 2004 the government signed an agreement with other EU members to open its borders and allow free flows of people between countries, to live and work.
A key driver of population change from the 1990s onwards has been net international migration, with a peak in 2005 where net inward migration accounted for 69% of overall population growth.
London’s overall population is predicated to grow by 13% by 2022; the East of England's by 9%; and that of the South East by 8%(compared to England’s average population growth rate of 7%). Eight of the ten fastest growing areas in England are London boroughs (e.g. Tower Hamlets has the fastest growth rate of 22%).
The population of the North East is projected to grow the slowest by 2022 (by just 3%). The ten English areas with the slowest projected growth rates are all in the North East or North West regions. Some areas are even expected to decline - e.g. the population in Barrow-in-Furness is actually expected to fall by 2% by mid 2020s. Its naval ship yards no longer provide as much construction work as they did
Family size- number of children and their parents or guardians living together in one household. Family size in the UK currently stands at 1.7 children. In 1900 it was 4.6 children.
in a youthful population, the average family size is likely to be significantly larger than in an ageing population. Attitudes about the ideal family size vary enormously and are conditioned by cultural and socio-economic factors.
shrinking family size is partly the consequence of the changing status of women- 20th century- more women entered the workforce, enjoy choices- can have a career- can not marry and have children. Divorce is legally easier and so rates have increased. Contraception is a factor- those who do not want children can choose not to have them. Women are delaying starting families- often after a successful career- only really time for one or two children biologically.
Urban places show high population densities over large areas. In the UK, urban places have younger and more ethnically diverse populations, with a high proportion of young adults.
tend to show high fertility rates
higher rates of population growth
Mortality rates are conditioned by two opposing forces- the better availability of healthcare and then the stress and pace of urban living.
Rural places are more difficult to generalise because pop. density and structure vary considerably
depend on the nature of the physical environment
accessibility
historical factors to-do with function
lower population densities
raised densities do occur in compact traditional villages or commuter dormitories
tend to have older populations
lower fertility rates
higher mortality rates
Population change is often the outcome of internal migration
relatively untouched by international immigration- low ethnic diversity
Examples of movements:
• Rural-urban migration
• Retirement migration (eg Bournemouth)– Student migration
• Counter-urbanisation
• Suburbanisation (less crime, less air pollution, bigger housing)
• Re-urbanisation
• Regional North-South migration
- An extreme example of how migration can affect a population structure is found in the UAE. In Dubai, migrants comprise 66% of the city’s population, coming from 160 different countries.
- The vast majority are low paid, young, male construction workers from S.E Asia – India & Pakistan, and this is reflected in the shape of the UAE’s population pyramid.
- Net migration exceeded natural population change over the past 20 years in the UK.
- Natural change has also been positive, continually increasing since 2004 (mainly due to an increasing birth rate).
- Between 1991 – 2014, net migration contributed an extra 3.8 million people in the UK, making up 53% of the total population growth in the country.
Internal migration- the movement of population within a country, as distinct from the movement of people between countries (international migration).
Demographic variations are due to population structure, age groups, difference between the fertility and mortality rates of a population. Migration is, in many instances, an influential factor. The influx or exodus of migrants can have significant impacts on a population.
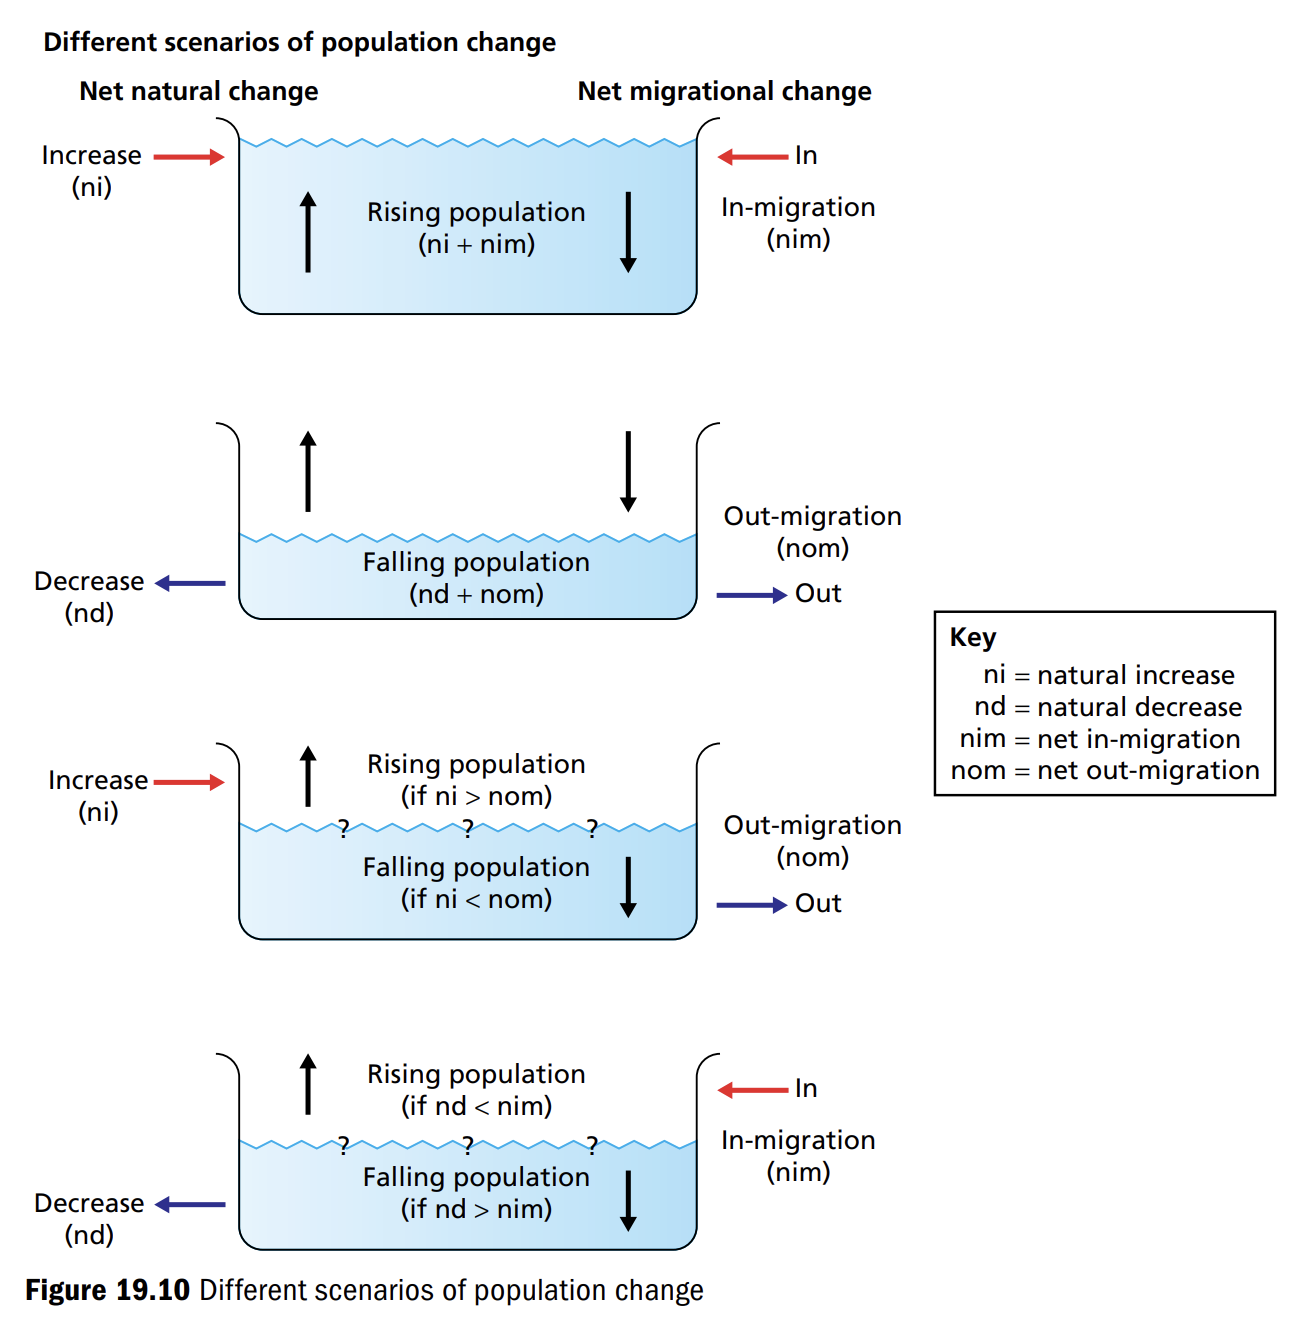
A systems view of population at a national level sees change as the outcome of two processes: natural change and net migration. The inputs are births and immigration, while the outputs are deaths and emigration.
Natural change is the outcome of the balance between birth rate and death rate.
Population change may be likened to changing levels in a water tank. The nature of the balance between natural change and net migration determines how the water level changes, that is both its direction and its speed or rate of change.
many immigrants are young adults so they contribute to the present rise in both birth rates and the rate of population growth.
There can be considerable variation in population characteristics (gender and ethnicity), both in and between settlements.
Characteristics- a feature or quality belonging typically to a person, place, or thing and serving to identify them.
the composition (make up) of the population of a particular country, region or area. This can include the different age groups, genders, life expectancy, family size and marital status of a given population.
Age and gender are particularly significant, and these are best shown on population pyramids.
Settlements differ in the detail of their population characteristics. There are significant variations in those same characteristics within larger settlements, namely towns and cities.
Cultural Diversity
Ethnicity- the cultural heritage shared by a group of people that sets them apart from others. The most common characteristics of ethnicity are racial ancestry, a sense of history, language, religion and forms of dress. With the exception of racial characteristics, ethnic differences are learnt, not inherited.
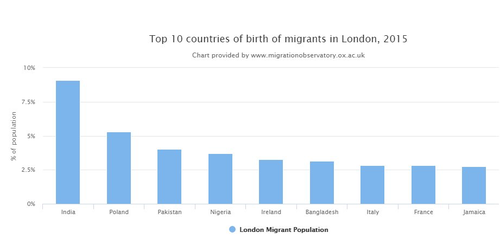
Brent is possibly one of the most multicultural parts of the UK- India, Africa, Caribbean roots
Different levels of cultural diversity in places can be explained by social clustering, accessibility to key cities, physical factors and government planning policy. (A: actions by governments may foster or suppress diversity)
Cultural characteristics are features of an area and people living there in terms of their beliefs, knowledge and habitats etc.
Culture includes knowledge, beliefs, art, morals, law, custom and any other capabilities and habits acquired by man as a member of society.
Affected by:
Income
- Ethnic background
- Fertility rate
- Mortality rate
- Recreation facilities
- Housing standards
- Education
- Migration
An ethnic enclave or localised urban community is when there is a concentration of a specific community of one ethnicity in one area e.g. Polish in Boston
social clustering- - A preference for living close to people you wish to be with
- Usually by choice rather than chance
- Eg Hindu community in Wembley as there are places of worship there
- Local specialist shops open selling preferred foodstuffs etc
- Community facilities offered protection against racism from the outside and helped maintain a shared identity
- There are economic benefits eg Bangladeshi restaurants in East London's Brick Lane
Acessibility to key cities-
- Many Pakistani migrants gained employment in the northern textile cities of Lancashire and West Yorkshire/ car manufacturing in West Midlands
Luton- airport jobs?
- Remote rural Britain offered few job opportunities
- Limited car ownership so distance and accessibility is important
- unlikely to arrive with a job so cities provide good access to where work is likely to be found. Cities can offer entrepreneurs a good threshold population. This is advantageous to the person wishing to set him/herself up in business.
Cost of Housing- Cost of housing. Housing in the inner cities is the cheapest to buy and there is a greater availability of cheap places for rent. This can lead to concentrations of ethnic minorities or similar socio-economic class. Many ethnic minority groups have an economic support network that encourages people to live close to one another.
Clustering is also a very good defensive measure especially if the host population is seen as unwelcoming and aggressive. Clustering can be a deliberate attempt to maintain culture and tradition.
On the other hand, high house prices can lead to clustering of higher socio-economic classes in some areas excluding many other social groups.
Physical factors
isolated and mountainous areas a bit of a deterrence and a nightmare to get to for some so less cultural diversity e.g. Scottish Highlands
Government planning
NHS- sponsoring job ads overseas, agreed immigration targets
Reduction on immigration controls affects cultural diversity- as does adding controls
Boston stats:
Boston is a small town in Southeast East Lincolnshire, located on the River Witham.
It is surrounded by agricultural land, significantly far away from larger towns and cities.
Area borough, 140 square miles (362 square km). Pop. (2001) town, 35,124; district, 55,750; (2011) town, 41,340; district, 64,637.
There is a large attitude of ‘us and them’ from the locals to the eastern European immigrants.
According to the 2011 Census, Boston is now home to a higher proportion of Eastern European immigrants than anywhere else in England and Wales: 10.6 per cent of the town’s population of 65,000 comes from one of the “new” EU countries such as Poland, Lithuania, Latvia or Romania. Around 13% of the town was born elsewhere in the EU.
Many of the newsagents, hairdressers, fast-food joints and other shops on West Street and the surrounding lanes are run, or staffed at least, by immigrants. Most of the customers appear to be fellow immigrants and there is frustration from some of the white local population at the amount of shops.
Boston clearly shows that higher levels of immigration do not lead to unemployment! Unemployment in the town is well below the national average - 4.4% of economically active people, as against 5.2% nationally.
Paul Gleeson, a Labour councillor in the borough, says it used to be Irish workers in previous centuries. More recently, men from local cities would arrive in white vans at 04:00, work through the morning and then disappear in the early afternoon.
In the ten years since 2004, the town’s migrant population grew by 460%. In the decade from 2001, the number of Polish residents recorded in Boston jumped from 40 to 3,000, and the number of Eastern Europeans went from less than 1,500 to more than 8,000.
The town also has a high number of Portuguese and Romanian workers who have come to the UK to pick up agricultural work and work with local packaging firms.
Other views are more positive, with people understanding that everyone is just here to work, especially filling up the 3 ds jobs that English locals are turning away from.
Before the East European influx, the town was already facing significant economic challenges. Many young people were leaving the area, the town was becoming older and poorer.
The arrival of keen, young workers helped some businesses to expand and the farmers' union has complained that local people are often reluctant even to apply for low-paid manual jobs.
There is also an issue with homelessness in the town. The homelessness charity centre is currently helping 57 homeless people, more than 80 per cent of whom are migrants. The high number of homeless and under-employed men drinking in the park is stoking tensions in the town. Race-related crimes in Lincolnshire jumped by 38 per cent Lin 2013, though police say this may be down to better reporting of incidents. There have also been protests against immigration to the town which has widened the divide between those living in Boston. Higher levels of immigration do not lead to unemployment! Unemployment in the town is well below the national average - 4.4% of economically active people, as against 5.2% nationally.
Between the last two censuses (held in 2011 and 2021), the population of Boston increased by 9.1%, from just over 64,600 in 2011 to around 70,500 in 2021.
The latest census data also show that the average (median) age remained 42 years in Boston between the last two censuses.
In Boston, the percentage of households in the social rented sector rose from 18.2% in 2011 to 19.5% in 2021. During the same period, the regional percentage fell from 15.8% to 14.9%.
Private renting in Boston increased from 15.7% to 20.3%, while the rate of home ownership decreased from 63.9% to 58.9%.
In Boston, the percentage who were employed rose from 56.8% in 2011 to 57.2% in 2021. During the same period, the regional percentage fell from 56.1% to 55.1%.
The percentage of people aged 16 years and over who were unemployed (excluding full-time students) in Boston fell from 3.7% to 2.5%, while the percentage of people aged 16 years and over who were retired (economically inactive) decreased from 25.2% to 23.7%.
In 2021, 12.9% of Boston residents aged 16 years and over and in employment said they worked over 49 hours per week. This figure decreased from 13.6% in 2011.
Boston saw England's joint second-largest percentage-point rise (alongside Leicester) in the proportion of people who did not identify with any national identity associated with the UK (from 14.0% in 2011 to 20.9% in 2021).
In the latest census, around 52,900 Boston residents said they were born in England. This represented 75.1% of the local population. The figure has decreased from just under 53,800 in 2011, which at the time represented 83.2% of Boston's population.
Lithuania was the next most represented, with around 4,000 Boston residents reporting this country of birth (5.6%). This figure was up from just under 1,900 in 2011, which at the time represented 2.9% of the population of Boston.
The number of Boston residents born in Poland rose from just under 3,000 in 2011 (4.6% of the local population) to around 3,800 in 2021 (5.4%).
In 2021, 1.2% of Boston residents identified their ethnic group within the "Other" category ("Arab" or "Any other ethnic group"), up from 0.3% in 2011.
St Botolph's Church, Boston Information about reopening was printed in many different languages
- 6 languages - English, Latvian, Lithuanian, Polish, Russian and Portuguese
"A lot of young English people do not seem to want to work on the land and I guess that means employers need to turn elsewhere."
Brent vs Bromley
- Population density: Brent is 3 times more populated than Bromley achieved by small housing units
- Rate of recent population change: rate of change in Brent was over 3 times that in Bromley
- Migration: brent shows an interesting contrast of a substantial inward international migration and string outward internal migration
- Brent has a high level of ethnicity as immigrant families are willing to live in high densities
- Brent has a younger population
- Higher level of educational attainment in Bromley
Fertility and mortality rates, as well as international and internal migration, are changing the cultural characteristics of places.
Cultural change -The modification of society through innovation, invention, discovery or contact with other societies
Top 10 countries of birth migrants in London, 2015
What major migrations have affected the culture of the UK?
- British nationality act 1948, British citizenship, anyone in a colony can come to the UK, leading to the Windrush generation
- 1948-1970 Lots of people from west indies travelled, early migrants, half a million
- 700 Jamaica to London in 1948
- Windrush Square to acknowledge the early migrants
- The west indies community came to Brixton as there was underground air-raid shelter in Clapham, nearest job centre is in Brixton and people would find a place to stay near their job
- Discrimination when people first came, signs saying no blacks, no dogs, no Irish; this would lead to segregation, external/ exogenous factor
- Banks wouldn't lend money to buy properties so they set up their own economic system: a partner, box hand, i.e. money circulation within, letting friends or families to live nearby
- Causes white flight as well, fear of people who are different to you
- Safety in numbers to avoid discrimination or hate crime (internal factor)
- This causes economies to adapt to the community, creating a focus on West Indies culture (food, dress, hair)
- Jews and Poles escaping fascism and WW2
- Caribbean workers invited to rebuild post-war Britain, mainly in public services-Windrush Generation
- Asians from India, Pakistan and Bangladesh escaping poverty and seeking work in public services and textile industries
- growth in asylum seekers applications (125,000 people were allowed to settle in the UK , of these people (45,000were from Africa) east African Asians (mainly from Uganda) escaping persecution and Vietnamese escaping war
- Irish migration
- Eastern European refugees escaping from war and political unrest in Romania and former Yugoslavia
- Economic migration from Eastern Europe caused by the enlargement of the European Union, which enabled unrestricted migration by citizens of the new EU members in central and eastern Europe
1.62 children per woman in 2022
- first time FR rate increased since 2012
- Arrival of immigrants of an ethnicity different from that of the host country.
- The cultural change is consolidated if the immigrants become concentrated in particular places. Natural increase rates can be higher than native ones too.
Kids of original immigrants may move out to new places, taking their culture with them.
Global, international, national and regional influences have shaped the characteristics of your chosen places.
(P: increasing roles of TNCs and IGOs)
Fitzjohns and Frognal Ward
Influence | Past | Present |
Local/regional | - Developed as an affluent residential area in the 19th and early 20th centuries, with large Victorian and Edwardian homes. | - Population: Around 11,000 residents.
|
National | - Integration into London’s transport network improved access, attracting upper-middle-class residents. | - Median age: Higher than the London average, with many older professionals and retirees.
|
International | - Immigration waves from Europe and Jewish communities shaped the area's cultural identity in the 19th and 20th centuries. | - Diverse international residents, including expatriates working in finance, tech, and law. services reflect people in the areas |
Global | - Industrialisation and trade in the British Empire helped the area flourish as a high-status residential zone. | - Housing Market: Affected by global economic trends, with luxury property investments from Asia, the Middle East, and Russia. UK headquarters for Google is in Kings Cross, Amazon headquarters. All Global Brands are present nearby. |
Cardiff Bay
Influence | Past | Present |
Local/regional | Originally a tidal bay, later developed into a key port for exporting Welsh coal during the 19th century. | Major regeneration projects, including the Cardiff Bay Barrage, transformed the area into a cultural and business hub. Population: Cardiff Bay is part of Butetown, which has around 15,000 residents. |
National | Cardiff Bay played a vital role in the UK’s Industrial Revolution, supplying coal from the South Wales Valleys to fuel Britain's economy. | - Home to the Senedd (Welsh Parliament), making it a political and administrative center. Education & Employment: High proportion of degree-level education holders (above the Cardiff average).
|
International | - Cardiff Bay’s coal exports powered global industries, particularly in Europe and the Americas. | - Continued attraction of international businesses and tourists. |
Global | - Part of the global trade network during the British Empire, supplying coal to fuel industrial expansion worldwide. | - Global tourism, digital industries, and international investments contribute to Cardiff Bay’s economy. |
Plymouth- Stonehouse
Student population
• High degree of population 'churn', due to large migration in- and out-flows
• Shortage of affordable/social housing
• Deprivation
• Loss of community
• Many people live in private rented accommodation with very high rental costs.
New range of shops e.g. Polish supermarkets
Space vs place
Space - an area with no meaning
Place - a space with meaning
A space becomes a place and has meaning attached to it
sense of place- the subjective and emotional attachment people have to a place. This can change from one person's perspective to another
The Index of Multiple Deprivation
· Income Deprivation (22.5%)
· Employment Deprivation (22.5%)
· Education, Skills and Training Deprivation (13.5%)
· Health Deprivation and Disability (13.5%)
· Crime (9.3%)
· Barriers to Housing and Services (9.3%)
· Living Environment Deprivation (9.3%)
Your chosen places can be represented in a variety of different forms, giving contrasting images to those presented more formally and statistically. (7)
Each person gradually accumulates a vast series of perceived images or mental pictures of reality formed by memory, imagination and experience. They are a vital part of lived experience and of the meaning of place.
How the lives of students and others have been influenced by continuity and change in the demographic and cultural characteristics of your chosen places. (1)
Cultural identity is the identity or feeling of belonging to a group. It is part of a person's self-conception and self-perception and is related to nationality, ethnicity, religion, social class, generation, locality or any kind of social group that has its own distinct culture.
Aboriginal people in Australia
- Increase in suicide rates in young people
- loss of cultural identity is one of the main reasons for rising Indigenous youth suicide rates.
- Highest in the world
- Aboriginal men in Australia are four times more likely to suicide than their non-Indigenous counterparts.
- For young Aboriginal women, the rate is claimed to be five times higher.
- More usage of drugs and alcohols
- The report says a loss of cultural identity and cross-cultural confusion is prevalent among young Aboriginals.
- Main reason is because the young people don't have a culture to follow, sense of belonging
Limited support for mental health
- One-third (33.1%) of Aboriginal and Torres Strait Islander Australians were aged under 15 years compared with 17.9% of non-Indigenous people in the same age group.
- People aged 65 years and over comprised 5.4% of the Aboriginal and Torres Strait Islander population compared with 17.2% of the non-Indigenous population.
- Higher fertility rate, youthful population, lower life expectancy
- Over a third of the Aboriginal and Torres Strait Islander population lived in Major Cities of Australia (401,700 people). - so people are more exposed to western culture where alcohol and drugs are used more
Only 15.4% of the Aboriginal and Torres Strait Islander population lived in remote places
Tower Hamlets
- Ethnic inequalities occurred in not only deprived areas like Tower Hamlets, but also affluential areas and rural areas too
- Tower Hamlets,, ranks as the seventh most deprived district in England
- 69 per cent of its population group other than White British so 5th most ethnically diverse area in England and Wales.
Worst district for Asian inequality
- population of Tower Hamlets increased by 22.1%
- Tower Hamlets' population saw the largest percentage increase in England
- the average (median) age of Tower Hamlets increased by one year, from 29 to 30 years of age., youthful compared to 40 in rest of country
In 2021, 51.5% of Tower Hamlets residents reported their country of birth as England
- Social mobility – The ability of people (families or individuals) to move to different levels of the social hierarchy.
- Mapping and understanding social mobility will become more complex in future. Some of the trends suggest there will be more movement between groups, which may make social mobility more problematic by increasing barriers for more marginalised groups (underclass can’t rise as everyone else is constantly rising).
- As access to the internet and hyper-connectivity increase, information and education may become more freely available and shared, enhancing life opportunities for many individuals.
- Social integration – The idea of all members of a community/area being involved in activities and decision making processes.
- Communities in the UK over the next 10 years may become less cohesive as identities become more fragmented. However, hyper-connectivity can also create or strengthen new group identities.
- Young people may have very different expectations from previously in terms of wealth creation and debt, home ownership, careers and stability. Uncertainties over future economic growth may also give rise to a lack of feeling of belonging, and less social investment for the future by some groups
During industrialisation, urban places were perceived by some as dangerous and threatening ( Victorian London); currently they could be seen as attractive because of their range of economic opportunities and the variety of social and leisure activities that attract young people and migrants.
• Horribly overcrowded slums with poor living conditions
• Cities population rise from 1 to over 6 million
• Growth exceeded the capital's ability to took after basic needs of its citizens
• The economic growth and technological advances was not directed towards the poor
• Poor working conditions for manual workers and children (dangerous and unhealthy)
• Coal-fired stoves and poor sanitation made the air heavy and foul-smelling
• Raw sewage dumped into river Thames
• Health declines, rise of contagious diseases such as cholera, smallpox and typhoid
• Mid-century life expectancy in London was 37 years
• Poor couldn't pay for a doctor and could only go to charitable hospitals or workhouse infirmaries
• Prevalence of poverty increased incidence of crime, usually young males and petty thefts
• Women usually committed crimes linked to prostitution, soliciting, drunk and disorderly (victimless-crime)
• Construction of proper sewage system, of tunnels and pipes to divert sewerage outside the city
• Founding of Metropolitan police in 1829 to improve law and order
• Building new homes for working class
• Regent street and Piccadilly Circus
• New house of parliament
• Trafalgar square and national gallery
• Opulent housing for the wealthy in Belgravia
Some urban locations are perceived as undesirable by residents and/or outsiders due to crime rates, environmental quality, population characteristics and reputation, based on quantitative data but also due to lived experience and media representation. (2)
-high living cost
- High cost of housing
- Financial and physical cost of commuting
- Higher costs of food
- Unsatisfactory or substandard housing
-low environmental quality
- Atmospheric pollution
- Noise and light pollution
- Antisocial
-crime
- Higher incidence of poverty linked to crime
- Crime rates vary within urban cities, higher rates in central London
- Hub of crime is Heathrow airport eg bag theft, illegal drugs carried
-ethnic diversity (some people discriminate against ethnic minorities)
- Strongly segregated within the UK towns and cities either by choice or for mutual support
- There is still discrimination on the grounds of ethnicity
- Some people are moving out of their original enclaves and in the direction of suburbs due to increasing self-confidence, secure employment, increasing affluence, a wish to put space between them and their ethnic culture, a wish to become more integrated into UK society, and a perception that the grass is greener elsewhere
-elderly may experience social isolation and feel increasingly vulnerable in urban places
media representation and reputation may affect perceptions of urban places
a complete or nearly complete lack of contact with people and soccer. It differs from loneliness, which is a temporary lack of contact with other people
- This feeling is diluted over time by a willingness to become assimilated into the UK society and living close to, and feeling at ease with, others belonging to the same ethnic community
- For some, social isolation will persist, whether by choice or force of circumstance
Isolation is not confined to ethnic minorities as if afflicts the elderly too
- Some people feel comfortable where they have grown up and don't want to move their roots elsewhere
- They feel out of tune with what is going on as their community changes
- Everything seems more hectic and noisy, and feel increasingly isolated as other older residents have either died or made retirement moves elsewhere
- They have little rapport with the increasing number of new residents moving into the area, especially immigrants
- Concerns about their personal safety and property, and about a rising incidence of crime adds to their discomfort
- They feel increasingly vulnerable and threatened
Suburban and inner-city areas are perceived differently in terms of their desirability as places to live and work by contrasting demographic groups (by age, ethnicity, life-cycle stage). (3) (A: attitudes may vary)
• Greatest differences in lived experience are those between central and inner city on one hand and the suburbs on the other, best seen through the life cycle
• A young adult fresh out of university would have ambitions to move into accommodation of their own and be content with a small living space where property prices are low (most likely inner and older parts of urban places. It is commutable distance and around nightlife.
• This perception that the good life is to be found in the more central parts of urban areas might change when it comes to settling down as a family person
• The suburbs are better for a residential area with good schools and green spaces for kids, healthcare services and shops
• This perception of the suburbs has changed and is now less dull and characterless
• As people move further along their career path, and their children have left home, people move to commuter towns or villages
• Retirement causes people to move to more rural areas as there are no worries of costs and time of commuting + bigger houses, golf courses, good quality shops
• So pros and cons of lived experience hinges on your won perceptions and you place in the life cycle, and housing prices
Rural places are often perceived as idyllic because of their tranquillity, natural landscapes and historical and cultural associations ( Hardy’s ‘Wessex’). (4) (A: urban and rural residents may differ in their attitude to places)
In today's crowded cities, many people chase the dream of counter-urbanising to live in an 'rural idyll' - a problem-free, natural, peaceful, healthy and friendly village.
Proximity to nature Organic farming
Attractive landscape and scenery
Friendly community
Sheltered location Easy access to services
Peace & quiet
Personal security
No pollution of any kind
Minimal crime
The movement of people from major cities to rural areas.- counterurbanisation
Perhaps one of the best-known and most widely read purveyors of the rural idyll was the novelist Thomas Hardy (1840-1928). . Hardy's Wessex has since become recognised as 'the epitome of the vanishing English rural heartland'. This heartland was then, of course, being threatened by urbanisation and the new technologies of the Agricultural Revolution. On the one hand, Hardy was perpetuating the rural idyll. On the other hand, his novels constantly remind us of the harshness of rural life, its strange folklore and its often cruel traditions.
Some rural locations are perceived as undesirable by residents and/or outsiders because of remoteness, limited social opportunities, limited range of services, high transport costs, population characteristics and reputation based on quantitative data but also because of lived experience and media representation.
- Remote rural: areas over an hour from the nearest large urban centre
- Accessible rural (including the commuter belt): areas within an hour of the nearest large urban centre
- 9.7 million people were estimated to live in Rural areas in England in 2020, compared with 46.9 million In urban areas
- Higher proportion of people were above 65 at 25.4% compared to urban areas at 17.1%
- According to the 2011 census, 19.8 million people live in rural areas and of these, 98% live in accessible rural places
Rural areas, especially those not easily commutable, have a significant population of retirees and long-time residents.
Predominantly 'white British' demographic in these areas, with ethnic minorities tending to prefer urban living.
The dynamics of population growth in accessible rural areas reveal a blend of factors shaping their demographics. These areas attract retirees seeking a quieter lifestyle away from urban centers, contributing to a predominantly 'white British' demographic. However, there's potential for change as ethnic minorities may eventually shift towards rural living. Additionally, rural areas with recreational attractions draw urban day-trippers, creating jobs and income opportunities, particularly for the working-age population. Government planning plays a significant role, with some areas earmarked for expansion, leading to rapid population growth, while others are protected by green belt status, fostering desirability and attracting wealthier residents, primarily in the 50+ age range. Conservation efforts also enhance the appeal of certain areas, making them sought-after by affluent individuals.
Rural areas are viewed in different ways: from very remote areas to retirement villages and commuter villages.
(A: attitudes may vary)
Hawkshead Accessible rural
Perhaps beyond the reach of easy commuting, these rural areas maintain their attraction by being within easy reach of urban dwellers who take regular day trips to these honeypot areas, thereby sustaining a healthy local economy. What attracts urbanites here?
Predominantly white British, with a largely elderly (retired) population. Why? What influence will this have on mortality rates?
Government planning protection (greenbelt status) = less expansion (housing & pop) = more desirable = wealthy 50+ pop move in...
- more so in those beyond the reach of easy commuting, there is
- a strong component of retired people.
- involves both people who have made retirement moves away from urban areas and people who have lived in these places for many years, if not their whole lives.
How is remoteness being viewed positively in some remote rural areas?
Increasing numbers of urban people value solitude, peace, and quiet, as well as fine scenery
What impact do second homes and holiday lets have on some remote rural areas?
They may bring in temporary residents but do little to prevent the 'ghost-town' effect and local service closures
What is counter-urbanisation and how is it affecting some remote parts of the UK?
People dissatisfied with urban living are moving homes and jobs, facilitated by modern communications technology
What is the trend regarding young people in remote rural areas?
They are continuing to leave, causing a decline in population
- Rural areas have suffered depopulation due to urbanization and rural-urban migration.
- Push factors include remoteness, poor quality of life, and harsh environments.
- Resulted in a downward spiral of decline and deprivation, with young people leaving for better opportunities.
- Signs of reversal in some remote rural areas, particularly in the Highlands and Western Isles of Scotland.
- Tourist industry re-evaluating physical environments, emphasising remoteness as desirable for solitude and scenery.
- Tourism creates jobs and income, but second home purchases bring challenges like temporary residency and service closures.
- Counter-urbanisation observed in some areas, enabled by modern technology allowing remote work.
- Despite glimmers of hope, rural areas continue to lose young people, with elderly returnees insufficient to compensate.
• Suffered from de-population & subsequent decline.
• Source of urbanisation (out-migration) due to remoteness, poor QoL & sometimes harsh physical environment.
• Characterised by spiral-of-decline & deprivation
Commuter belt (Hurstpierpoint)
- According to the 2011 census, 20 million people live in rural areas. Of these, 98% live in accessible rural places.
- These are the immediate beneficiaries of suburbanisation and decentralisation
- These are places experiencing fast rates of population growth, largely due to the arrival of large numbers of workers looking to escape the downsides of urban places. Covid....
- In-migration of working age adults = dominant age group. Prevalence of young adults = high natural population increase (high fertility rates).
Mortality rates are around the national average
Hints of recovery for remote rural?
- Tourism playing a major role in the potential transformation of some remote rural communities - especially in the Highlands of Scotland.
• More desire to get away from urban and get into more adventurous areas from certain groups of people
• Increases jobs, diversifying away from primary sector
- Quest for adventure & remoteness from urban dwellers is kick-starting some remote communities which in turn is creating employment & income.
- Increase in 2nd home ownership & holiday lets. Blessing or curse?
• No business for local businesses in winter, non-holiday times
• High income in summer months
- Trickle of counter-urbanisation to remote places made possible by modern communications technology.
However, despite this, remote rural places continue to lose huge amounts of young people...
Millfield, Northumberland
- No post office in Millfield
- 40,000 village stores closed down
- Primary schools closing down
- 800,000 people migrated to the countryside in the past decade
- Older generations flocking to the area
- 400,000 less young people than 20 years age
- Influx of second homes is driving up property prices
Annual income is 20% lower than city
Pursuit of Rural idyll in retirement
The use of statistical evidence to determine whether people have a positive or negative image of your chosen local place. (5)
Different media can provide contrasting evidence about the image different people have of your chosen local place.
How different representations of your chosen local place could be used to influence the perception of cultural and demographic issues and conflict. (6)
Significant internal movement of people within the UK has created uneven demographic and cultural patterns.
( London and the south-east)
Culture and society in the UK has changed because of significant international migration flows from former colonies ( Indian sub-continent and the West Indies) and from the European Union. (P: the main gatekeeper player affecting flows is the Government)
Some international migrants choose to live in rural areas for specific reasons, creating social challenges and opportunities. ( East Europeans in Lincolnshire)
International migrants tend to live in distinctive places withsegregation closely related to economic indicators (income and employment) and social indicators (health, crime, ethnicity and education). (7)
Diverse living spaces in urban areas have social characteristics that reflect ethnicity and culture in terms of distinctive retail outlets, places of worship and leisure.
( Southall) (8)
Experiences and perceptions of living spaces change over generations as communities have evolved economically and culturally. (A: intergenerational attitudes and norms may change from global cultural trends)
Different community groups, local and national governments and TNCs may make changes to land uses that create challenges and opportunities for local people and their lived experience of place. (A: different actions may have different impacts)
There are sometimes tensions over the diversity of living spaces, especially between long-term residents who seek continuity and recent in-migrants who may seek change. (9) ( Luton)
Changes to the built environment will bring benefits to some groups but can provoke hostility from other groups that perceive migrants as a threat to their culture. Migrants may experience a sense of social exclusion. ( Glasgow)
(P: planners and developers may make controversial decisions)
Management can be assessed using measures of income and employment (both relative and absolute changes) both in areas and by comparison to other areas.
Social progress can be measured by reductions in inequalities both between areas and within them as well as improvements in social measures of deprivation and demographic changes (improvements in life expectancy). (8)
Integration of different cultures can be measured by levels of political engagement through voter turnout, the development of local community groups and reductions in ‘hate’ crime and racism.
A study of the contrasting ways in which different demographic and ethnic groups view an urban living space and the impact of national and local strategies in resolving issues ( Aik Saath in Slough).
The changes that have taken place can be judged using a range of economic, social, demographic and environmental variables in the changing urban area. (F: changes may create differing legacies)
Different stakeholders (local and national governments, local businesses and residents) will assess success using contrasting criteria depending on their role, the meaning of the place and the impact of change on both the reality and their image of that place. (10) (A: ‘success’ depends on the attitudes of different players)
A study of the contrasting ways in which different demographic and ethnic groups view a rural living space and the impact of national and local strategies on a rural area ( Lake District National Park Partnership).
The changes that have taken place can be judged using a range of economic, social, demographic and environmental variables in the changing rural area. (F: changes may create differing legacies)
Different stakeholders (local and national governments, local businesses and residents) will assess success using contrasting criteria, depending on the meaning of the place and the impact of change on both the reality and their image of that place. (A: ‘success’ depends on the attitudes of different players)