Ecology Unit 2
1/115
There's no tags or description
Looks like no tags are added yet.
Name | Mastery | Learn | Test | Matching | Spaced | Call with Kai |
|---|
No analytics yet
Send a link to your students to track their progress
116 Terms
Soma
body tissue that is not reproductive
Semelparous
(e.g. many salmon, annual plants)
• Lower somatic maintenance,
more energy to reproduction
• Not as reliant on survivorship
• Risk of losing all in poor
environment
Iteroparous
(e.g., humans, perennial plants)
• Requires somatic maintenance
• Risk of dying before producing
all offspring
• Hedges against environmental
fluctuation
Life history
the combination of survival and reproductive characteristics of a species
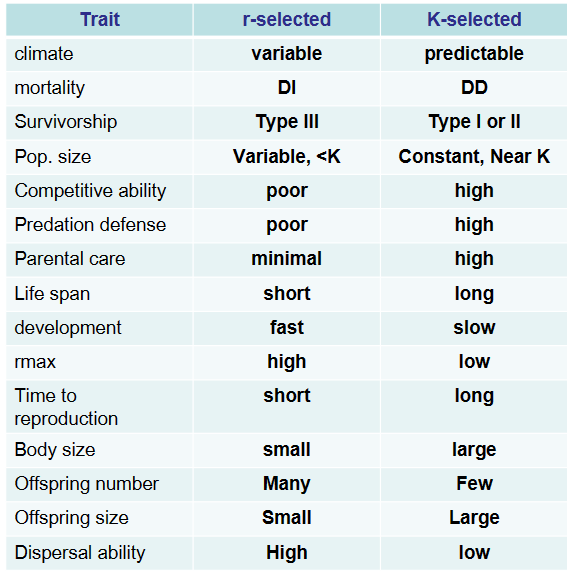
r-selected species
• High initial growth rates
• High dispersal rates
• Good colonizers or invasive
K-selected species
• Use resources efficiently
• Good competitors
• Survive when it is more crowded
Relationships among lx and mx
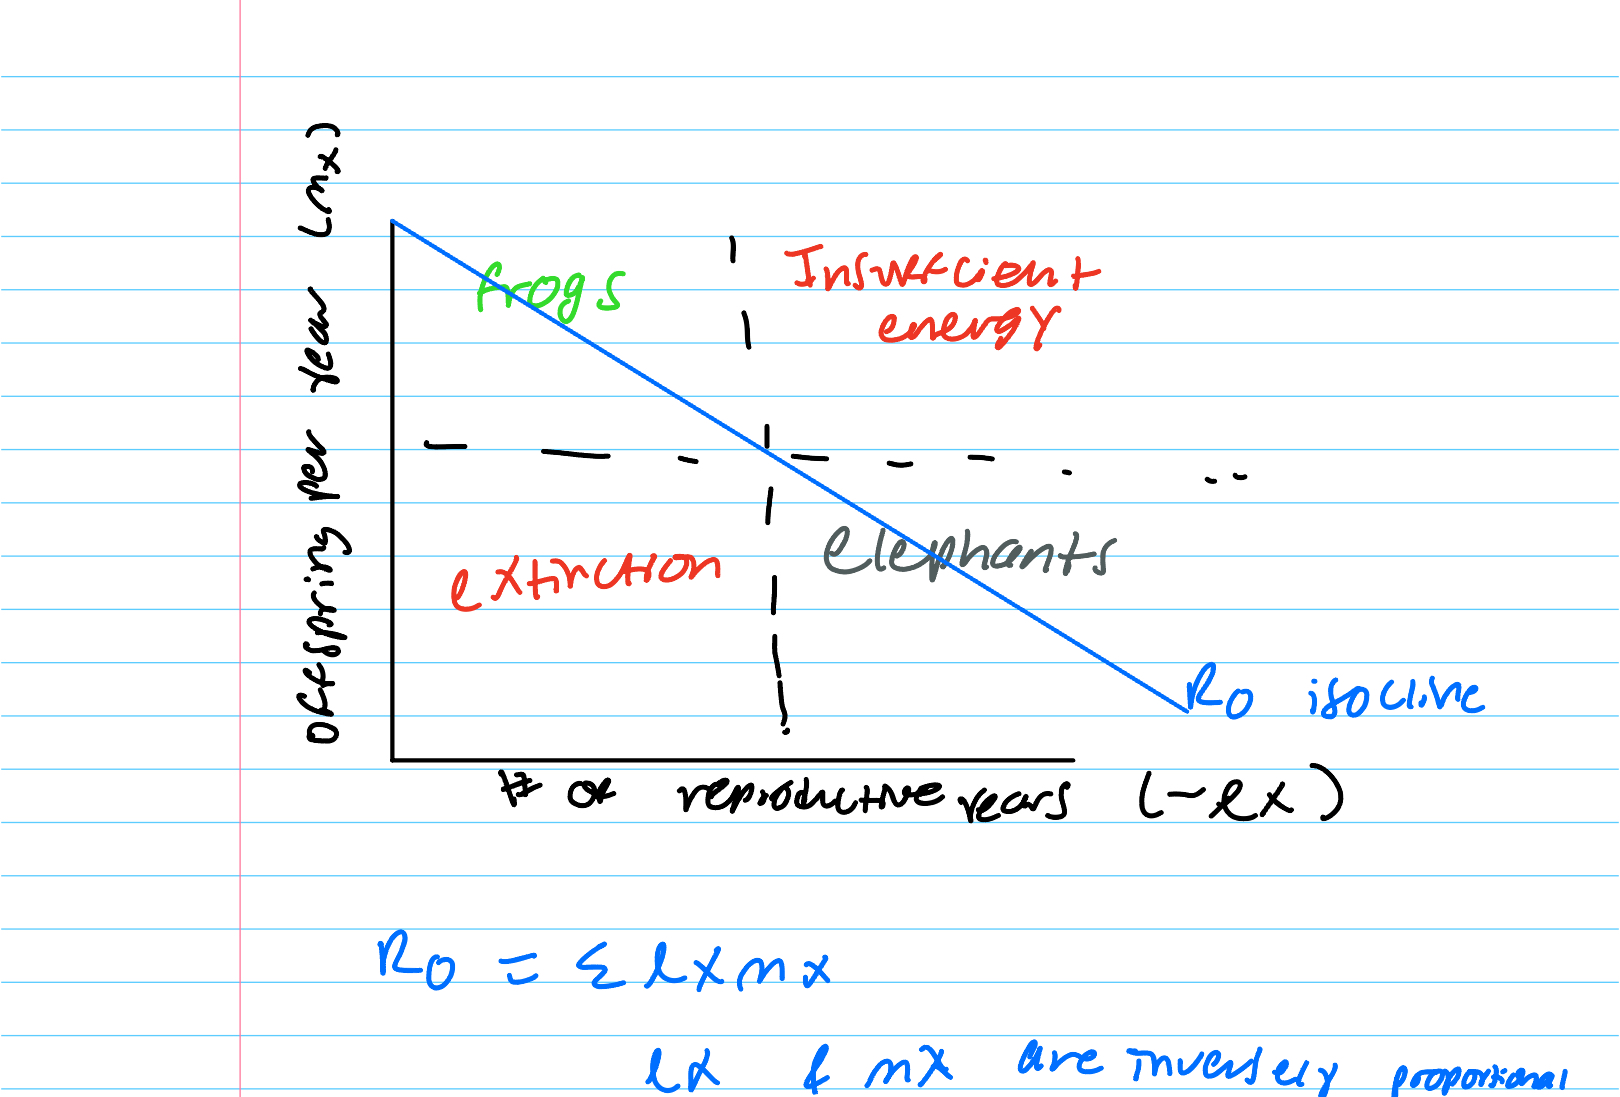
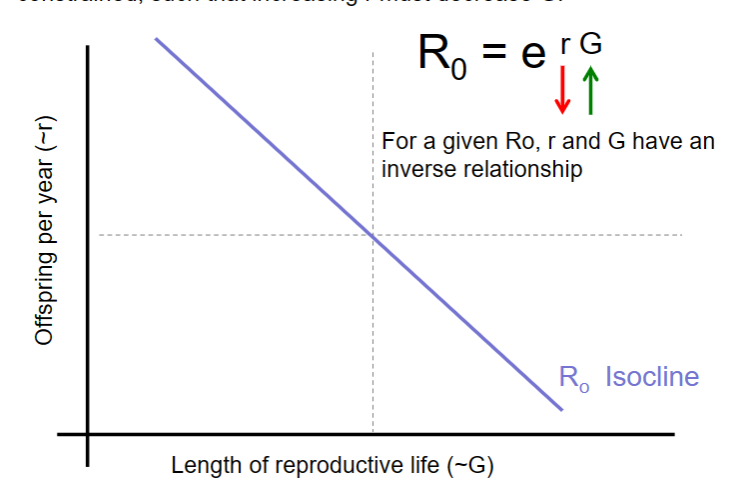
Relationships among lx, mx, r, G, K, and r
As G (generation time) increases, then r decreases and vice versa
Trade-offs between survival (soma) and reproduction
-- r is inversely related to G (as we predicted!)
-- generation time (G) is positively related to size
-- r is negatively related to body size
-- high individual growth rate is positively correlated with r
-- individual growth rate is inversely correlated with size
r and K selection and their characteristic traits
Niche
Two meanings of been used historically, role vs. requirement
fundamental niche
under requirements definition:
a species’ niche in the absence of competition, predation, and other interactions
realized niche
under requirements definition:
a species’ actual usage of resources with competition and other biotic interactions
“roles” niche
the per-capita effects of that species on the environmental conditions (like a baker or teacher in a community)
“needs” niche
the resources or factors necessary for the existence of a species in a given habitat
Turnover in lakes
the sinking action and mixing of the water results in the exchange of bottom and surface water, moving important nutrients in the water column (water is most dense at 4 C)
Rain shadow
where winds push air over a mountain. As the air rises, it loses pressure and cools (adiabatic cooling) and also loses its ability to hold water, causing rain. The air that reaches the other side is now dry, causing a dry “shadow” on the far side
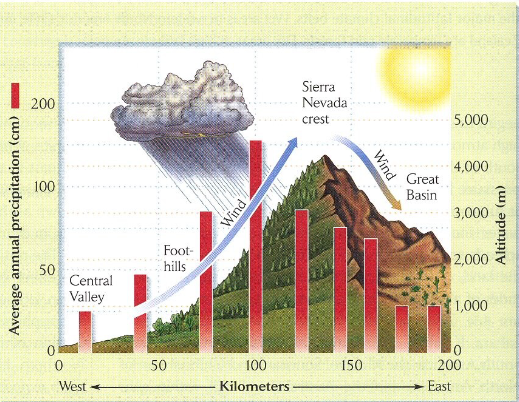
adiabatic cooling
heating or cooling that comes from within. Air moving up loses pressure (at higher altitude) and hence loses heat (cools) and vice-versa
dew point
temperature at which condensation begins
biome
the large-scale patterns of temperature and rainfall to define broad vegetation types
large geographic areas that are characterized by distinct types of plant species, maintained by the climatic conditions of the region
Understanding the two definitions of niche and their combined meaning
The joint description of the environmental conditions that allow a species to persist in a given environment along with the per-capita effects of that species on the environmental conditions
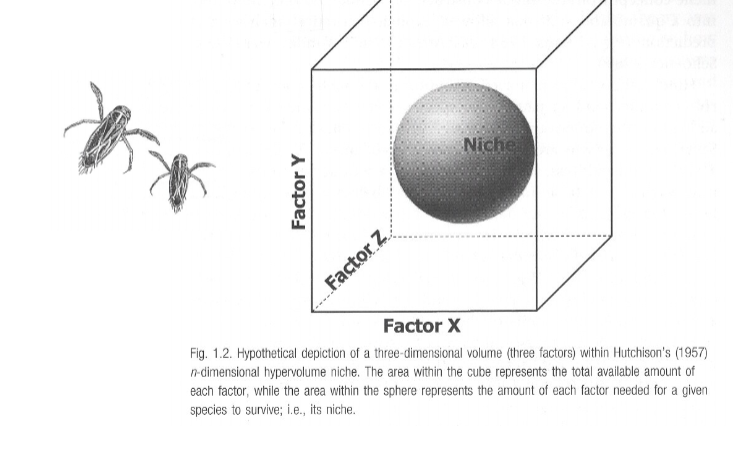
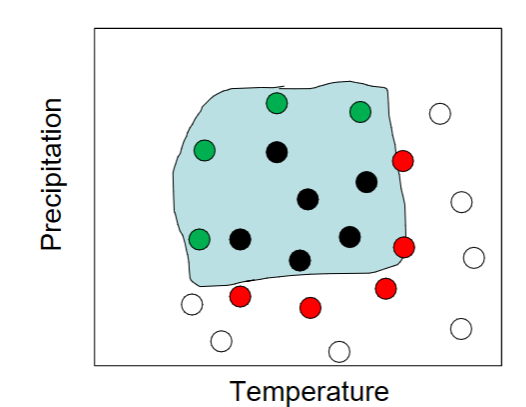
Needs niche as an n-dimensional hypervolume
The area within the cube is the niche (amount of each factor for the species to survive)
Testing for fundamental vs. realized niche space
The fundamental niche describes abiotic factors that determine where a species can occur
We tend to emphasize the biotic factors that limit species for their realized niche, but of course the realized niche is also constrained by the larger abiotic fundamental niche of a species
Fundamental niche determined by
abiotic factors like light, temperature, and water
Basic properties of light, water, and temperature
dominant abiotic niche factors
Biomes determined mostly by
temperature and precipitation
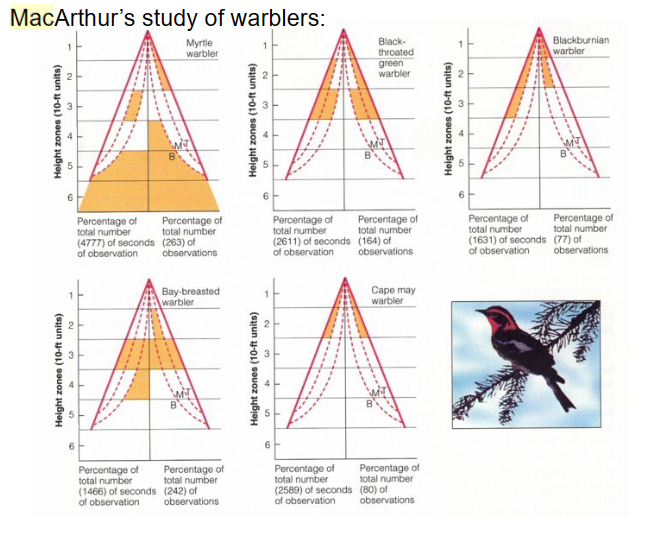
MacArthur’s warblers
five warbler species coexist in boreal forest of New England
all eat insects and are about the same size
how can they coexist if they utilize the same trees and compete for food?
MacArthur showed that each species occupies a different portion of the tree
There are also some slight differences in nesting dates
he suggested that these differences allow the species to coexist
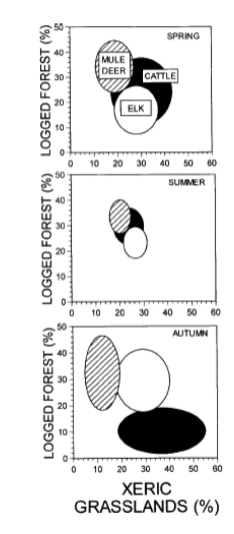
Stewart et al.’s study of deer, elk, and cattle niche parameters
They proposed that elk and deer have persisted for a long time in the same area and so must partition the habit in some way. However, cattle are new to the area and may compete (and thus have high niche overlap) with elk and mule deer.
Elk and mule deer generally to partition the habit, with elk spending more time in the grasslands and deer more time in the forest.
Cattle may compete strongly with both species during the spring and summer, but not in the fall when they are moved down to lower elevation grasslands.
Competition
a reduction in resource acquisition rate (feeding, foraging, parasitism, nutrient uptake) due to the action or presence of another individual that seeks to acquire the same resources
Resource competition
competition of resources such as soil, food phosphorus
Symbiosis
close association between two species, often positive
Commensalism
a long-term biological interaction in which members of one species gain benefits while those of the other species neither benefit nor are harmed
ammensalism
one organism is harmed and the other stays unaffected
mutualism
symbiosis that is beneficial to both organisms involved
interference competition
directly preventing their physical establishment in a portion of the habitat
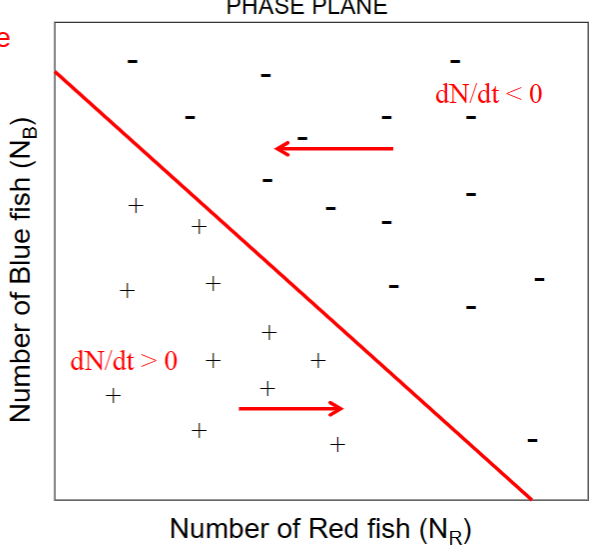
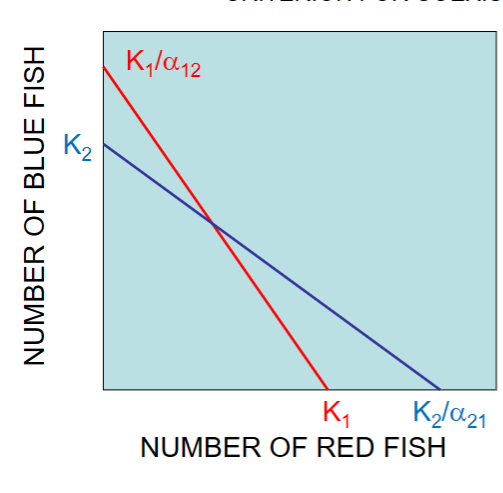
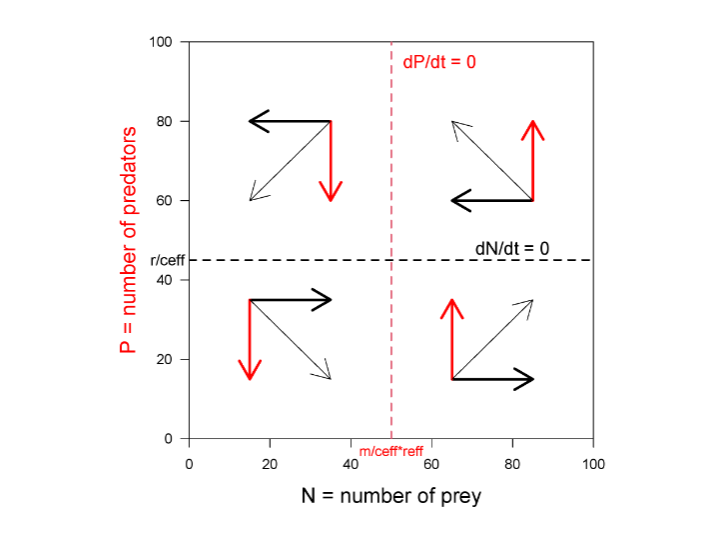
isocline
where dN/dt = 0
helps predict the outcome of competition
phase plane
the graph with isoclines to predict outcomes of competition
Types of species interactions
competition, predation, and symbiosis (mutualism, communalism, etc.)
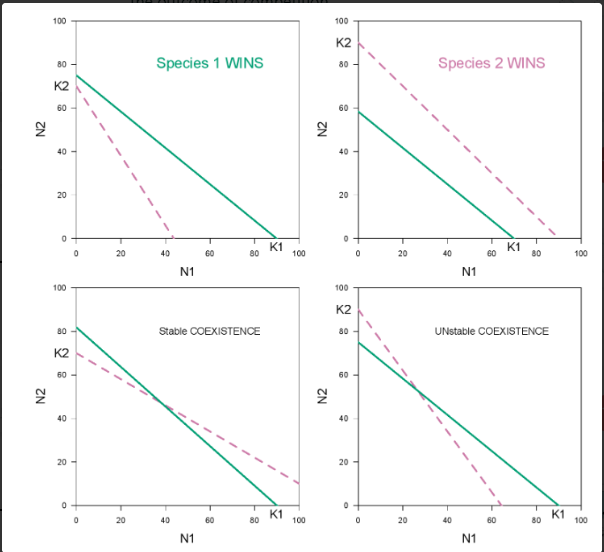
Isoclines and predicting the outcome of competition
we can use isoclines in phase planes in order to predict the outcome of competition

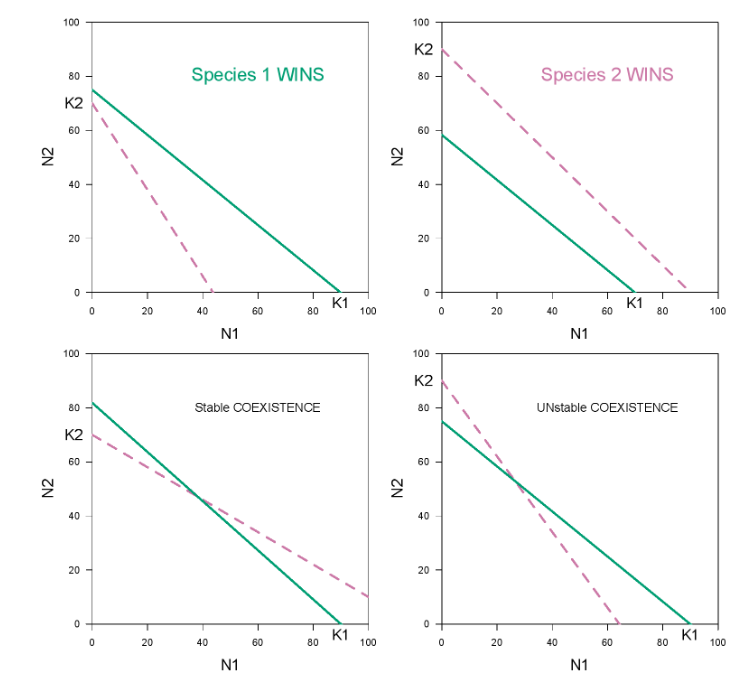
4 outcomes of competition
There are four possible outcomes in these graphs

Tingley, et al. on bird Grinnellian Niches
Overall, the study found that many bird species exhibited niche tracking in response to climate change, and this was linked to their historical climatological sensitivities and elevation preferences
models that consider these weather preferences help explain their movements better than models that don't.
In the pic: you can tell the climate affects niche because one side is uniformly green (colonized) and the other side is uniformly red (extinct)
Connell’s barnacles affected by fundamental and realized niche
Connel used a classic way to study species interactions – manipulate species abundances (often removal), then measure the growth or abundance of some species of interest.
Recognize that this is a study of both fundamental (abiotic) niche and realized (biotic) niche.
The study shows that species do not necessarily occur in their ideal location, but can be displaced by a better competitor or predator (difference between fundamental and realized niche).
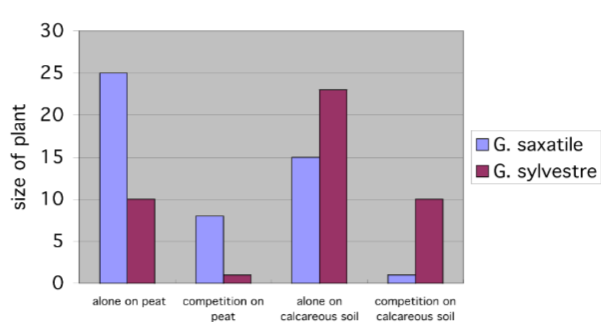
Tansley’s competition in plants on different soils
First, one must compare the growth with and without competitors to quantify competition, which usually involves an experimental manipulation. Second, the outcome of competition can vary with environment.
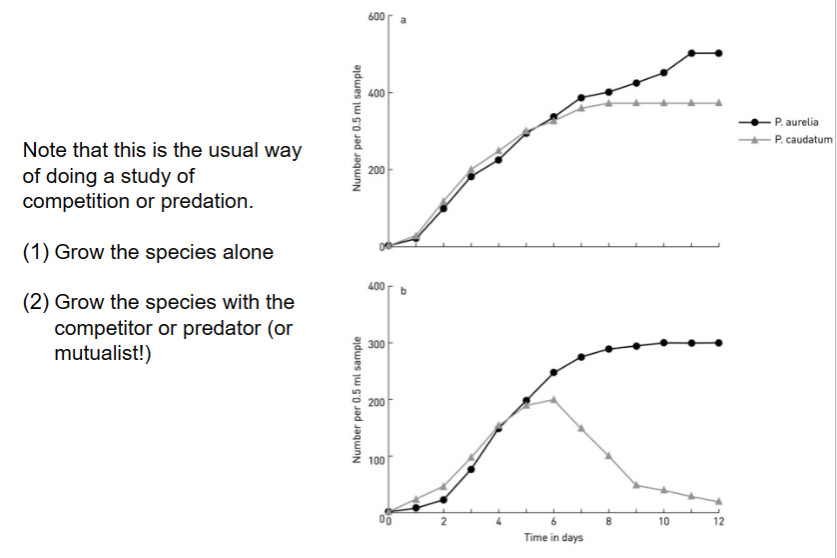
Gause’s protozoa and competitive exclusion
This worked caused Gause to propose his theory of competitive exclusion
The competitive exclusion principle tells us that two species can't have exactly the same niche in a habitat and stably coexist
Isocline
Remember that the growth rate of each species on its isocline is ZERO
Alpha 12
On 1, the effects of 2
stable coexistence
Coexistence of competitors requires that:
K/alpha > K
so that alpha< 1.0
Another way of stating this is that, for similar species (K’s are similar), coexistence requires that intraspecific competition (alpha11 and alpha22 = 1) be greater than interspecific competition
(alpha12 and alpha21 < 1.0)
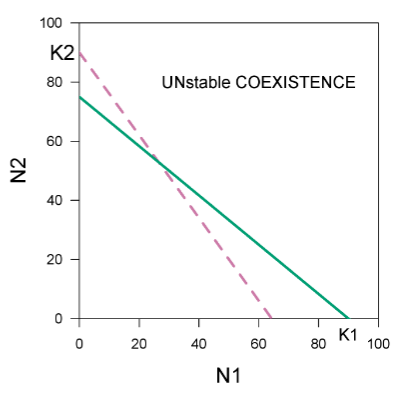
unstable coexistence
K’s on the outside =unstable
How to get isoclines in phase planes from two-species growth equations
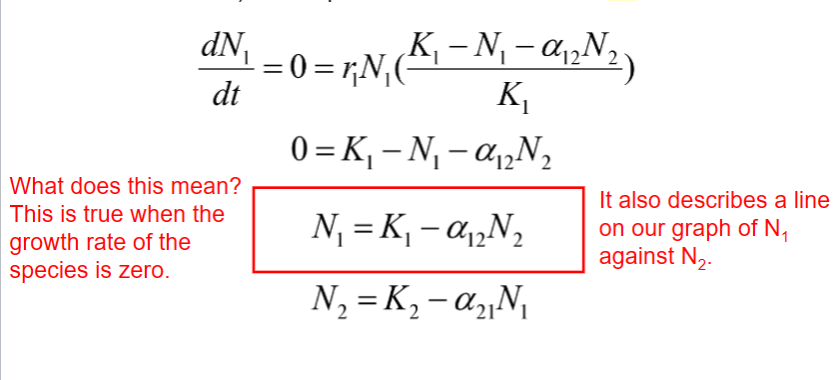
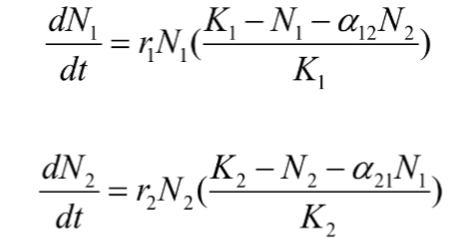
Lotka-Volterra competition equations
But, these linked equations just tell us the growth rates of the two species, but not who wins in competition or if they coexist. The outcome of competition involves looking at when dN/dt = 0
Predictions of LV competition equations
Competition can lead to one of four outcomes Competitive outcome is dependent on K and alpha
Competitive outcome is not usually dependent on r (except for unstable coexistence)
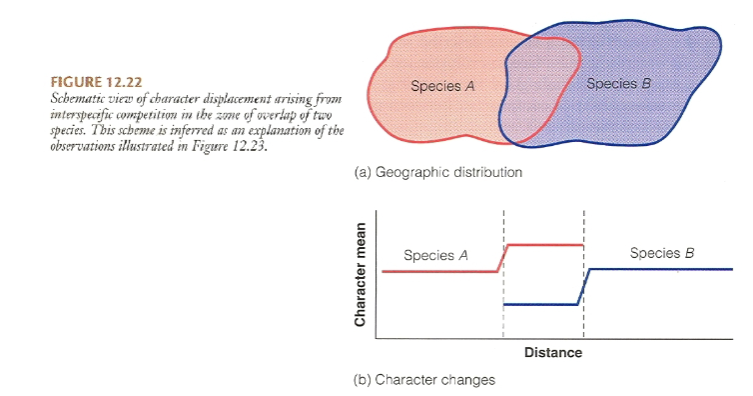
Character displacement
occurs when similar species that live in the same geographical region and occupy similar niches, differentiate in order to minimize niche overlap and avoid competitive exclusion
Null models
The patterns produced by the characters must be non-random to considered as the result of competitive interactions. To check if the patterns are not random, they want to compare them to a random/null distribution
allopatry
occurring in different areas
sympatry
occurring in the same area
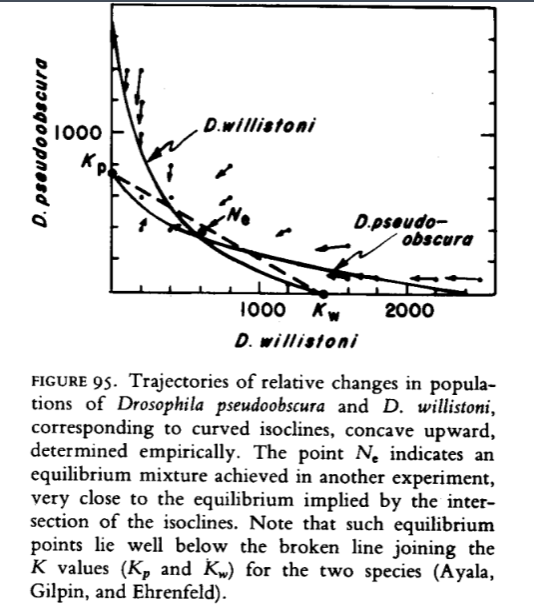
Relaxing assumptions of LV
In reality, for example, alpha’s are not constant and so the isoclines are not actually straight but are somewhat curved.
The important things here is that the assumptions of the L-V can be frequently violated. The specific predictions from L-V may then NOT work, but the qualitative predictions often still hold
What is sufficient evidence for competition in the wild?
i) observation of interactions
ii) correlations in abundance
iii) experimental manipulations
iv) evolution of traits
(on exam, for best evidence of competition, put down an experiment similar to Connells or Tansley’s)
Best test is always experiments with and without competition.
Experiments are best when you test the population with competition and without competition
Evolutionary responses to competition, including character displacement?
Some species will evolve to change their needed resource in order not to have niche overlap (Character displacement )
The mere fact that species differ in some trait related to resources does not mean that the competition is occurring or is involved in the evolution of the trait.
Use of null models for testing character displacement
To check if the patterns are not random, they want to compare them to a random/null distribution
r and K selection as related to types of competitors
r selected species are weedy types that typically come into areas that aren't already crowded, grow fast, reproduce, and then die or move to a new spot. This doesn't require a lot of competitive ability. K selected species are those that long-lived and stay in an area for a long time and so have to stick around when resource become limiting -- so they are selected to generally better competitors
Evolution of niche divergence or niche convergence or both?
Niche divergence typically occurs when there's selective pressure favoring differences in resource use or behavior.
Niche convergence can happen when species face similar environmental challenges or opportunities, leading to them developing similar traits or behaviors.
Crombie’s beetles test of LV
Results: some had a species win, others had coexistence
Competition occurs for limiting resources
Competition can lead to competitive exclusion or
coexistence for different species combinations
The outcome of competition can be well described by Lotka-Volterra equations using simple experiments
Park’s flour beetles showing effects of environment
Park demonstrated that environmental conditions do affect the outcome of competition by varying the K’s and a’s of the component species.
Park worked on a number of different species of flour beetles under a variety of conditions. He was able to easily demonstrate all four of the predicted outcomes of competition (A wins, B wins, AB have stable coexistence, or winner depends on initial abundance)
Ayala’s relaxing assumptions of LV with fruit flies
Ayala demonstrated this with fruit flies, showing the per-capita effects of competition were most intense when one or both species was rare, but were not as intense when each is closer to its carrying capacity. This yields curved isoclines.
three colors of males of side-blotched lizards
These males have three color morphs, blue, yellow, and orange, that compete for mates. The polygynous orange-throated males dominate the more monogamous mate-guarding blues; the oranges are in turn bested by the sneaker strategy of yellow-throated males, and the sneaker strategy of yellows is in turn bested by the mate guarding strategy of blue-throated malest
bill size in Darwin’s finches and in terns
We can prove characteristic displacement when we can see that only when the two species live in close proximity, they show differing characteristics
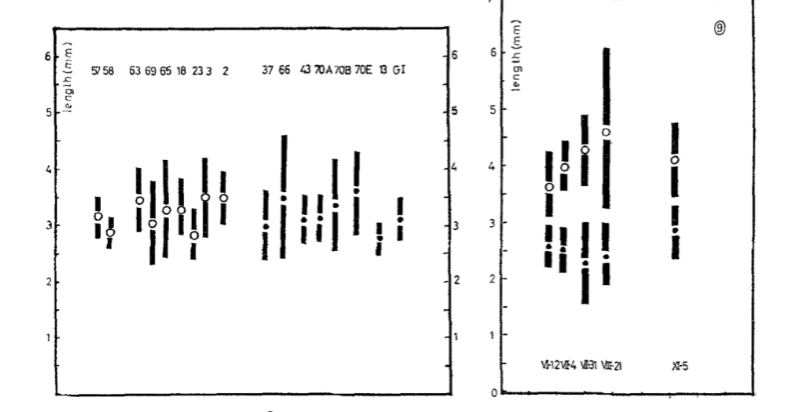
Fenchel’s allopatry and sympatry in snail shell size
Fenchel’s (1975) snails also show this pattern in shell size when comparing allopatric (left) and sympatric (right) populations (character displacement)
in pic: you can see that the black spots have shorter length when living with the white spots compared to living alone
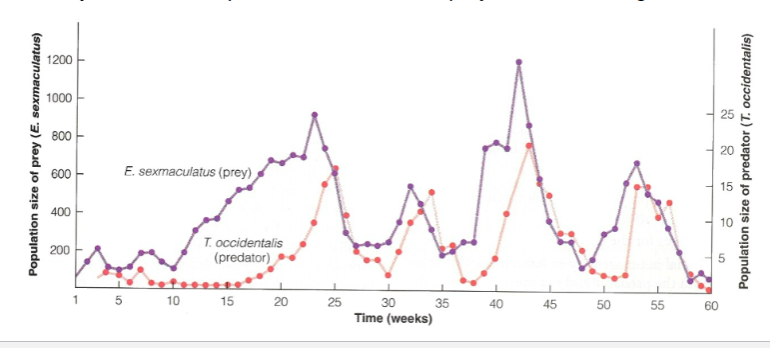
Oscillations
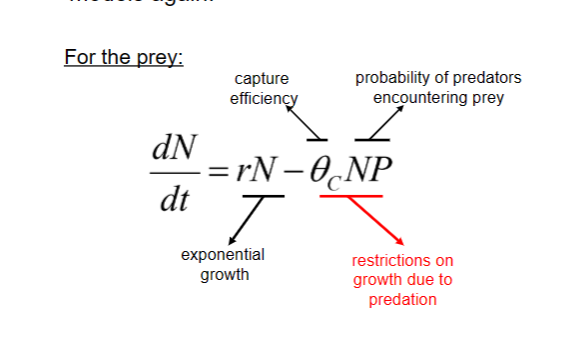
Predator-prey cycles are based on a feeding relationship between two species: if the prey species rapidly multiplies, soon afterwards the number of predators increases - until the predators eventually eat so many prey that the prey population goes down again
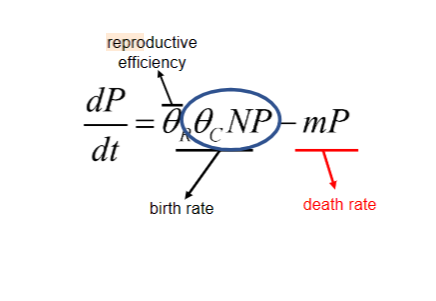
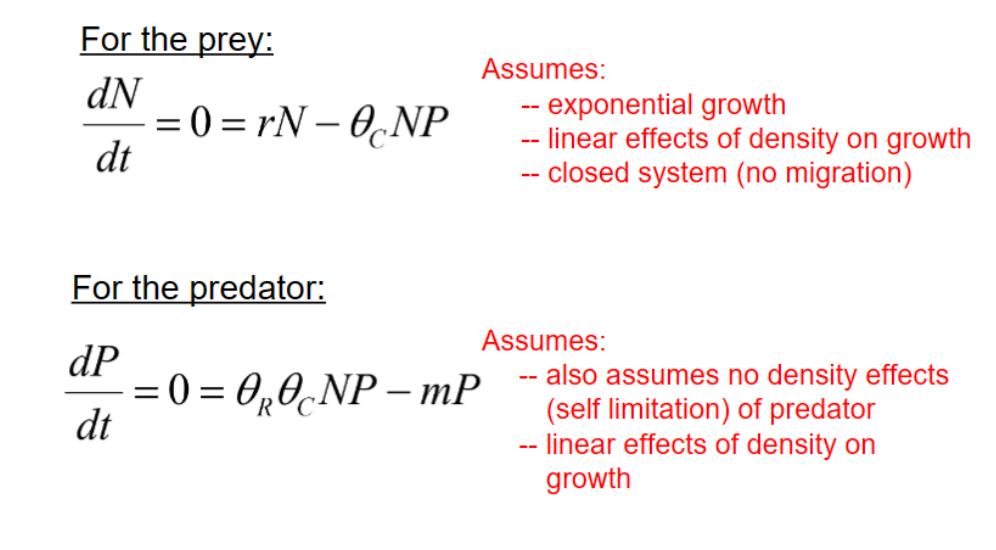
Reproductive efficiency
thetaR
how well the predators make babies
Capture efficiency
thetaC
effect of a single predator on the per capita growth rate of the prey population
Basic prey equations
Basic Predator equations
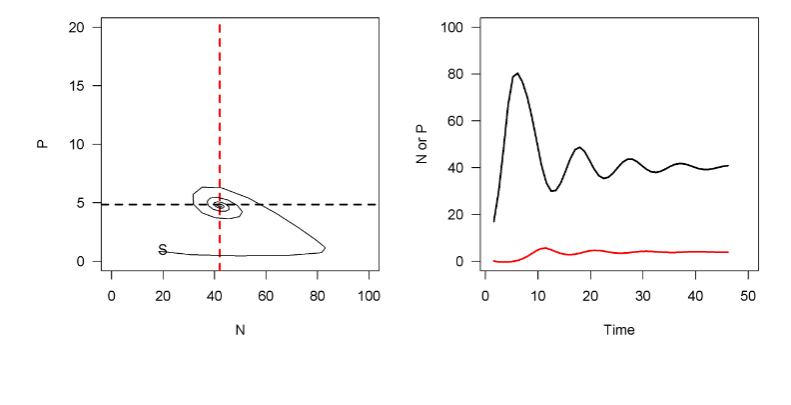
Damped oscillations
stable coexistence
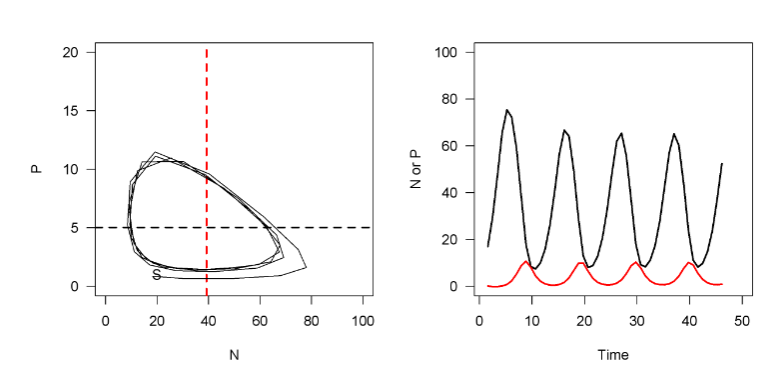
stable oscillations
Oscillating coexistence
increasing oscillations
Increasing oscillations leading to extinction(s)
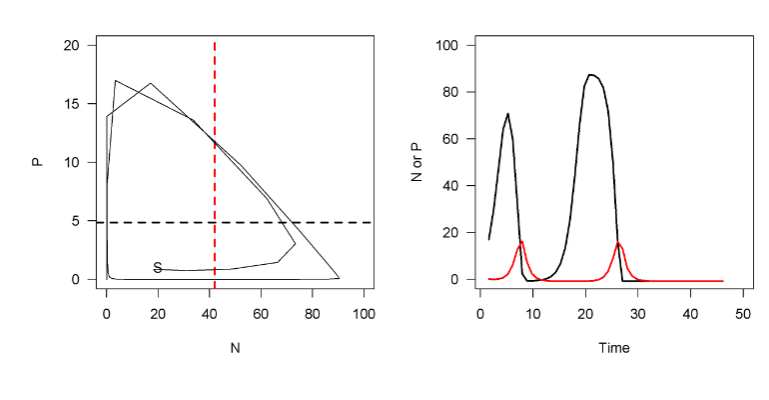
Predators vs Prey graph
know when prey in increasing/decreasing and predators and increasing/decreasing
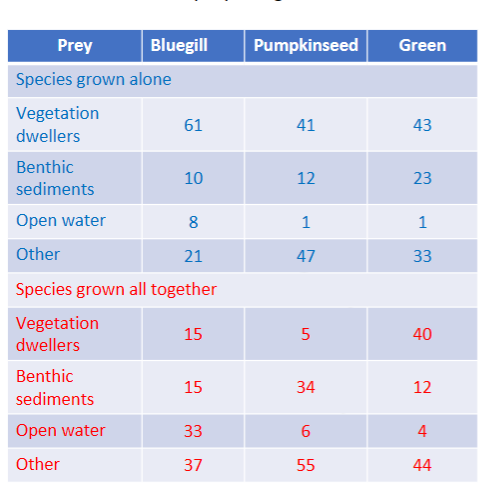
Werner and Hall’s sunfish
They observed the fish both alone then together
They found out that all fished grew smaller when in competition compared to when they are alone
They also found out that the Green fish pushed out the blue and pumpkinseed fish from eating vegetation, so they ate at different areas of the water
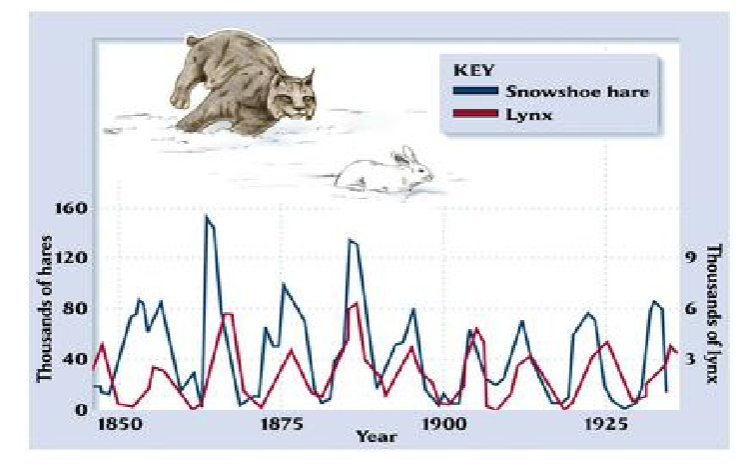
Lynx – snowshoe hares
Through history, you can see oscillations in both populations
Huffaker’s mites on oranges
First, he introduced the prey onto a single orange. Then a few days later, he would introduce the predator. The predator would rapidly eat all the prey.
He manipulated the experiment until the oranges were spaced out and the environment had places for the prey to hide and go to then this caused oscillations
factors that affect dispersal or habitat patchinesss may be critical for allowing coexistence
Oscillations
simple dynamics predict oscillations (may or may not be stable) such as stable, damped and increasing oscillations
Epidemiology
the branch of medicine which deals with the incidence, distribution, and control of diseases and other factors relating to health
Vertical transmission
mother to offspring
horizontal Transmisson
can be direct (colds, STDs) or indirect that involved animal transmission between humans (malaria, rabies, Lyme disease)
Assumptions of the basic predator-prey equations
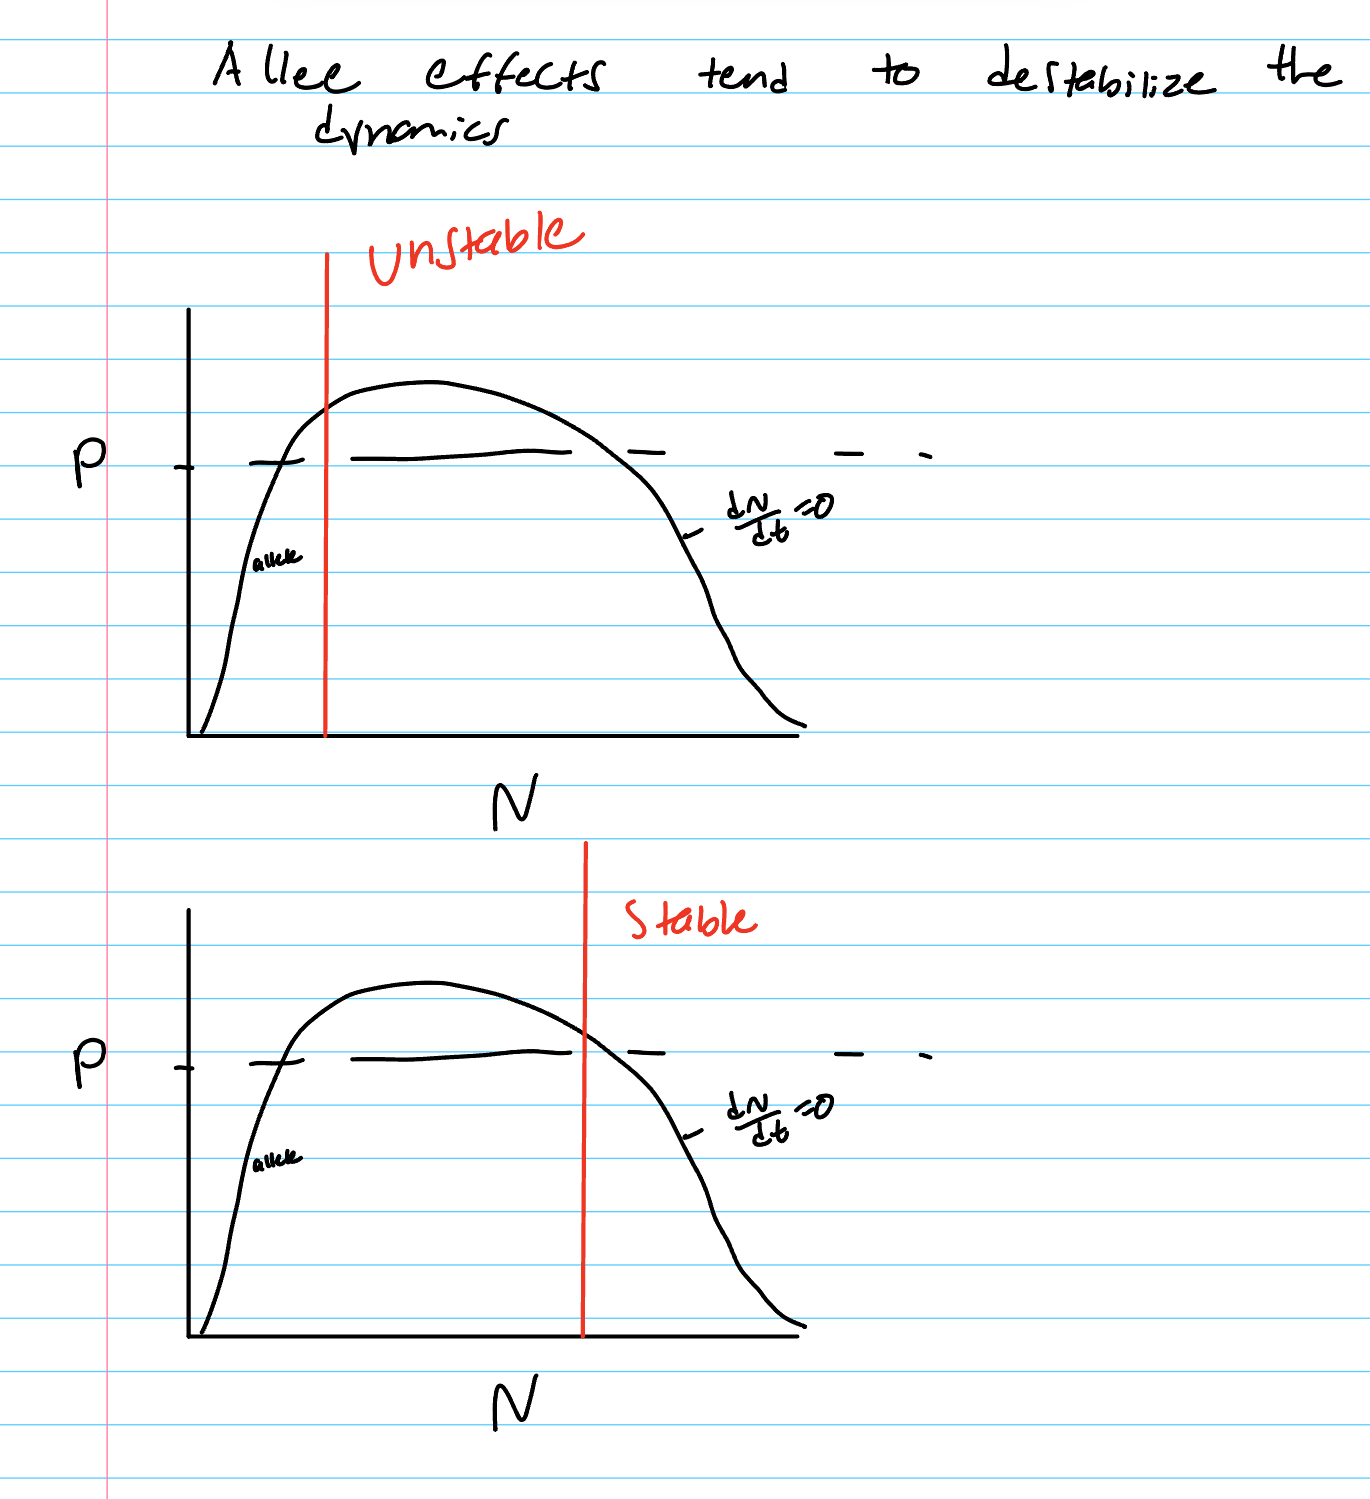
Rosenzweig-MacArthur variation (adding competition and Allee effects)
Allee effect at low densities tends to destabilize.
Intraspecific competition at high densities stabilize.
Rule of thumb about stability: shift in a clockwise direction of either isocline stabilizes, while counter-clockwise destabilizes.
Effects of intraspecific competition in predators on stability of predator-prey
Intraspecific competition in the predator also tends to stabilize predator-prey dynamics
Effects of refuges or migration of prey on stability of predator-prey
Migration or prey refuges tend to stabilize predator-prey dynamics
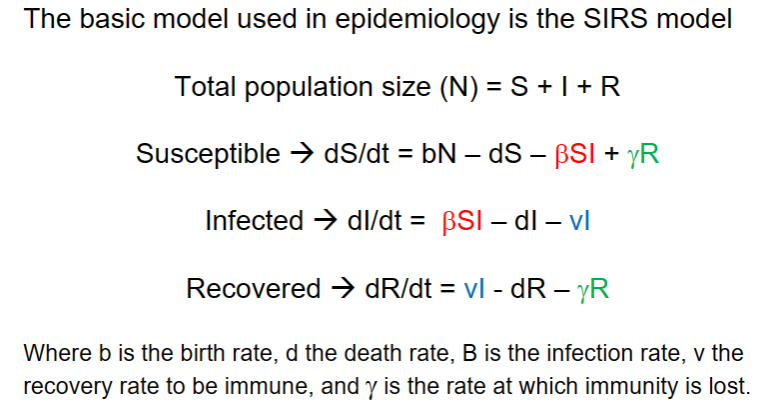
SIRS models
(susceptible, infected, or recovered – see upcoming examples) In this case, the abundance of the parasite (measles) in the host is ignored and instead we use is the number of infected people (like a metapopulation model
Protozoa with migration
More oscillations were made due to migration of prey into the population
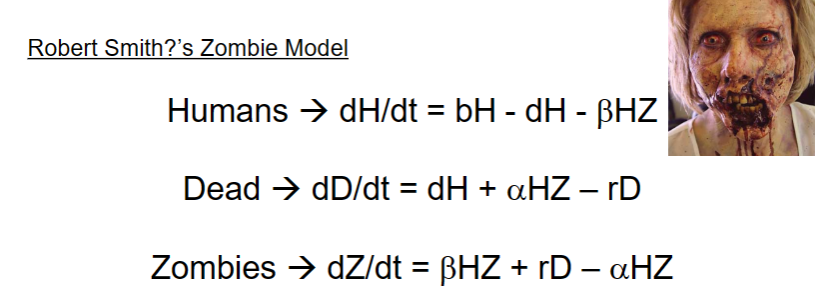
Zombies!
just be able to make similar equations where they are three different populations
For humans : bH is the growth rate of humans subtracting the death rate and the rate of which humans turn into zombies
For dead: the rate of humans dying and the rate of zombies dying minus the rate of the dead turning into zombies
For zombies: rate of which humans turn into zombies plus the rate of the dead turning into zombies minus the rate of zombies dying
Functional response
the relationship between food (prey) density and the predator’s consumption rate
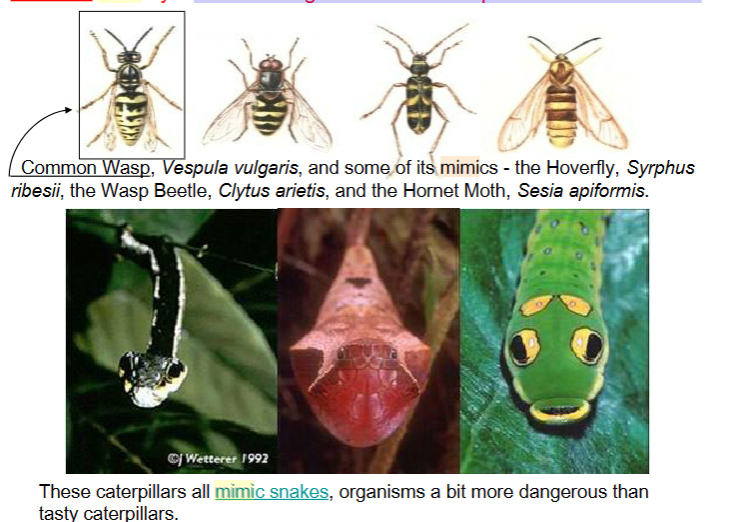
Batesian mimicry
harmless organisms resemble poisonous or distasteful
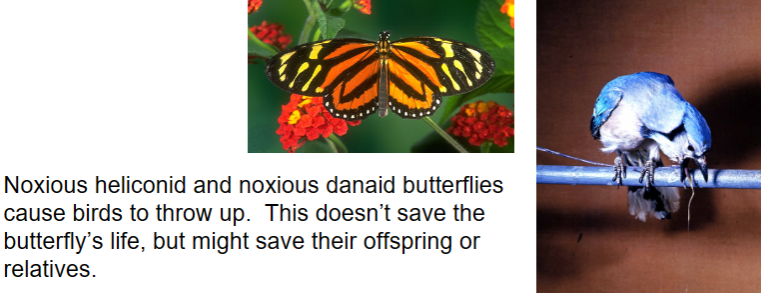
Mullerian mimicry
poisonous resemble poisonous
myxomatosis
the virus that was purposely unleashed on the rabbit population in Australia
Effects of predators on prey behavior and evolution
Causes evolution such as the mimicries or changes the behavior of the prey to hid and be aware of their surroundings
Effects of prey numbers on predator behavior
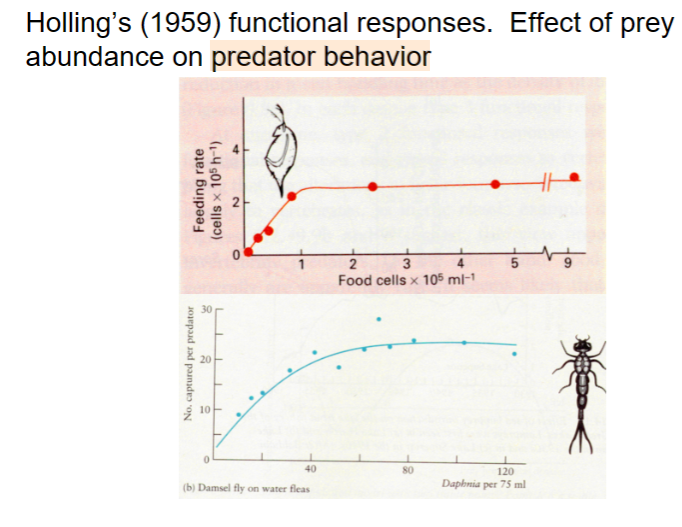
Types of functional response curves
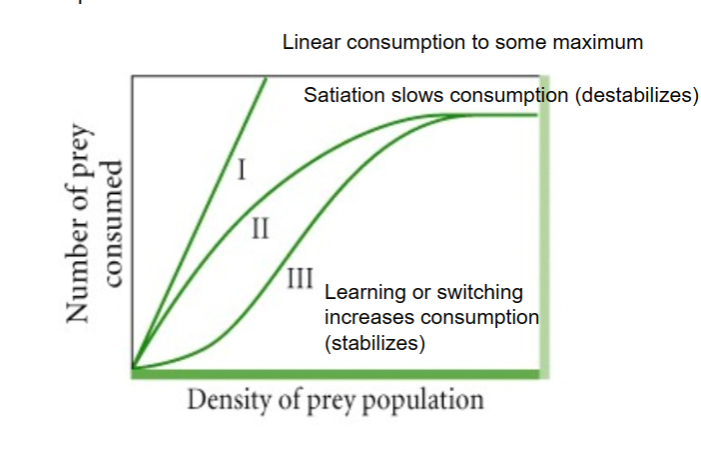
Type I response curve
linear increase in prey taken until maximum is reached. Maximum is set by some minimum handling time per prey. handling time is the time required to capture, subdue, and consume an individual prey item.
Type II response curve
caused by satiation, predator gradually slows down. First obtained by Holling with blindfolded secretaries choosing sandpaper discs