Equity 2: Security Indexes, Market Efficiency and Company Analysis

0.0(0)
Studied by 0 people
call kaiCall Kai
Locked
learnLearn
examPractice Test
spaced repetitionSpaced Repetition
heart puzzleMatch
flashcardsFlashcards
GameKnowt Play
Card Sorting

1/35

encourage image

There's no tags or description

Looks like no tags are added yet.

Last updated 5:47 PM on 9/14/26
Name
Mastery
Learn
Test
Matching
Spaced
Call with Kai
Chat

No analytics yet

Send a link to your students to track their progress

36 Terms

1
New cards

Price return index vs. total return index, and the price return index formula

A price return index (price index) reflects only the prices of its constituent securities. A total return index also reflects reinvestment of all income (dividends/interest) received since inception. Both start at the same value at inception, but the total return index's value grows to exceed the price return index's over time. Value of a price return index: V(PRI) = [sum of (units held × price) across constituent securities] ÷ divisor.

<p><span>A price return index (price index) reflects only the prices of its constituent securities. A total return index also reflects reinvestment of all income (dividends/interest) received since inception. Both start at the same value at inception, but the total return index's value grows to exceed the price return index's over time. Value of a price return index: V(PRI) = [sum of (units held × price) across constituent securities] ÷ divisor.</span></p>
2
New cards

Total Return of Index Portfolio

knowt flashcard image
3
New cards

Index Value Return over Multiple Periods

Standard multiple holding period return formulas with a slight adjustment of multiplying by value of index at inception to get index value from HPR
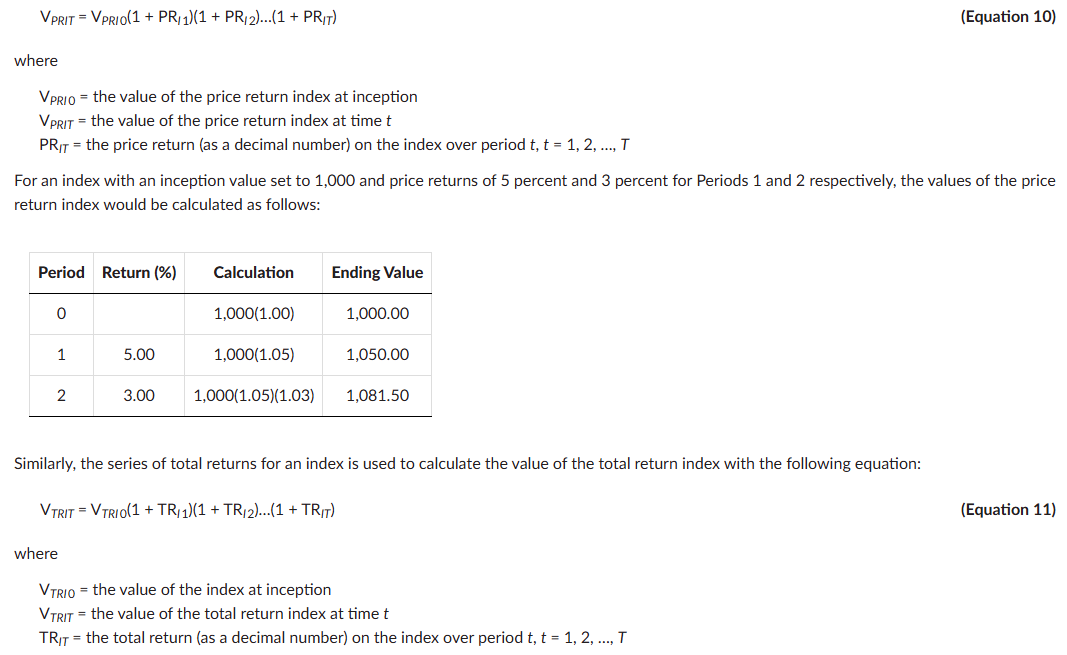
<p>Standard multiple holding period return formulas with a slight adjustment of multiplying by value of index at inception to get index value from HPR </p>
4
New cards

Index Price Weighting for Securities in the Index

knowt flashcard image
5
New cards

Index Equal Weighting for Securities

knowt flashcard image
6
New cards

Market Capitalisation Weighting to Form Indexes

knowt flashcard image
7
New cards

Float Market Cap Index Weighting

Uses how many shares are floating as a weighting
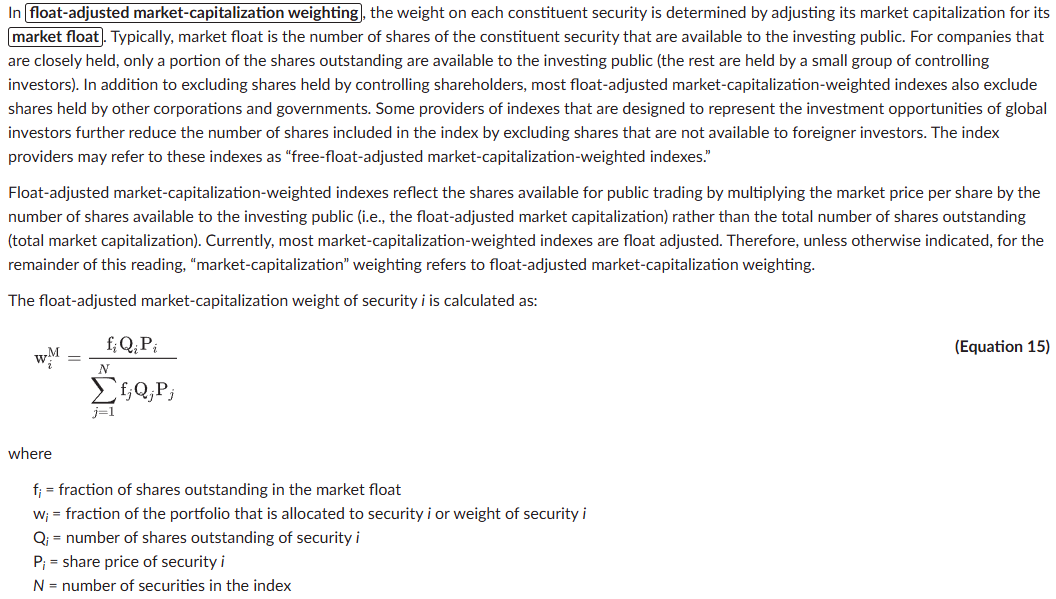
<p>Uses how many shares are floating as a weighting </p>
8
New cards

Fundemental Index Weighting

knowt flashcard image
9
New cards

Efficient Markets - Passive vs Active Investing

Markets fully incorporating information into pricing, passive investing e.g. holding bonds can be preferred to active due to reduced costs in a market where potential profit exploitation from inefficiencies is lower
10
New cards
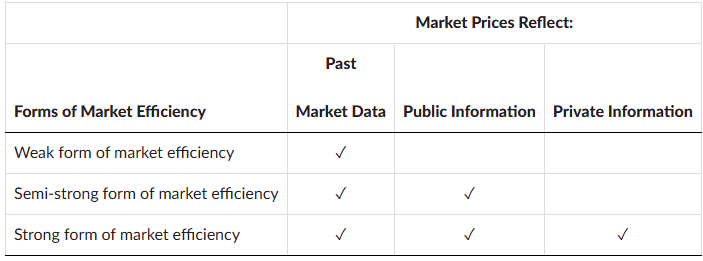
Weak, semi-strong, and strong forms of market efficiency
Weak-form: prices fully reflect all past market data (historical prices/volume), so past-price patterns can't predict future prices — tested via serial correlation in returns or profitability of technical analysis trading rules. Semi-strong-form: prices fully reflect all publicly available information (financial statement and market data), so analyzing public information can't produce abnormal returns — tested via event studies of investor reaction to information releases. Strong-form: prices fully reflect all public and private information, so even insiders can't earn abnormal returns from private information — tested via whether trading on nonpublic information earns abnormal profits. Each higher form encompasses the ones below it (semi-strong implies weak; strong implies both).
11
New cards

Efficient markets — fundamental analysis, technical analysis, and portfolio management

Fundamental analysis (estimating intrinsic value from company/industry/economic data) is still useful even in a semi-strong efficient market, since it's the process that gets value-relevant information reflected into prices in the first place, and can be profitable if an analyst has a genuine informational/analytical advantage. Technical analysis (trading on price/volume patterns) helps markets stay weak-form efficient by detecting and arbitraging away price patterns, but this same process means any exploitable pattern tends to disappear once enough participants act on it, so consistent abnormal returns from technical analysis aren't sustainable. Because markets are broadly weak- and semi-strong-form efficient, active management is unlikely to consistently beat the market — mutual funds on average roughly match the market before fees and underperform after fees/expenses — so passive management tends to outperform net of costs. A portfolio manager's real value isn't beating the market, but building and managing a portfolio that fits the client's objectives, diversification, asset allocation, risk tolerance, and tax situation.

12
New cards
Market anomalies and data mining
A market anomaly is a price change not directly linked to current or newly released relevant information; to count as real evidence against efficiency, it must be consistent over reasonably long periods. Data mining (data snooping) means developing a hypothesis by examining data first (rather than testing a hypothesis grounded in economic rationale), often trying different approaches until a "profitable" pattern turns up by chance — such patterns rarely persist, and even genuine anomalies are often hard to exploit profitably after risk and trading costs.
13
New cards
Calendar anomalies
January effect (turn-of-the-year / small-firm-in-January effect): abnormally high returns in early January, especially for small caps — partly explained by tax-loss selling (December selling of losers, rebought in January) and window dressing (managers selling riskier holdings before year-end reporting), though recent evidence says it isn't persistent or a real risk-adjusted anomaly. Other calendar effects, most since eliminated: turn-of-the-month (higher returns around month-end/start), day-of-the-week (negative average Monday returns vs. positive other days), weekend effect (weekend returns lower than weekday), holiday effect (higher returns the day before a holiday).
14
New cards
Momentum and overreaction anomalies
Overreaction effect (DeBondt & Thaler): investors overreact to news, inflating/depressing prices for good/bad news; buying prior "losers" and selling prior "winners" (by 3-5 year total return) showed losers later outperforming and winners underperforming. Separately, momentum — high short-term returns tend to persist into subsequent periods — directly contradicts weak-form efficiency if it's tradeable for abnormal profit, though it may instead be rational: a short-lived serial correlation from prices adjusting to a shock in expected cash flow growth, not investor irrationality.
15
New cards
Cross-sectional anomalies — size and value effects
Size effect: small-cap stocks appeared to outperform large-caps on a risk-adjusted basis, but this wasn't confirmed in later studies (possibly arbitraged away, or a chance result). Value effect: value stocks (low P/E, low market-to-book, high dividend yield) have outperformed growth stocks over long periods — if persistent, this contradicts semi-strong efficiency since the sorting data is public. Fama-French's three-factor model adds size and a value (book-to-market) factor to CAPM's market factor; using it instead of CAPM makes the value anomaly disappear, suggesting it was compensation for risk rather than true inefficiency.
16
New cards
Closed-end fund discount
Closed-end funds (fixed shares, exchange-traded) tend to trade at a discount to NAV (typically 4-10%) rather than at NAV, despite the arbitrage opportunity a discount implies. Proposed explanations — management fees, tax liabilities on pre-purchase unrealized gains, illiquidity/NAV errors — each explain only part of it. Not exploitable in practice: buying all shares and liquidating would incur transaction costs that erase the profit, and discounts tend to revert to zero over time anyway.
17
New cards
Earnings surprise and post-earnings-announcement drift
Earnings surprise = the unanticipated part of an earnings announcement; EMH says price should adjust rapidly and appropriately to it. Evidence shows a real adjustment happens before/at the announcement, but drift continues afterward — so stocks with the largest positive surprises later outperform, and those with the largest negative surprises later underperform, implying investors could profit from public information alone. But this apparent abnormal return may be an artifact of studies that don't fully control for transaction costs and risk.
18
New cards
IPO underpricing
IPOs are, on average, underpriced: the issue price is set too low and jumps on the first trading day (the % gap is the degree of underpricing) — so investors who buy at the offering price can earn abnormal profits, though not always (some IPOs are overpriced and drop instead). Investors buying after the IPO can't earn abnormal profits, since prices adjust quickly to true value (supporting semi-strong efficiency). Long-term IPO performance is generally below average, suggesting the market is initially overly optimistic (overreacts) — though some researchers attribute the apparent anomaly to a methodology artifact (equally weighting small IPO samples).
19
New cards
Predictability from prior information, and anomaly implications overall
Returns do relate to prior information like interest rates, inflation, and dividend yields, but this reflects economic fundamentals, not inefficiency, and the relationships aren't stable over time (e.g. the dividend-yield relationship has flipped sign across periods) — so such patterns can't be traded consistently. Overall, most anomalies turn out to be artifacts of the statistical methods used to find them, and in efficient markets overreactions and underreactions both occur and roughly offset — so anomalies are hard to translate into real profit, especially without a compelling economic rationale behind the pattern.
20
New cards
Common vs. preference shares
Common shares: ownership interest, share in operating performance, voting rights, residual claim on assets in liquidation, dividends not contractually required. Voting: statutory voting (one vote per share per candidate) vs. cumulative voting (total votes = shares × directors being elected, can be concentrated on one candidate), which gives small shareholders more board representation. Preference shares: rank above common for dividends and liquidation, generally no voting rights, fixed dividend (higher than common's, but not contractually obligated like debt interest), can be perpetual and callable/putable. Cumulative preference: unpaid dividends accrue and must be paid before common dividends. Non-cumulative: unpaid dividends are forfeited, but common still can't be paid unless the current preferred dividend is paid first. Participating preference: standard dividend plus a share of profits above a threshold (and possibly extra liquidation proceeds) — more common for smaller, riskier companies. Non-participating: fixed dividend and par value only. Convertible preference: convertible into a set number of common shares, giving a higher/more stable dividend than common plus upside participation — popular in venture capital/private equity financing.
21
New cards
Direct investing vs. depository receipts/GRS
Buying foreign shares directly means transactions are in the foreign currency, plus unfamiliar trading/settlement rules and often less transparency/liquidity. Depository receipts and global registered shares instead trade on local exchanges in local currency, avoiding currency conversion, unfamiliar market practices, and accounting-standard differences.
22
New cards
Depository receipts (DRs) — sponsored vs. unsponsored
A DR trades like an ordinary share on a local exchange, representing an economic interest in a foreign company whose shares are deposited with a depository bank, which issues receipts (at a set ratio to underlying shares) and handles dividends, taxable events, splits, and transfer-agent duties. Sponsored DR: foreign company is directly involved in issuance; investors get the same rights (voting, dividends) as direct shareholders; subject to greater reporting requirements. Unsponsored DR: no involvement from the foreign company; the depository buys shares itself and issues receipts; the depository (not investors) keeps voting rights.
23
New cards
Global depository receipts (GDRs) vs. American depository receipts (ADRs)
GDR: issued outside the company's home country and outside the US; avoids home-country foreign-ownership/capital-flow restrictions; mostly USD-denominated; cannot be listed on US exchanges (but can be privately placed with US institutions). ADR: USD-denominated, trades like a common share on US exchanges; an ADR is one form of GDR, but not all GDRs are ADRs. An American depository share (ADS) is the underlying share the ADR (the traded certificate) represents.
24
New cards
ADR types
Level I (unlisted): OTC trading, no full SEC registration, can't raise capital. Level II (listed): trades on NYSE/NASDAQ/AMEX, requires SEC registration, can't raise capital. Level III (listed): trades on NYSE/NASDAQ/AMEX, full SEC registration, CAN raise capital via public offering. Rule 144A/Reg S (unlisted): no SEC registration, privately placed with qualified institutional buyers or offshore non-US investors.
25
New cards
Global registered shares (GRS) and BLDRs
A GRS is a common share traded on multiple exchanges worldwide in different currencies, with no currency conversion needed to trade it — more flexible than a DR since it's an actual ownership interest tradeable anywhere. A BLDR is an ETF holding a portfolio of depository receipts, designed to track an underlying DR index, and trades/behaves like any other ETF (intraday trading, short selling, margin, hedging/arbitrage use).
26
New cards
itial vs. subsequent company research reports
Initial ("initiating coverage") report: an extensive report issued when an analyst begins covering a security, aimed at an audience not yet knowledgeable about the issuer/security — includes front matter, recommendation, company description, industry/competitive positioning, financial analysis and model, valuation, ESG considerations, and risks. Subsequent report: shorter, aimed at readers already familiar with the issuer, issued to update on new information/analysis or a recommendation change (e.g. after quarterly results) — covers front matter, recommendation (with a summary of any changes), analysis of new information (actual vs. expected results, updated forecasts), valuation (with changes from the prior report), and updated risks. Report structure, content, and tone in general depend on the analyst's setting (e.g. external "sell-side" distribution vs. internal-only, which can be much shorter/verbal).
27
New cards
Business model elements and key questions
Analysts determine a company's business model by answering: What is the firm selling? (products/services); To whom does it sell? (customers/key customer groups); How does it reach and deliver to customers? (sales channels/acquisition/delivery); How much does it charge and how are payments structured? (pricing); What does it buy and rely on to operate? (resource/supplier/partner relationships). Determining the business model is the first step in company analysis — it highlights key drivers and what needs further investigation, and is usually the first part of a research report.
28
New cards
Bottom-up vs. top-down revenue analysis
Bottom-up: decomposes revenue into drivers like sales volume and price, or by product line/segment/geography. Top-down: expresses revenue as Market size × Market share (plus GDP growth); market size = existing demand for the company's goods/services, market share = company revenue as % of market size, and (100% − market share) = sales potential. The two approaches are often used together.
29
New cards
Highly competitive markets
Attributes: little/no product differentiation, low barriers to entry, available substitutes, low customer loyalty, low switching costs. Firms are price takers (price set by supply/demand; pricing above market loses sales, pricing below sparks price wars), and returns on capital trend toward the cost of capital long-run. A low-cost producer (costs below a marginal producer) can still earn above-cost-of-capital returns if that cost position is sustained. Commoditization is the process by which a market becomes more competitive over time as new firms enter, innovation slows, and imitation becomes widespread.
30
New cards
Pricing power (less competitive markets)
A company's ability to set prices/terms without materially affecting sales volumes; found in monopolistic competition, oligopoly, and monopoly structures with attributes like product differentiation, entry barriers, lack of substitutes, switching costs, and high customer loyalty. Best evidenced by rising profitability (margins) over time — not just rising prices — since a firm without pricing power can't pass cost increases on to customers.
31
New cards
Operating profit (fixed/variable cost model)
Operating profit = [Q × (P − VC)] − FC. Q = units sold, P = price per unit, VC = variable cost per unit, FC = total fixed operating costs (a dollar amount, not per unit). (P − VC) is the contribution margin, which must be positive with Q high enough to exceed FC for the firm to be profitable.
32
New cards
Degree of operating leverage (DOL)
DOL = %Δ Operating Profit / %Δ Sales. Measures how much operating profit swings (up or down) for a given % change in sales; a firm raises its DOL by increasing fixed costs and decreasing variable costs in its cost base.
33
New cards
Functional profitability measures
Gross Profit = Revenue − Cost of Sales (Gross Margin = Gross Profit/Revenue, ≈ contribution margin since cost of sales is largely variable). EBITDA = Gross Profit − Operating Expenses (SG&A, R&D, etc.) (EBITDA Margin = EBITDA/Revenue). Operating Profit/EBIT = EBITDA − D&A (Operating Margin = EBIT/Revenue). Other opex is largely fixed; D&A is fixed unless a units-of-output depreciation method is used.
34
New cards
Economies of scale vs. economies of scope
Economies of scale: cost per unit declines as output grows, mainly from spreading fixed costs (or gaining supplier bargaining power) over more units — check empirically via opex as % of sales/margins vs. company size. Economies of scope: cost per unit declines as the number of product/business lines grows, from shared costs across lines — check empirically by comparing an integrated company's profitability to a standalone company's (common in financial services).
35
New cards
Working capital measures
Primary measures are activity ratios driving the cash conversion cycle (CCC), and net working capital to sales. CCC is the number of days cash is tied up in operations, from paying for inventory to collecting cash from its sale, net of how long the company delays paying its own suppliers. A short CCC means less external financing is needed to fund operations. Net working capital requirements set a minimum investment level that can't be distributed to investors. Negative net working capital means suppliers are a source of financing.
36
New cards
Degree of financial leverage (DFL)
DFL = %Δ Net Income / %Δ Operating Income. Rises with higher interest expense that is fixed relative to operating income; analogous to degree of operating leverage (DOL), but driven by fixed financing costs rather than fixed operating costs.



