economics module 3
1/68
There's no tags or description
Looks like no tags are added yet.
Name | Mastery | Learn | Test | Matching | Spaced |
|---|
No study sessions yet.
69 Terms
quota rent
the profit that arises when government sets quotas
progressive tax
high income payers pay a larger percent of their income than lower income than lower income tax payers
regressive tax
a tax that rises less than in proportion to income, high income pays less than low income
proportional tax
all tax payers pay the same tax percentage
excise tax
tax charged on each unit of good or service that is sold
tax incidence
a measure of who really pays a tax
tax wedge
size of tax
total tax revenue
total revenue from a tax
administrative costs
resources used by the government to collect the tax
lump-sum tax
a tax that is the same for everyone, example, a poll tax
domestic demand curve
shows how the quantity of a good demanded by residents of a country depend on the price of that good
domestic supply curve
shows how the quantity of a good supplied by producers inside a country depends on the price of that good
world price
fixed price abroad
imports
a product or service that is produced in one country and purchased in another
exports
goods and services made in one country and sold to buyers in a different country
exporting industries
firms that produce goods and services sold abroad
import-competing industries
produces goods and services that are also imported from abroad
free trade
government does not regulate exports and imports that occur naturally
trade protection
policies that limit imports to protect domestic producers from foreign competitors
tariff
a form of excise tax only levied on sales of imported goods
effects of tariff
1.raises domestic price
2.increases producer surplus
3.reduces consumer surplus
4.tariff yields revenue to government
import quota
the legal limit on the quantity of a good that can be imported
offshore outsourcing
business hire people in another country to perform various tasks
autarky
when countries don’t trade
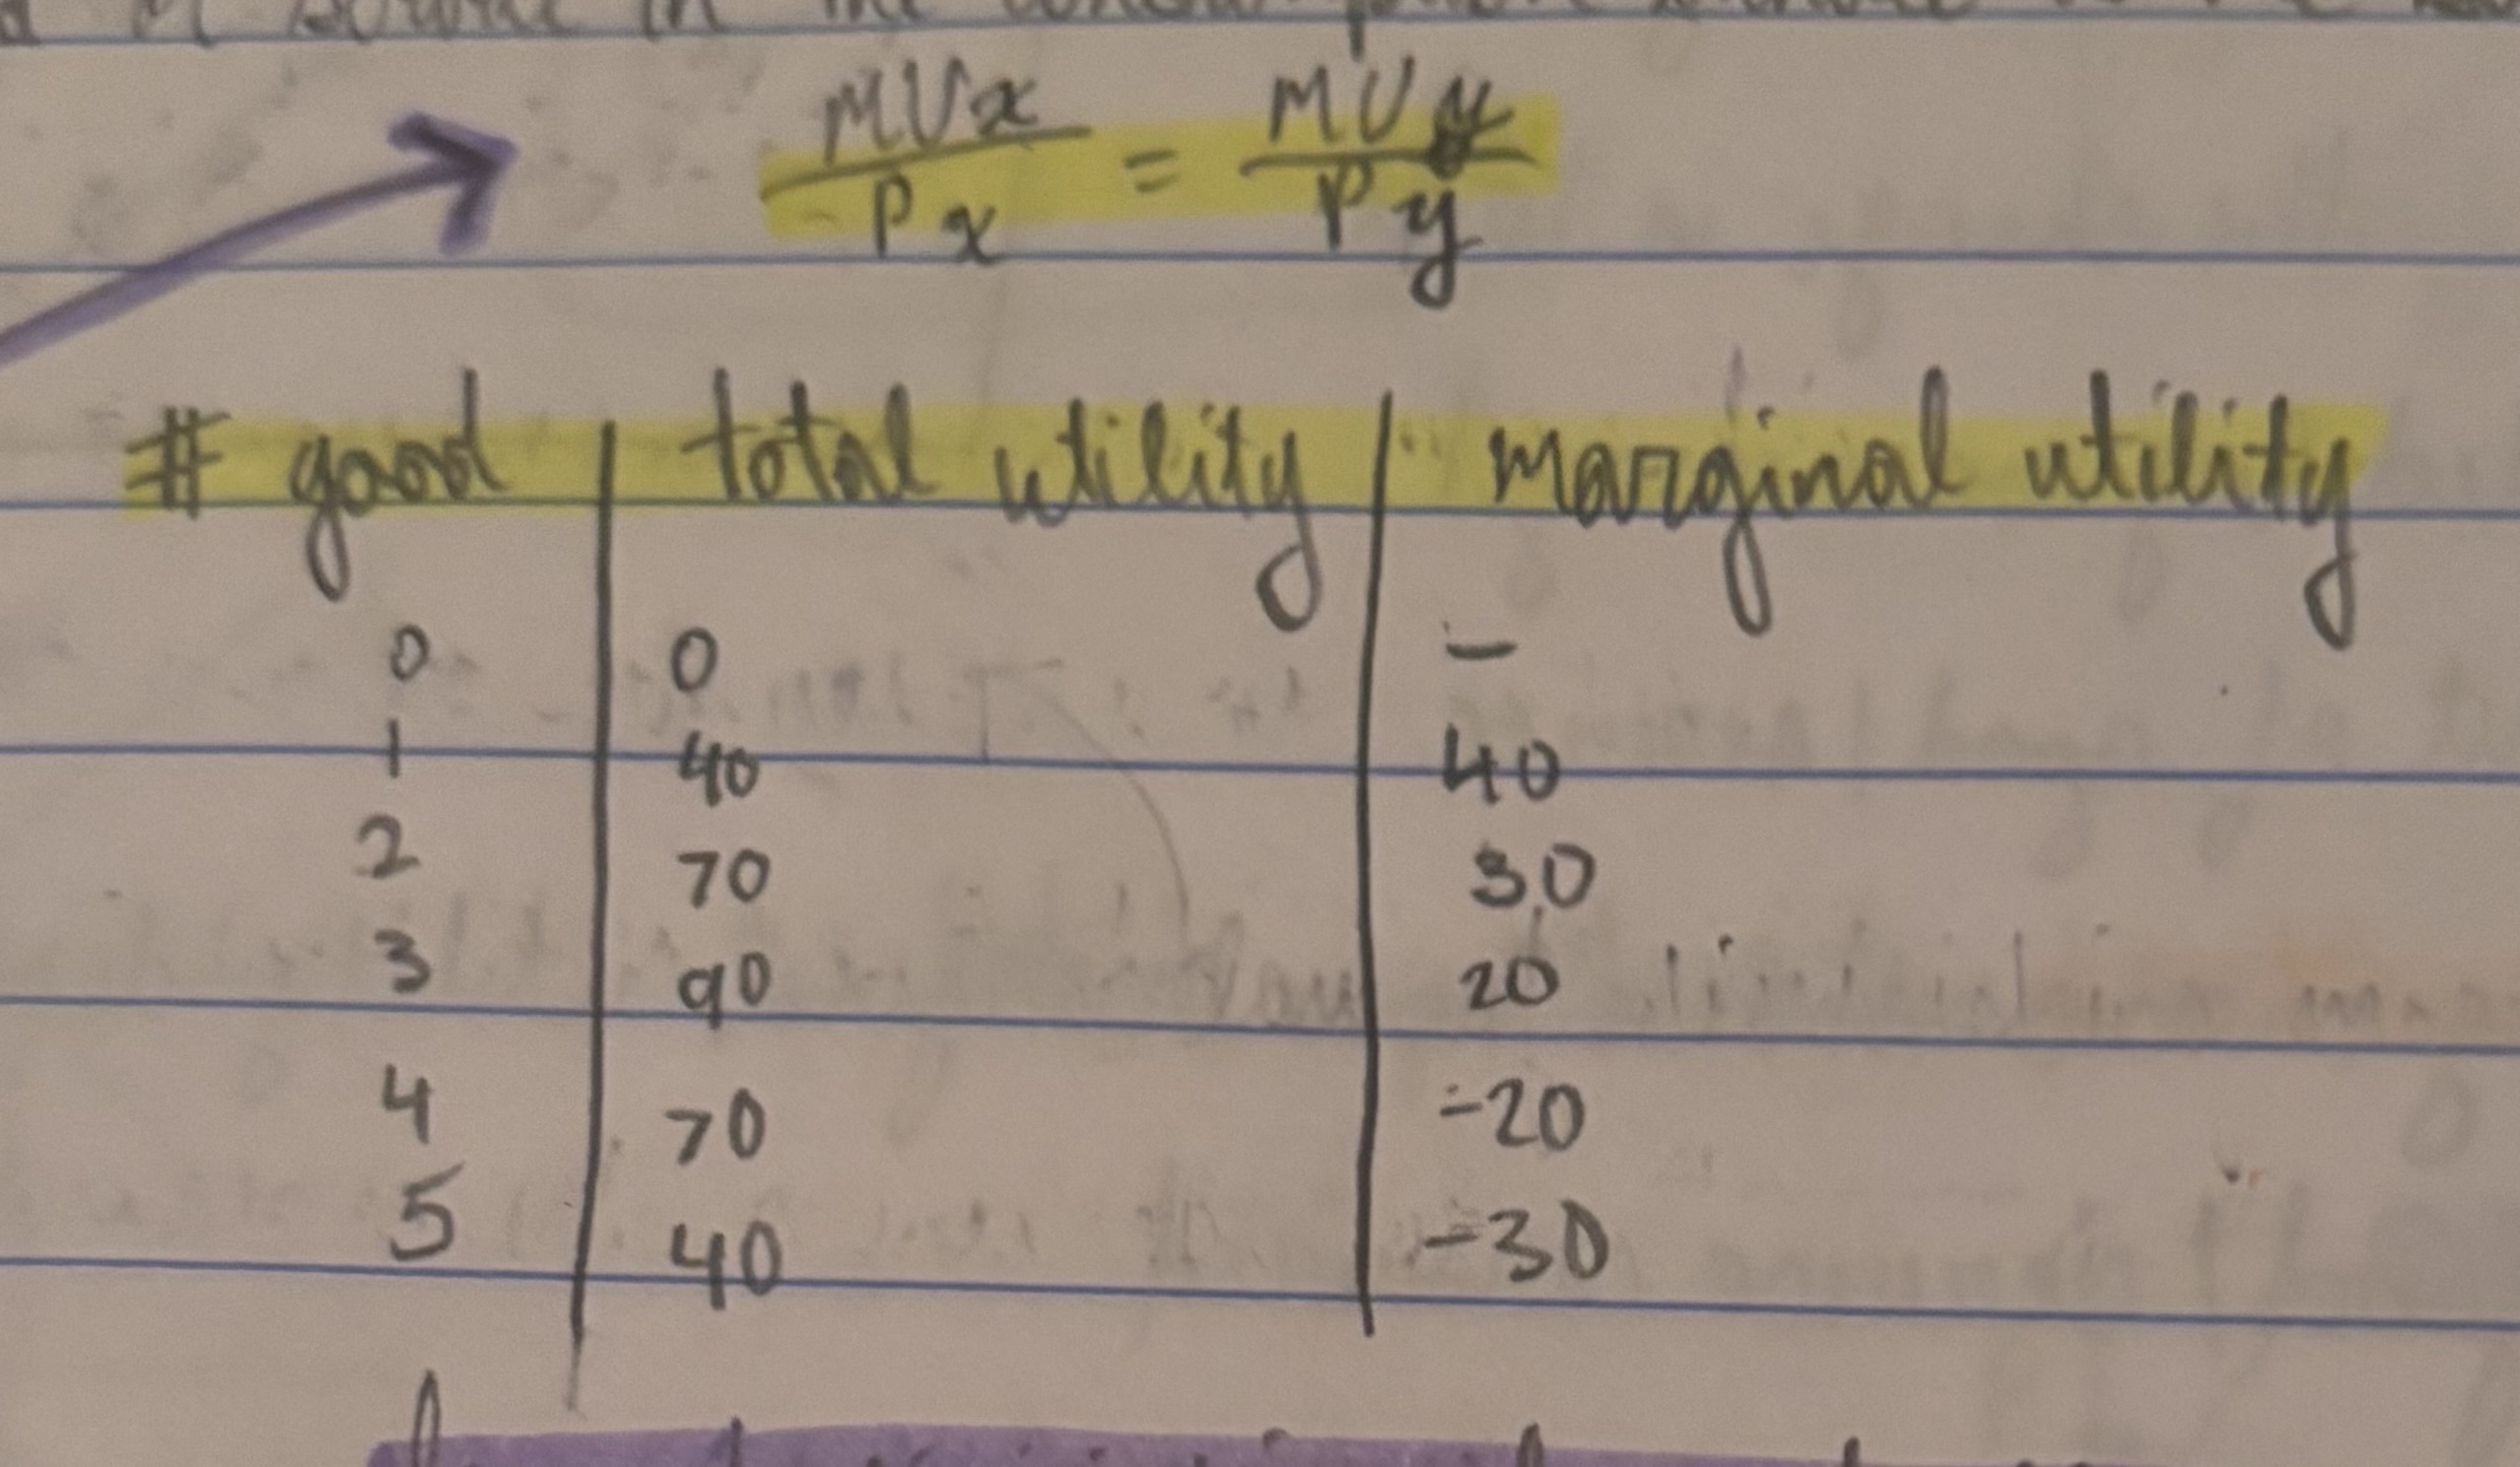
utility
measure of satisfaction from consumption
utils
hypothetical units to measure utility
marginal utility
the change in total utility generated by consuming 1 additional unit of good/service
marginal utility curve
shows how marginal utility depend on the quantity of a good/service consumed
principle of diminishing marginal utility
each successive unity of a good or service consumed adds less to total utility than does the previous unit
budget constraint
consumers must choose a consumption bundle that costs no more than his or her income
consumption possibilities
the set of all of the affordable consumption bundles
budget line
the downward sloping line
optimal consumption bundle
maximizes total utility
marginal utility per dollar
spent on a good or service is the additional utility from spending one more dollar on that good or service,
MU good/P good
optimal consumption rule
when a consumer maximizes utility in the face of a budget constraint, the marginal utility per dollar spent on each good or service in the consumption bundle is the same
production function
the quantity of output a firm produces depends on the quantity of inputs
fixed input
an input whose quantity is fixed for a period of time and can’t be varied
variable input
an input whose quantity the firm can vary at any time
long run
the time period in while all inputs can be varied
short run
the time period in which 1 input is fixed
total product curve
shows how the quantity of output depends on the quantity of variable input, for a given quantity of the fixed input
marginal product
an input is the additional quantity of output produced by using 1 more unit of that input
diminishing returns to an input
when an increase of quantity holding the levels of all other inputs fixed, leads to a decline in the marginal product of that input
marginal product of labor
change in quantity of output/change in quantity of labor
long run average total cost curve
shows the relationship between output and average total cost when fixed cost has been chosen to minimize average total cost for each level of output
increasing returns to scale
when long run average total cost declines as output increases
decreasing returns to scale
when lobbying average total cost increases as output increases
constant returns to scale
when long run average total cost is constant as output increases
long run average total cost
combination of the short run cost curves, creates a :)
diseconomy of scale
caused by no coordination and communication
economies of scale
caused by specialization and set up costs in larger companies
sunk cost
money that is lost, doesn’t affect future decisions
explicit costs
outlay of money
implicit costs
benefits forgone, opportunity cost
total oppurtunity cost
total explicit cost + total implicit cost
accounting profit
revenue - explicit cost
economic profit
revenue - oppurtunity cost
optimal quantity
MR = MC, MR is change in revenue created by another unity of profit
4 market structures
perfect competition
monopoly
oligopoly
monopolistic competition
marginal revenue
the change in the total revenue generated by an additional unit of output, change in total revenue/ change in quantity of output
optimal output rule
says that profit is maximized by producing the quantity of output at which the marginal revenue of the last unity produced is equal to its marginal cost
price taking firm’s optimal output rule
a price taking firms profit is maximized by producing the quantity of output at which the market price is equal to the marginal cost of the last unit produced
marginal revenue curve
shows how the marginal revenue varies as output varies
break even price
the market price at which it earns zero economic profit
shut down price
the price at which a firm ceases production, equal to minimum average variable cost
profit equation
TR-TC=(TR/Q-TC/Q)Q
profit/q
TR/Q-TC/Q, TR/Q is average revenue and TC/Q is average total cost
public ownership
the good is supplied by the government or by a firm owned by the government
price regulation
limits the price a monopoly is allowed to charge