geos2: population patterns and processes
1/27
Earn XP
Description and Tags
Name | Mastery | Learn | Test | Matching | Spaced |
|---|
No study sessions yet.
28 Terms
demography
the statistical study of human populations: number of people; their characteristics; their geographic distribution; past trends and future projections
pessimist perspective
population growth is bad for the environment
earth is nearing it’s capacity in terms of supporting the human population
the earth’s regenerative capacity can not keep up with the human population
"population growth is the single most significant threat to the natural environment, indeed to the future of life on Earth" (Paul Ehrlich)
"we (Australia) should reduce its population to its ecological carrying capacity of around 6-10 million" (Tim Flannery)
optimist perspective
we will also find a solution to curb the challenges associated with resource scarcity
more people on earth equals more innovative minds to implement ways we can coexist with nature as a growing population
“population is a source of ingenuity that will resolve all problems. we have the technology to cater for an ever growing population, forever” (Julian Simon)
“Australia should aim for a population of around 50-60 million” (Malcom Fraser)
principle of population
exponential population growth will cause societal collapse
supplies are finite and grow at a slower rate than population growth
if population growth outstrips our supply chain famine, wars and epidemics can occur
[context] was written after the French Revolution; Malthus was concerned with rapid population growth among the lower echelons which could potentially threaten the balance of power in England
Malthusian trap
a point (on the graph) where the rate of population growth intersects and overtakes the rate of food production
how does a country accommodate population growth?
migration
industrialisation → increased production of food
imports → resources from other countries
myth
there is no association between population growth and economic growth
neo-malthusian
the idea that there was too rapid population growth in developing countries in the 1940s-60s
concerns about the environment
rapid population growth would be checked (positive) by the limits on finite resources (food, energy or water)
contraception was regarded as a preventative check
I = f (P, A, T)
the environmental impact equation:
I = environmental impact
p = population
a = affluence
t = technology
*sometimes written as I = f (P, C, T) where C = consumption
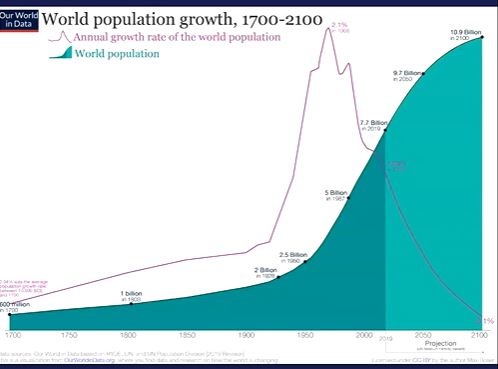
the graph reveals that population growth is slowing
fertility policies
fertility policies are usually unsuccessful because:
it is very difficult to make fertility levels to return to their prior levels
higher levels of education means people are partnering later in life
historically children were an economic asset; now children are a cost liability
the five stages of the demographic transition (dt)
a model that describes why rapid population growth is a temporary phenomenon
(dt) stage 1
birth rate: high
death rate: high
natural increase: stable or slow increase
(dt) stage 2
birth rate: high
death rate: falls rapidly
natural increase: rapid increase
(dt) stage 3
birth rate: falling
death rate: falls more slowly
natural increase: increase slows down
(dt) stage 4
birth rate: low
death rate: low
natural increase: falling and then stable
(dt) stage 5
birth rate: yet to be seen (possibly falling further or rising again)
death rate: low
natural increase: little change
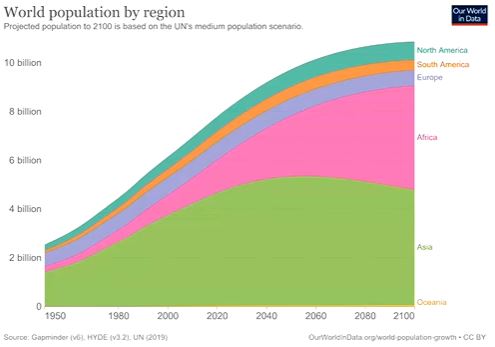
most population growth this century will occur in Africa
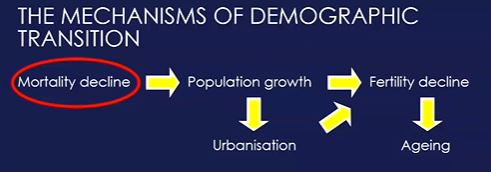
transition from a young, rural, fluctuating population through a period of rapid growth towards an old, urban population that is stable or in decline
Pt+n = Pt +(B-D)
the basic demographic equation:
Pt+n is population at time t plus n years
Pt is population at time t
B is births occurring between t and t + n
D is deaths occurring between t and t + n
*I represents gains from immigration, O represents losses through emigration
the crude death rate (CDR)
number of deaths per year divided by the population (per thousand population)
not great for comparative purposes
this figure does not take into account differences in age and how this alters to frequency of death in certain countries with an aging population
why do we have more deaths in developed countries?
developed countries have a higher proportion of older people who are most likely to die
infant mortality rate (IMR)
number of infant deaths per year divided by the population (per thousand population)
when mortality conditions decline , infant mortality goes down first
when hygiene becomes better children benefit the most because they are more prone to infectious diseases
thus, a good measure of where a country is situated in the demographic transition model
life expectancy at birth (LEB)
the average number of years a person can expect to live according to current mortality conditions
it can be reported for any ages
it is a figure often reported at birth (but can be reported at any age)
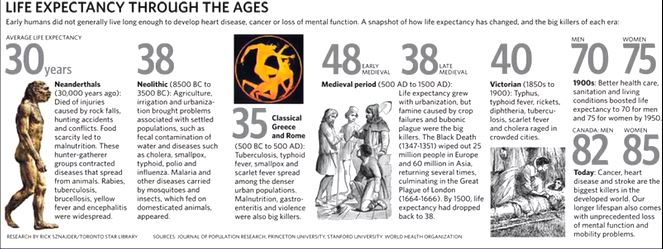
*note progress is not linear
(30 years) Neanderthals
food scarcity
hunting accidents
transition of disease from animals to humans
(38 years) Neolithic
life expectancy increased because people settled down and started agriculture
more secure food supply
causes of death started to change
as humans startled living together we see transition of diseases among humans (e.g. cholera)
(35 years) classical Greece and Rome
dense urbanisation
increased rate in the propagation of diseases amongst humans
this is an example of why progress is not linear (urbanisation does not necessarily mean better life expectancy)
violent conflict
(48-38) Medieval period
urbanisation
plague
crop failure
(80) post WW2
vaccines to protect against infectious diseases increased life expectancy
major pandemics and mortality events
1347 to 1351 Black Death
killed ~15% of global population (~30% of Europeans)
1845 to 1849 Irish potato famine
decline of ~25% of population
1918 to 1920 Influenza epidemic
killed ~30 million (~2% of global population)
on)