Brain and Behavior Exam #2 Diagrams
1/178
There's no tags or description
Looks like no tags are added yet.
Name | Mastery | Learn | Test | Matching | Spaced | Call with Kai |
|---|
No analytics yet
Send a link to your students to track their progress
179 Terms
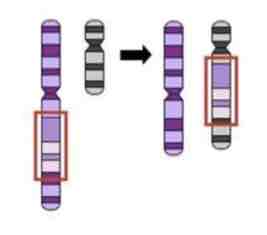
This Image shows a Diagram of a _________ Mutation
Duplication

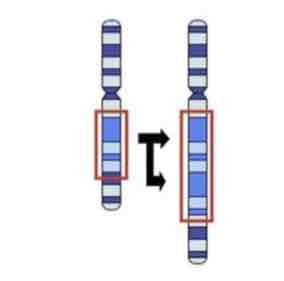
This Image shows a Diagram of a _________ Mutation
Inversion
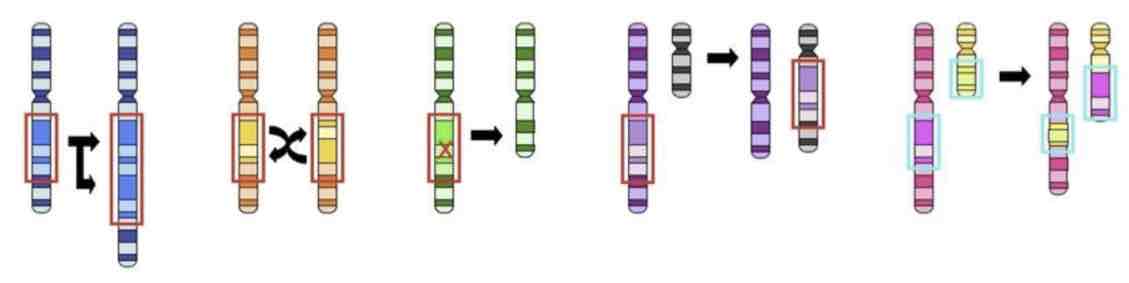
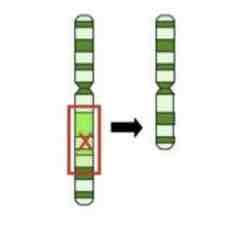
This Image shows a Diagram of a _________ Mutation
Deletion

This Image shows a Diagram of a _________ Mutation
Insertion

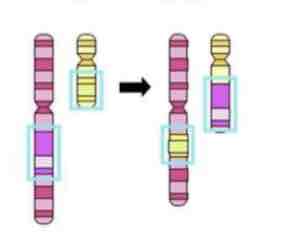
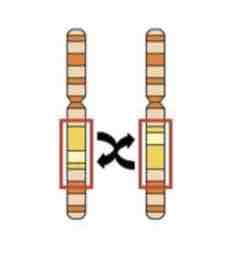
This Image shows a Diagram of a _________ Mutation
Translocation


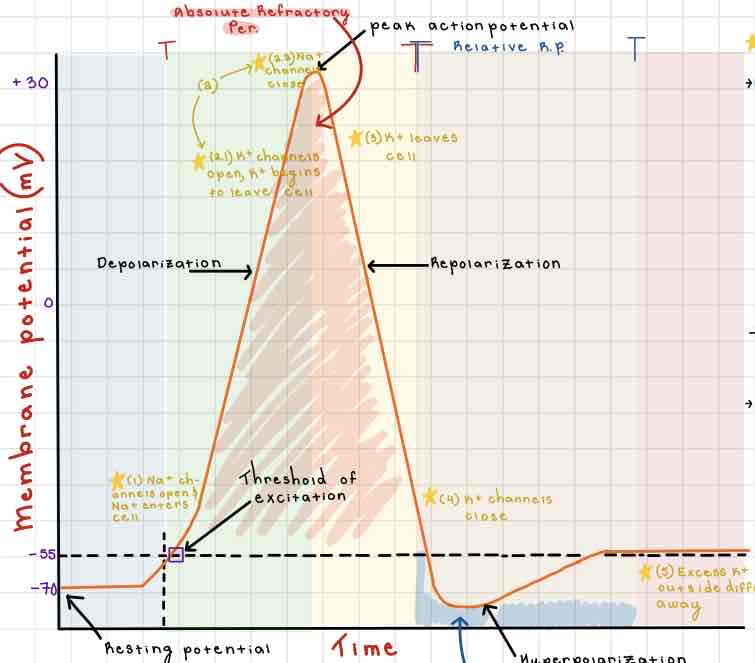
Area 1 of the Action Potential Diagram is _______
-70 (Resting State)


Area 2 of the Action Potential Diagram is _______
-55 (Threshold of Excitation)


Area 3 of the Action Potential Diagram is _______
0


Area 4 of the Action Potential Diagram is _______
40 (Action Potential)


Area 5 of the Action Potential Diagram is _______
Membrane Potential (mV), Y-Axis
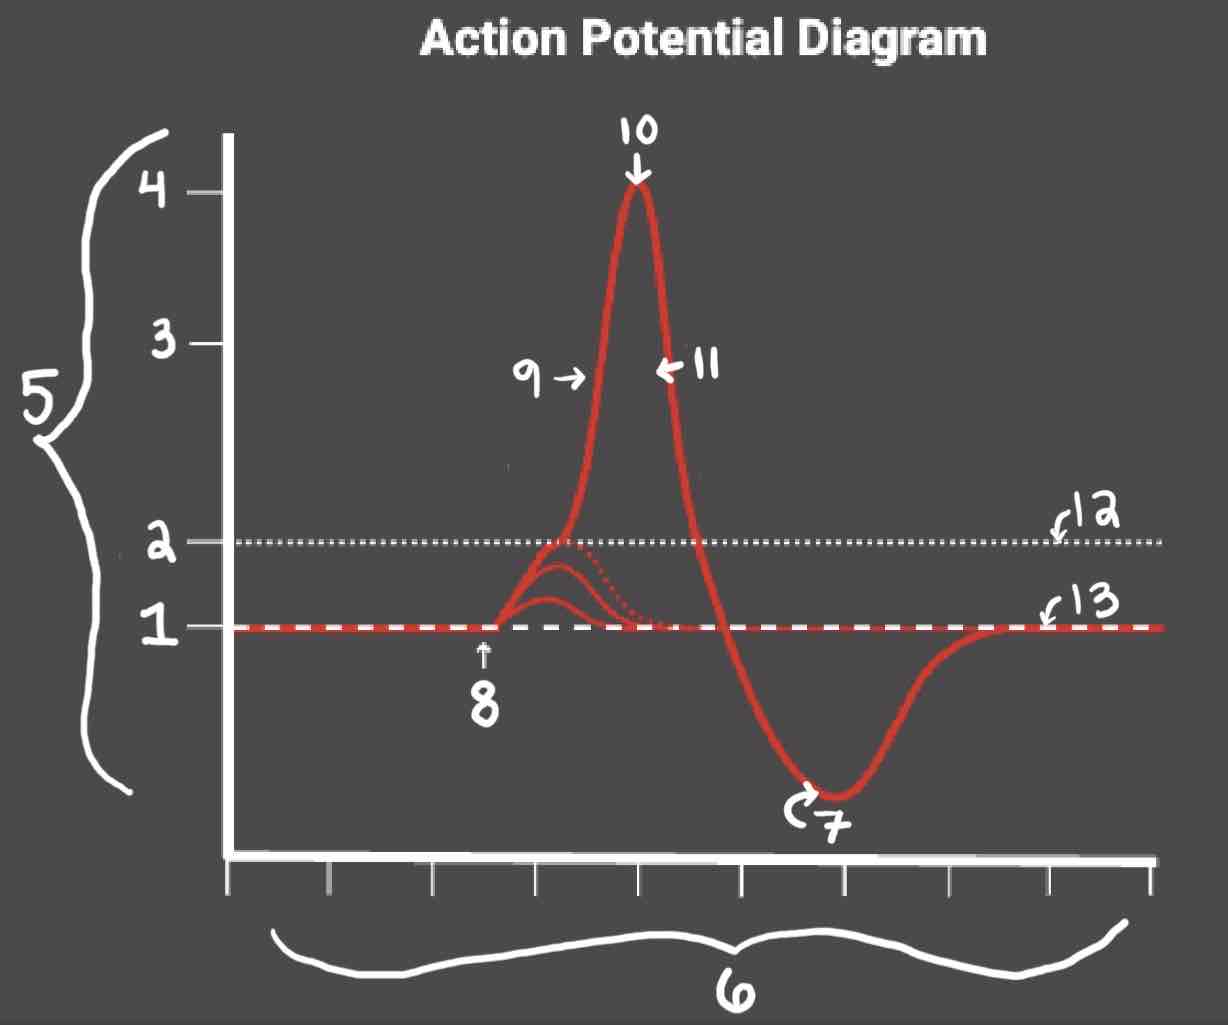

Area 6 of the Action Potential Diagram is _______
Time (ms), X-axis


Area 8 of the Action Potential Diagram is _______
Stimulus


Area 9 of the Action Potential Diagram is _______
Depolarization


During the Depolarization Phase, _______
- Voltage-gated sodium channels are opened
- Membrane potential becomes positive
- Sodium floods into the cell


Area 10 of the Action Potential Diagram is _______
Peak Action Potential


Area 11 of the Action Potential Diagram is _______
Repolarization


Area 12 of the Action Potential Diagram is _______
Threshold of Excitation


During the Repolarization Phase, _______
- (membrane gets between 0 and 40)
- Voltage gated potassium channels triggered
- Sodium channels close
- Potassium (positive charge) pushed out of the cell
- NA+/K+ pump restores the resting potential after refractory period & slowly brings K+ back into the cell


Area 13 of the Action Potential Diagram is _______
Resting State


The Blue area of the Action Potential Diagram Shows ______
Relative Refractory Period
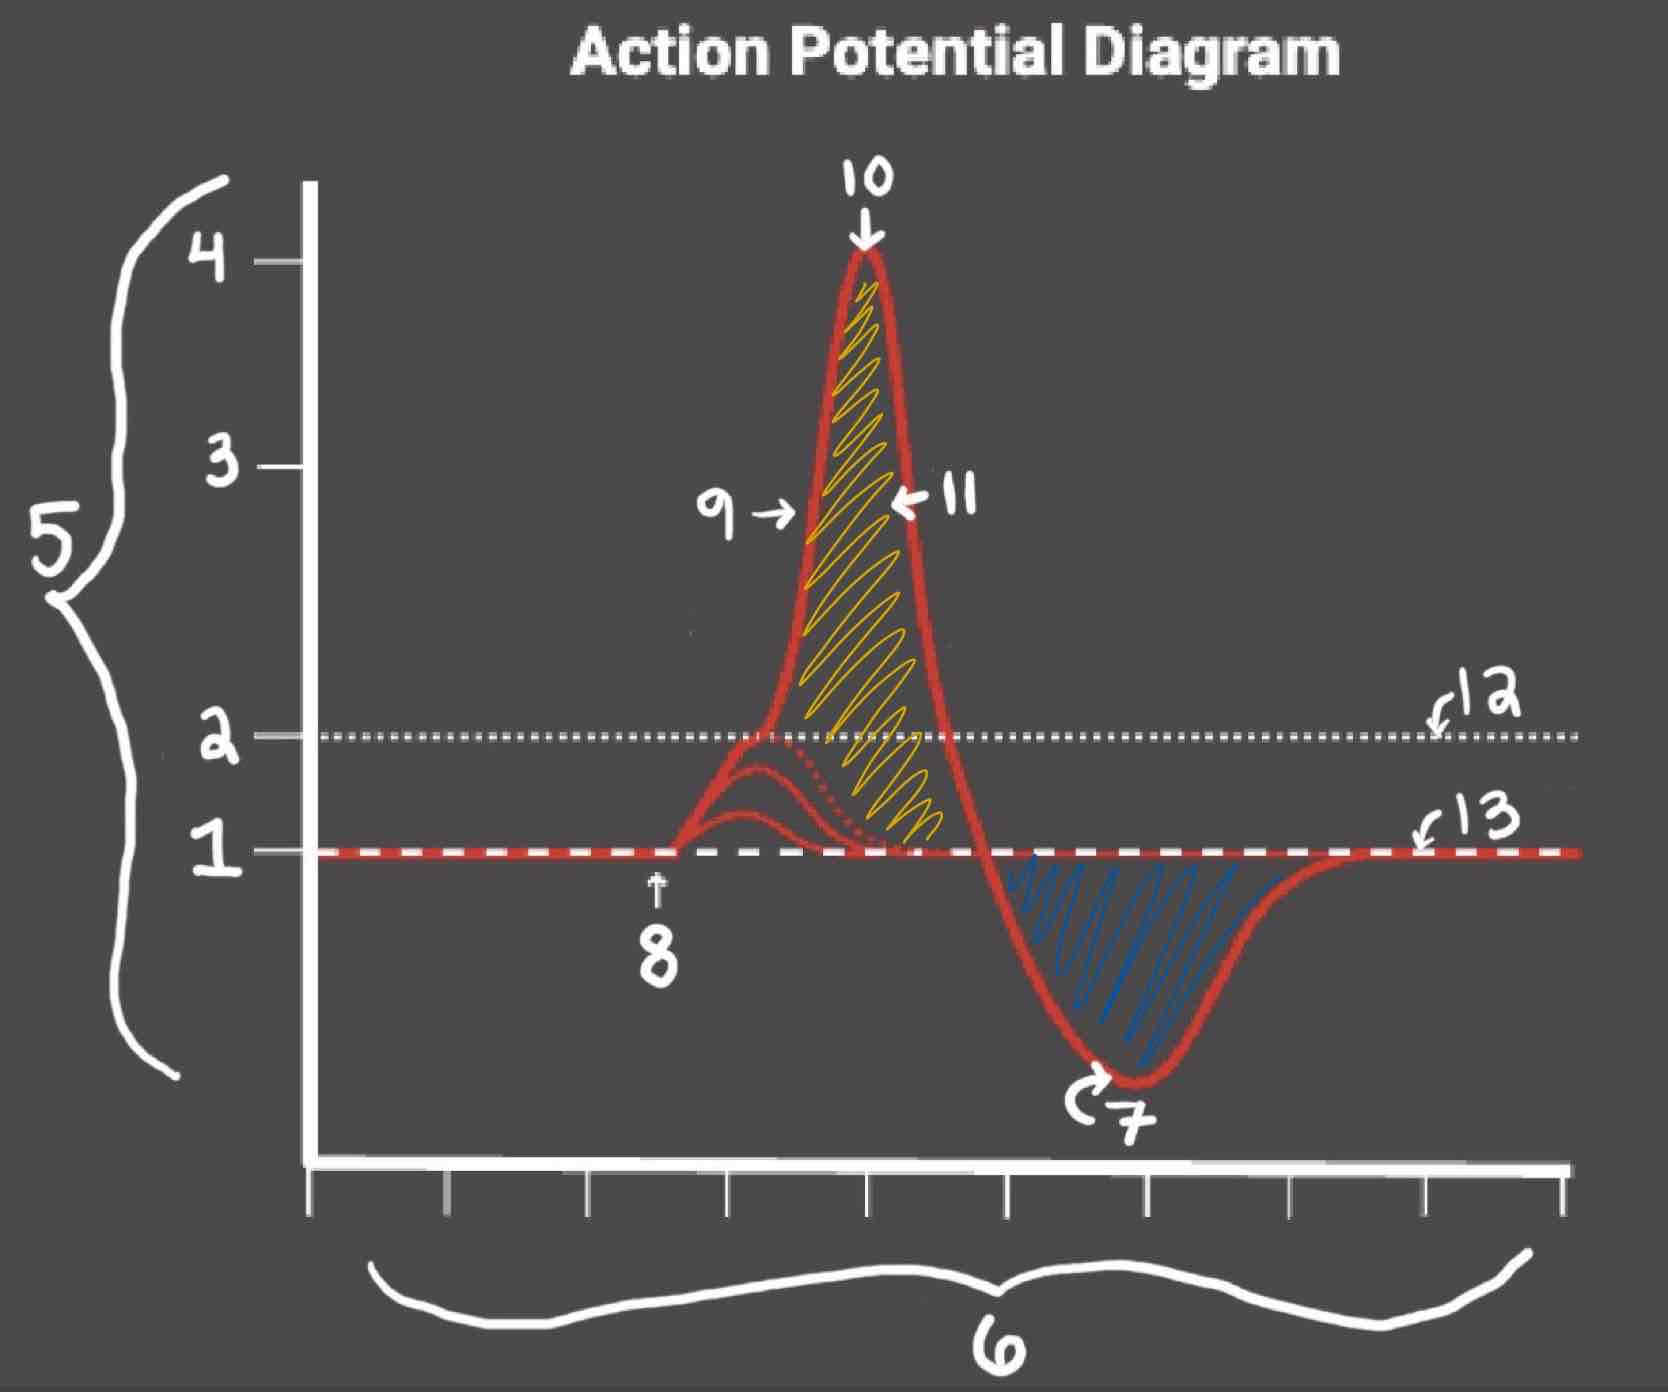

The Yellow area of the Action Potential Diagram Shows ______
Absolute Refractory Period


During the Relative Refractory Period, _______
Another action potential can be induced, but the stimulus must be higher because the cell is hyperpolarized.


During the Absolute Refractory Period, _______
Another action potential cannot be induced

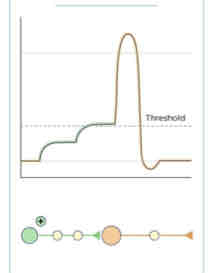
This Diagram Shows _______
Temporal Summation
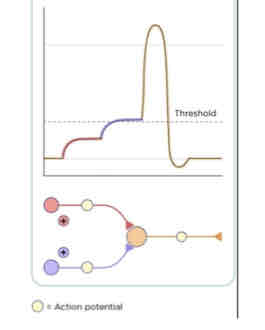
This Diagram Shows _______
Spatial Summation

Type 1 of the Myelinated and Unmyelinated Axons Diagram Is ______
A Myelinated Axon


Type 2 of the Myelinated and Unmyelinated Axons Diagram Is ______
An Unmyelinated Axon


Area 1 of the Myelinated and Unmyelinated Axons Diagram Is ______
Cell Body (Soma)


Area 2 of the Myelinated and Unmyelinated Axons Diagram Is ______
Node of Ranvier


Area 3 of the Myelinated and Unmyelinated Axons Diagram Is ______
Action Potential (Myelinated)


Area 4 of the Myelinated and Unmyelinated Axons Diagram Is ______
Myelin Sheath


Area 5 of the Myelinated and Unmyelinated Axons Diagram Is ______
Spread of Depolarization

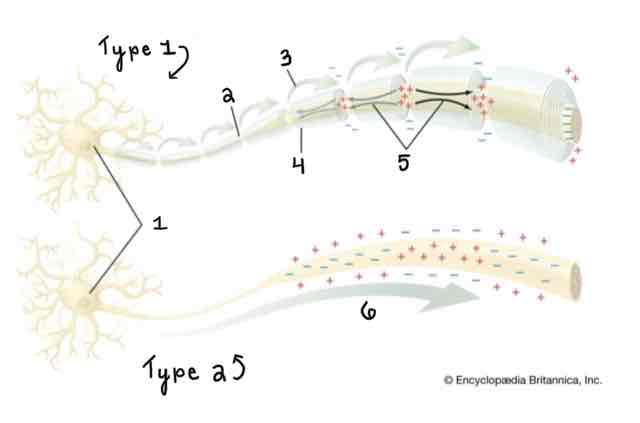
Area 6 of the Myelinated and Unmyelinated Axons Diagram Is ______
Action Potential

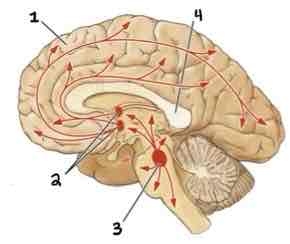
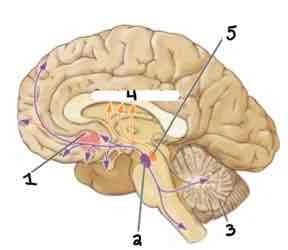
This Diagram shows the _______
Cholinergic System

Area 1 of this section of the Brain Systems Diagram Is ______
Frontal Cortex


Area 2 of this section of the Brain Systems Diagram Is ______
Basal Forebrain Nuclei


Area 3 of this section of the Brain Systems Diagram Is ______
Midbrain Nuclei


Area 4 of this section of the Brain Systems Diagram Is ______
Corpus Callosum


This Diagram shows the _____
Dopaminergic System

Area 1 of this section of the Brain Systems Diagram Is ______
Nucleus Accumbens in Basal Ganglia


Area 2 of this section of the Brain Systems Diagram Is ______
Ventral Tegmentum


Area 3 of this section of the Brain Systems Diagram Is ______
Cerebellum


Area 4 of this section of the Brain Systems Diagram Is ______
Caudate Nucleus


Area 5 of this section of the Brain Systems Diagram Is ______
Substantia Nigra

This Diagram shows the _____
Noradrenergic System

Area 1 of this section of the Brain Systems Diagram Is ______
Locus Coeurleus

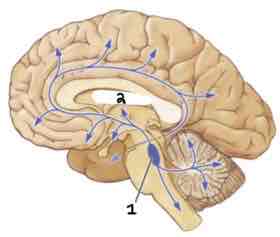
Area 2 of this section of the Brain Systems Diagram Is ______
Thalamus

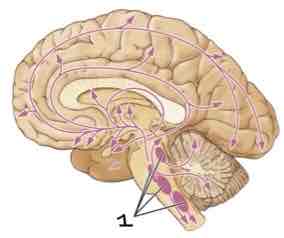
This Diagram shows the _____
Serotoninergic System

Area 1 of this section of the Brain Systems Diagram Is ______
Raphe Nuclei


Type 1 on the Other Types of Synapses Diagram is ______
Dendrodendritic


Type 2 on the Other Types of Synapses Diagram is ___
Axo-Dendric


Type 3 on the Other Types of Synapses Diagram is ___
Axoextracellular


Type 4 on the Other Types of Synapses Diagram is ___
Axosomatic


Type 5 on the Other Types of Synapses Diagram is ___
Axosynaptic

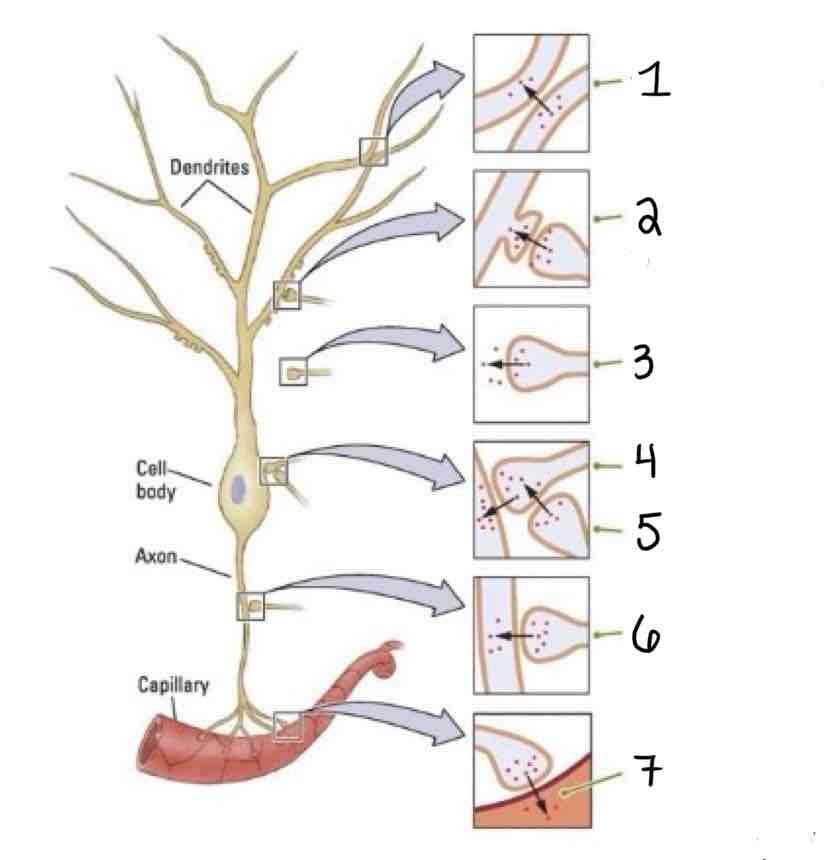
Type 6 on the Other Types of Synapses Diagram is ___
Axo-Axonic


Type 7 on the Other Types of Synapses Diagram is ___
Axosecretory

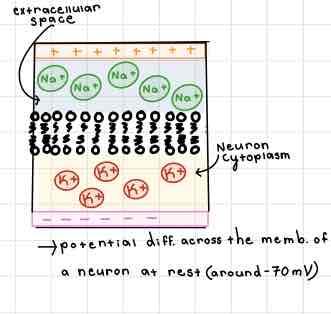
This Diagram of the Internal Membrane shows ______
Resting Potential

This Diagram of the Internal Membrane shows ______
Hyperpolarization

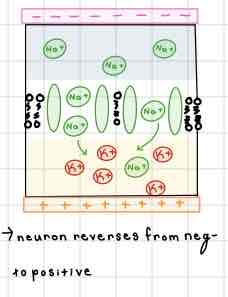
This Diagram of the Internal Membrane shows ______
Repolarization

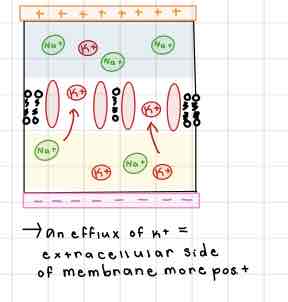
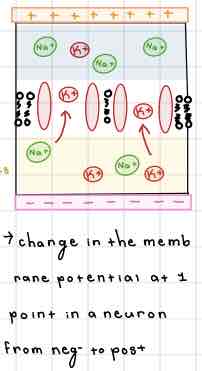
This Diagram of the Internal Membrane shows ______
Depolarization

Step 1 of Neurotransmission on the diagram is ______
Action Potential traveling down the Axon


Step 2 of Neurotransmission on the diagram is ______
Neurotransmitter Release from Synaptic Vesicles into the Synaptic Cleft


Step 3 of Neurotransmission on the diagram is ______
Neurotransmitters binding to receptors on the postysnaptic membrane
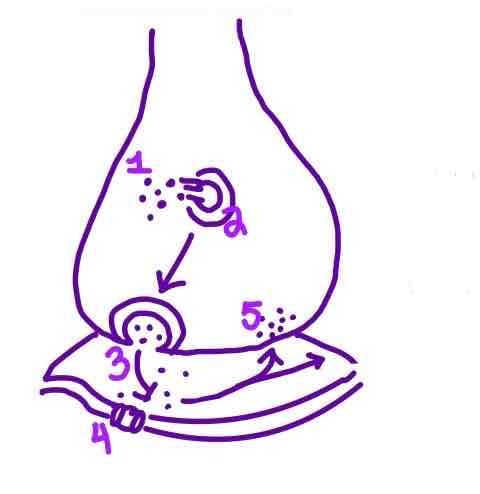

Step 4 of Neurotransmission on the diagram is ______
Ion Channels opening in the Postsynaptic Neuron


Step 5 of Neurotransmission on the diagram is ______
Reuptake OR Degradation of Neurotransmitters in the Synaptic Cleft

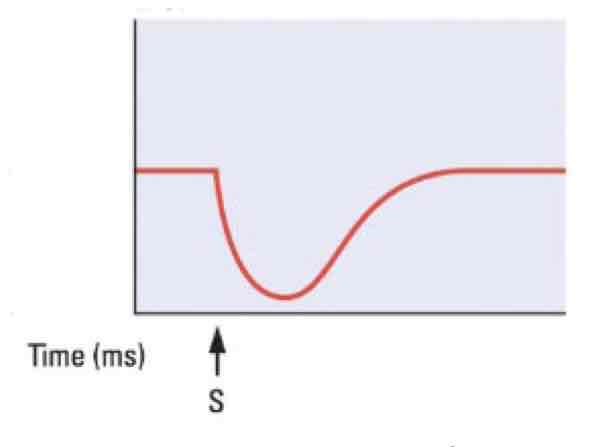
This graph shows a _______
Inhibitory post-synaptic potential (IPSP) with hyperpolarization
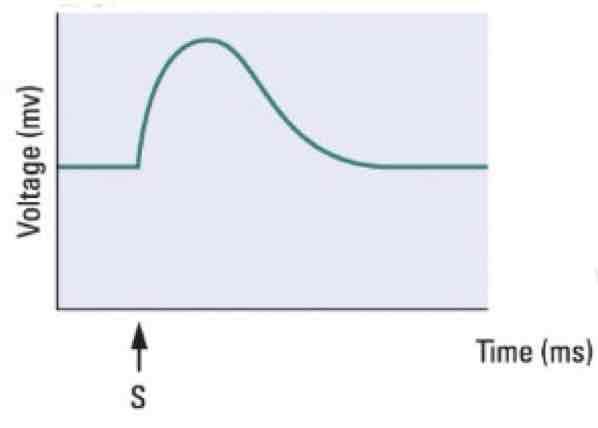
This graph shows a _______
Excitatory post-synaptic potential (EPSP) with depolarization
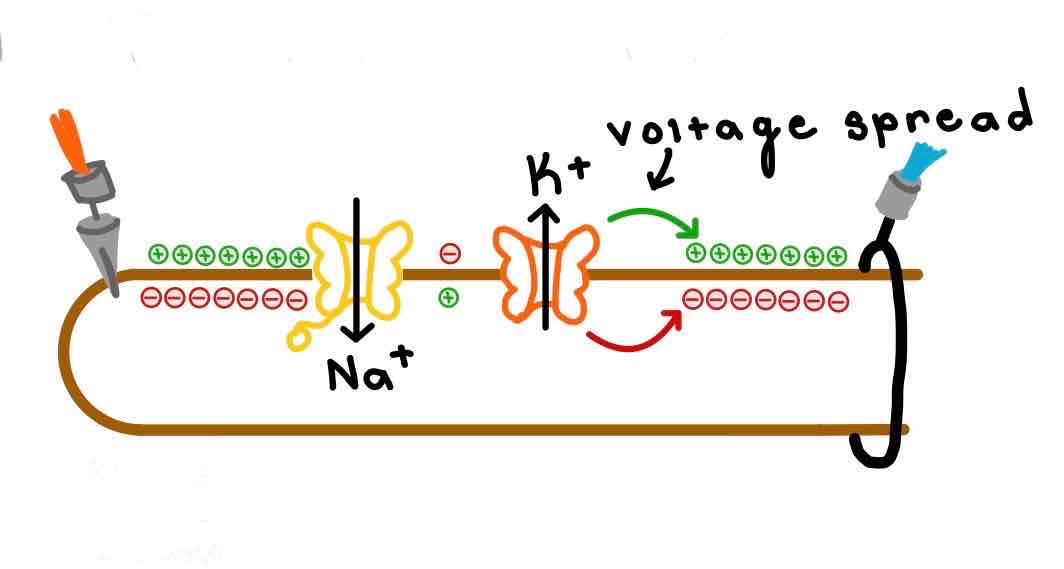
This diagram demonstrates _______
How an action potential is propagated along an axon.
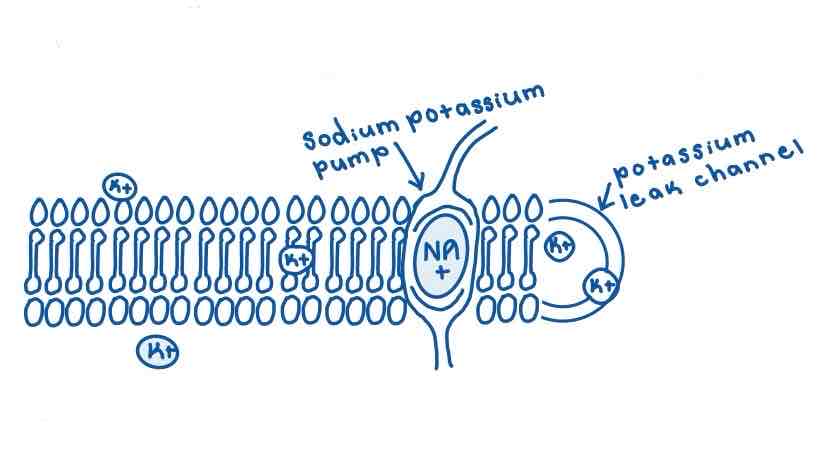
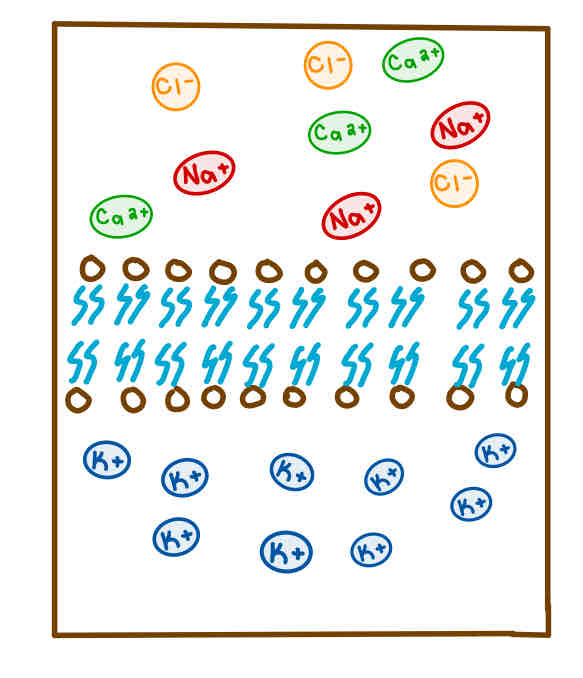
This Diagram shows a _______
Membrane Resting Potential

This Diagram shows the _______ view of the Vasculature Brain
Lateral

Area 1 on this Vasculature Brain Diagram is _______
Anterior Cerebral Artery

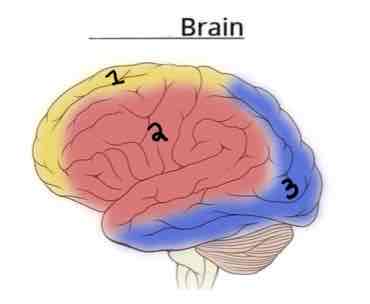
Area 2 on this Vasculature Brain Diagram is _______
Middle Cerebral Artery


Area 3 on this Vasculature Brain Diagram is _______
Posterior Cerebral Artery


This Diagram shows the _______ view of the Vasculature Brain
Medial
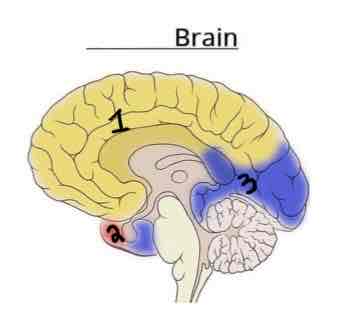
Area 1 on this Vasculature Brain Diagram is _______
Anterior Cerebral Artery


Area 2 on this Vasculature Brain Diagram is _______
Middle Cerebral Artery


Area 3 on this Vasculature Brain Diagram is _______
Posterior Cerebral Artery

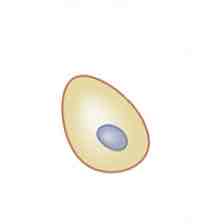
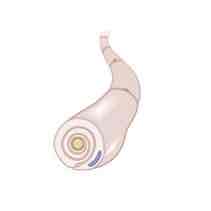
The cell depicted in the image shown is a _______ cell
Ependymal Cell

The function of the cell depicted in the image shown is to _______
Secrete Cerebrospinal Fluid (CSF)
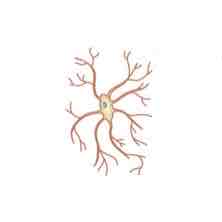
The cell depicted in the image shown is a _______ cell
Astrocyte
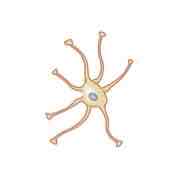
The cell depicted in the image shown is a _______ cell
Microglial

The function of the cell depicted in the image shown is to _______
(Derived from blood) remove dead tissue
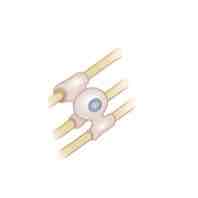
The cell depicted in the image shown is a _______ cell
Oligodendroglial Cell

The function of the cell depicted in the image shown is to _______
Form myelin around CNS axons in the brain and spinal cord
The cell depicted in the image shown is a _______ cell
Schwann Cell

The function of the cell depicted in the image shown is to _______
Wrap around peripheral nerves to form myelin
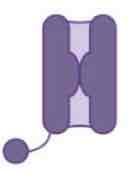
This image shows a _______ channel
Closed Sodium

This image shows a _______ channel
Open Sodium

This image shows a _______ channel
Inactivated Sodium

This image shows a _______ channel
Closed and Inactivated Sodium

This image shows a _______ channel
Closed Potassium

This image shows a _______ channel
Open Potassium

Area 1 of the Membrane Outside the Cell Diagram is the _______
Phospholipid Bilayer

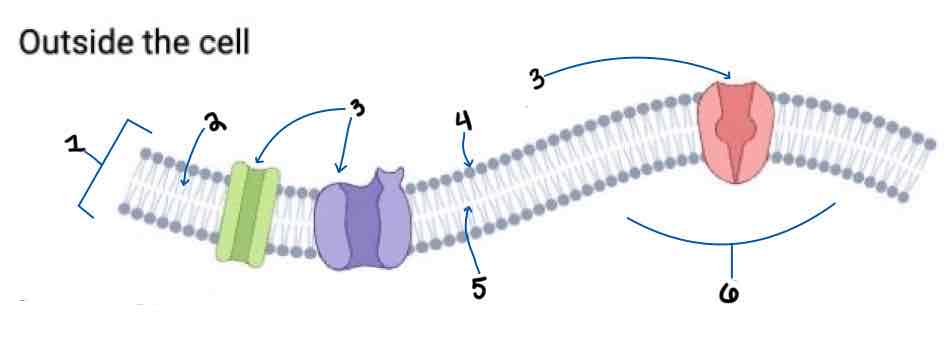
Area 2 of the Membrane Outside the Cell Diagram is the _______
Intracellular Fluid


Area 3 of the Membrane Outside the Cell Diagram is the _______
Embedded Proteins

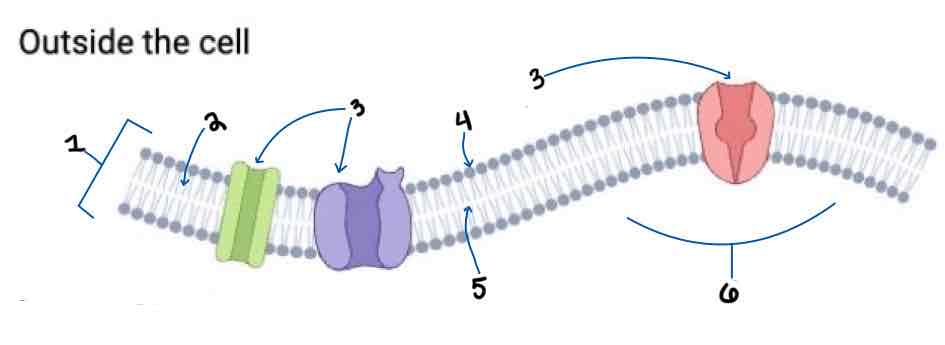
Area 4 of the Membrane Outside the Cell Diagram is the _______
Hydrophilic Heads


Area 5 of the Membrane Outside the Cell Diagram is the _______
Hydrophobic Tails


Area 6 of the Membrane Outside the Cell Diagram is the _______
Extracellular Fluid

This Diagram shows a _______
Impermeable Bilayer
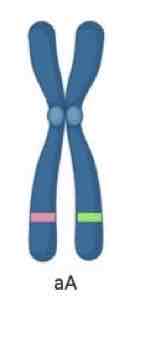
From the Chromosome shown, is it Homozygous or Heterozygous, and what allele will be expressed?
Heterozygous, Expressed: A