Module 2: 2-2: Displaying and Summarizing Data pt. 1
1/15
There's no tags or description
Looks like no tags are added yet.
Name | Mastery | Learn | Test | Matching | Spaced |
|---|
No study sessions yet.
16 Terms
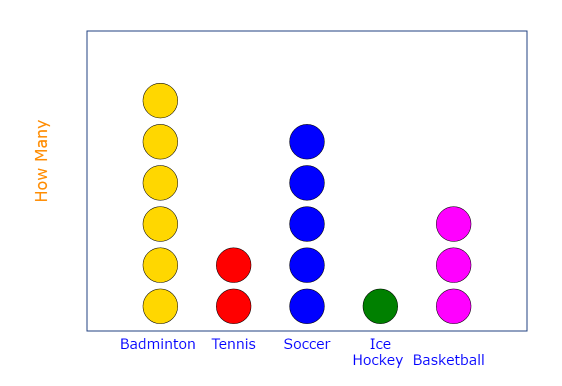
Dot plot
plot that portrays individual observations:
number of dots above a value on the number line represents the frequency of occurence of that value
work well for small sets of data
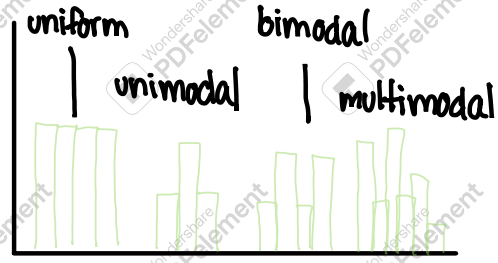
Shapes
nature of distribution:
characterized by the number of humps or modes
uniform, unimodal, bimodal, multimodal
Symmetry/Skewness
part of the left is a mirror image of the part to the right
Nonsymmetric graphs are skewed
outlier: values that falls outside the overall pattern
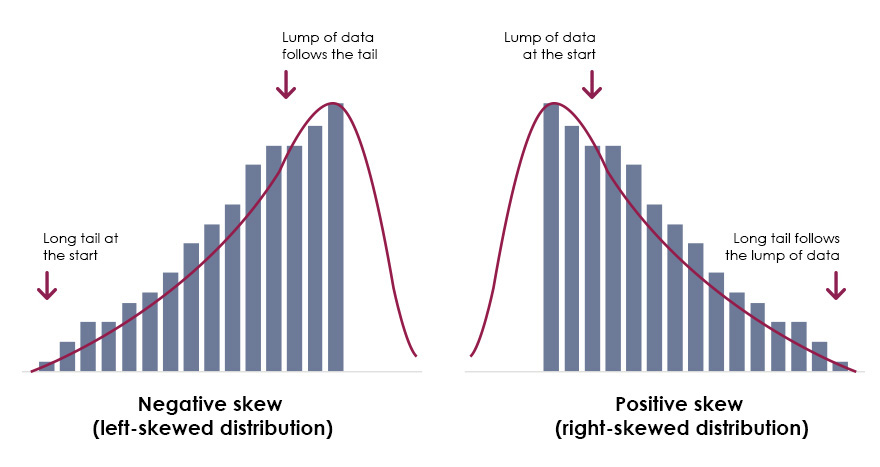
Skewed direction
+: large hump at left
-: large hump at right
Center and Spread
value that splits the data in half; mean, median, mode
range of values; range, standard deviation, IQR
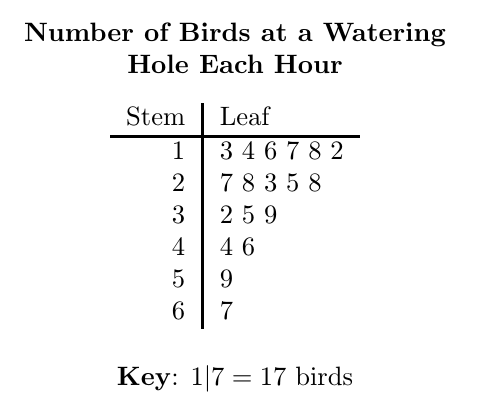
Stemplot
each number is broken into stems and leafs
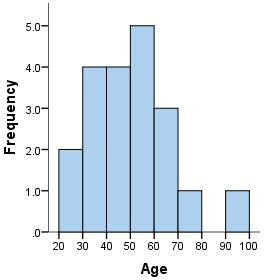
Histogram
visualizes the distribution of each variable well:
no spaces
quantitative
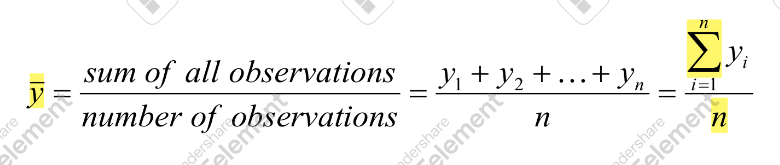
mean(u)
average number in a set of numerical observations
median(M)
value that divides sample set into two:
if n is odd: single middle value
if n is even: average(mean) of 2 middle values
mode
value with the highest frequency in the data set
Skewed distribution spreads:
+: mean > median > mode
-: mean < median < mode
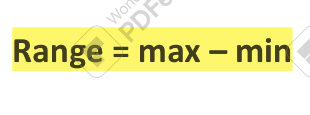
range
difference between the max and min of the value
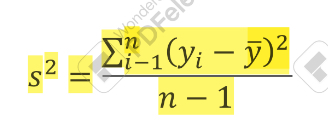
variance(s²)
sum of squared deviations from the mean divided by n-1
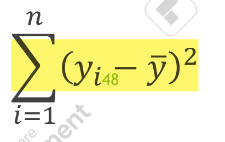
deviation
deviation of y from mean:
+: y value is greater than mean
-: value if smaller than mean
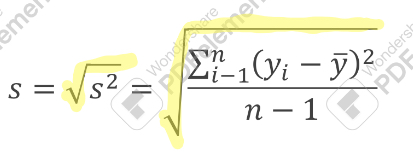
standard deviation
most common measure of variability, tells us how close the values of data set are clustered around the mean, square root of variance
standard deviation properties
s = 0: no spread, observations are the same value
s > 0: sd increases are observations become more spread out
can only be used when mean is chosen as the measure of center