AP Stats Unit 1
1/53
Earn XP
Description and Tags
Exploring One-Variable Data
Name | Mastery | Learn | Test | Matching | Spaced | Call with Kai |
|---|
No study sessions yet.
54 Terms
Categorical Variables
Variables that represent categories instead of numerical values.
Ex: Favorite color, gender, or marital status
Quantative Variables
Variables that represent numerical values instead of categories.
Ex: Height, class size, and population size
Two-Way Table
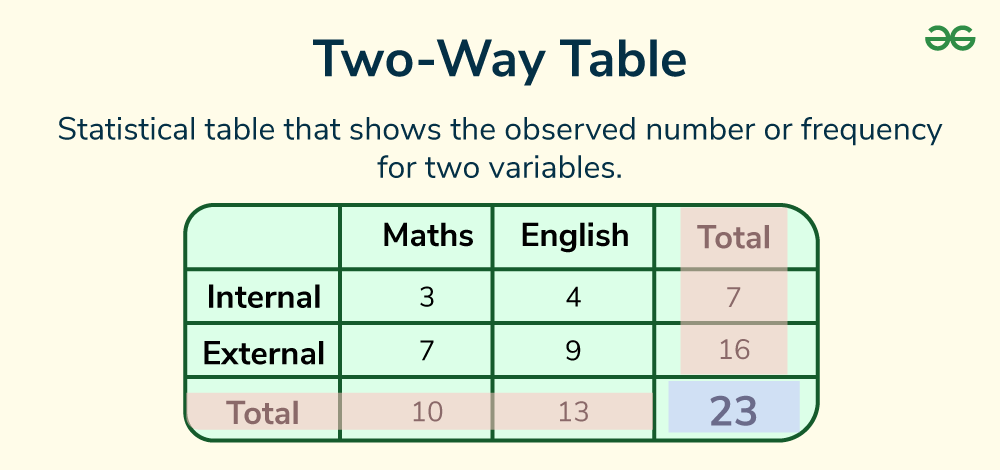
Statistical table that shows the observed number or frequency for two variables.
Marginal Relative Frequency
% of data in a single row/column compared to the total.
Joint Relative Frequency
% of data in a single group compared to the total.
Conditional Relative Frequency
% of data in a single category GIVEN a specific group.
How To Describe Quantitative Data
Context
Shape (Symmetrical, Skewed, # of peaks?)
Outliers
Center (Mean/Median)
Spread (Range, Standard Deviation, IQR)
How To Make Boxplots
Minimum
Q1
Median
Q3
Maximun
IQR
Q3-Q1
Low End Outlier
Q1-1.5(IQR)
High End Outlier
Q3+1.5(IQR)
Percentile
% of values less than or equal to a specific value.
Cumulative Relative Frequency
Shows cumulative percentages from each interval up through all the data.
When you add/subtract all data values by the same amount…
Shape and variability stays the same
Center moves up/down by that amount
When you multiply/divide all data values by the same amount…
Shape stays the same
Center and variability get multiplied/divided by that amount
Density Curves
On/above a horizontal axis
Has an area of 1
Shows probability distribution