Business 212: Business Statistics Ch 6. Measures of Association & Correlation in Business
1/68
There's no tags or description
Looks like no tags are added yet.
Name | Mastery | Learn | Test | Matching | Spaced |
|---|
No study sessions yet.
69 Terms
Independent Variable
a condition or piece of data in an experiment that can be controlled or changed
Dependent Variable
a condition or piece of data in an experiment that is controlled or influenced by an outside factor, most often the independent variable
Correlation
the relationship between two sets of variables used to describe or predict information
Positive Correlation
the dependent variables and independent variables in a data set increase or decrease together
Negative Correlation
the dependent variables and independent variables in a data set either increase or decrease opposite from one another
Causation
an observed event or action appears to have caused a second event or action
What is a condition or piece of data in an experiment that can be controlled or changed?
Positive correlation
Negative correlation
Independent variable
Dependent variable
Independent variable
What is it called when dependent variables and independent variables in a data set either increase or decrease opposite from one another?
Negative correlation
Independent variables
Positive correlation
Dependent variables
Negative correlation
A scientist plots data points from an experiment, and notices that the dependent variables and the independent variables in the data set are decreasing together. What kind of correlation have they discovered, and why?
A negative correlation, because these describe situations where the independent variables in a data set decrease.
A positive correlation, because these describe situations where the dependent variables and the independent variables in a data set increase or decrease together.
A negative correlation, because these describe situations where the dependent variables in a data set decrease.
A negative correlation, because these describe situations where the dependent variables and the independent variables in a data set decrease together.
A positive correlation, because these describe situations where the dependent variables and the independent variables in a data set increase or decrease together.
A scientist finishes an experiment, and concludes that there is a causal link between the independent variable and the dependent variable. Why might they come to this conclusion?
Because changes in the independent variable appear to cause changes in the dependent variable.
Because they notice changes in the independent variable.
Because changes in the dependent variable appear to cause changes in the independent variable.
Because they notice changes in the dependent variable.
Because changes in the independent variable appear to cause changes in the dependent variable.
A scientist is designing an experiment with rats, and designates weight as the dependent variable. Why might this be the case?
Because the weight will be the factor that the scientist controls.
Because weight cannot be controlled by the scientist.
Because weight can easily be controlled by the scientist.
Because the weight will be influenced by an outside factor that the scientist controls.
Because the weight will be influenced by an outside factor that the scientist controls.
Scatterplot
a visual representation of the relationship between two variables
Correlation
relationship between two variables
Correlation Coefficient
numerical representation of the strength and direction of the relationship
Which of the following is true concerning the correlation coefficient?
The correlation coefficient cannot be negative.
The correlation coefficient is always a decimal number.
The correlation coefficient must be between -1 and 1.
The correlation coefficient can be found on the axes of the scatterplot.
The correlation coefficient is never zero.
The correlation coefficient must be between -1 and 1.
To plot a scatterplot, the researcher must have:
Numerical data.
A reason to suspect they are connected.
Two variables.
All of the above.
All of the above.
Which of the following best describes a scatterplot?
A visual representation of a variable.
A visual representation of the relationship between two variables.
A numerical representation of the scatter.
A visual representation of the relationship between three or more variables.
A visual representation of the relationship between two variables.
Susan conducts a study and is able to make a scatterplot from the data she gathers. Susan's study is chosen to be published in a scientific journal, but does not include her scatterplot. Which of the following explains why Susan chooses not to include her scatterplot in the scientific journal?
Susan does not include her scatterplot because scatterplots are inaccurate and therefore unscientific.
Susan does not include the scatterplot because scatterplots are not interesting.
Susan does not include her scatterplot because the correlation coefficient is sufficient.
Susan does not include her scatterplot because it does not provide useful information.
Susan does not include her scatterplot because the reader should understand that her variables will be correlated without seeing it.
Susan does not include her scatterplot because the correlation coefficient is sufficient.
The correlation coefficient explains which of the following?
A prediction of what future studies will find.
The answer to the research problem.
The strength and direction of the relationship between two variables.
The reason why the research was conducted.
The strength and direction of the relationship between two variables.
Correlation
the relationship between two sets of variables used to describe or predict information
Correlation Coefficient
the degree in which the change in a set of variables is related
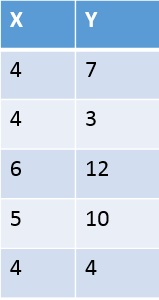
Find the correlation coefficient, r between the X and Y values.
Approximately 0.90
Approximately 0.73
Approximately 1.2
Approximately 0.52
Approximately 0.90
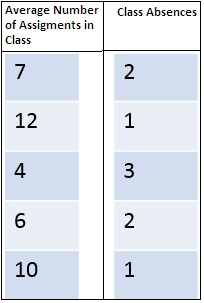
Find the correlation coefficient between the Average Number of Assignments in Class and the Class Absences. Deduce whether there is a positive or negative correlation.
Approximately -1.42, Strong Negative Correlation
Approximately -0.95, Strong Negative Correlation
Approximately 0.89, Strong Positive Correlation
Approximately 0.95 Strong Positive Correlation
Approximately -0.95, Strong Negative Correlation
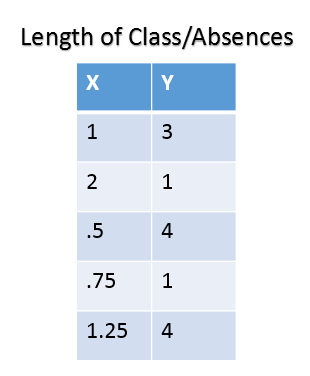
Find the correlation coefficient between the two values. Is there a positive or negative correlation?
Approximately -0.78, Strong Negative Correlation
Approximately 0.34, Positive Correlation
Approximately -0.13, Weak Negative Correlation
Approximately -0.44, Negative Correlation
Approximately -0.44, Negative Correlation
Find the correlation coefficient that exist between the two variables X and Y as given by the following coordinates.
(1,2) (2,1) (2,6) (3,1)
Approximately 0.72
Approximately -0.33
Approximately 0.30
Approximately -0.17
Approximately -0.17
The correlation coefficient between the number of girls passing in Physics at grade 9 and the number of girls passing Physics at grade 11 is 0.
Identify the correct statement for the above.
There is a positive correlation between the number of girls passing physics at grade 9 and the number of girls passing in Physics at grade 11
There is no correlation between the number of girls passing physics at grade 9 and the number of girls passing in Physics at grade 11
There will be a correlation between the number of girls passing physics at grade 9 and the number of girls passing in Physics at grade 11 in future.
There is a negative correlation between the number of girls passing physics at grade 9 and the number of girls passing in Physics at grade 11
There is no correlation between the number of girls passing physics at grade 9 and the number of girls passing in Physics at grade 11
Correlation
relationship between two variables
Pearson Correlation
a statistical procedure for determining the correlation of normally distributed, interval or ratio data
Statistical Procedure
a statistical formula that you will work with
Normally Distributed
describe the spread of the data
Interval and Ratio
describes the quantitative measurement of data
Sigma
to sum
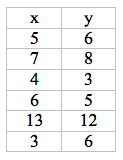
You are a research assistant for an important study. The lead psychologist on the study hands you the following data and asks you to find the Pearson coefficient. Which of the following numbers would you use for your 'n' value?
25
5
6
30
6
Which of the following best describes why the correlation coefficient is important?
The correlation coefficient describes the relationship between the two variables.
The correlation coefficient tells us whether our data is statistically significant.
The correlation coefficient tells us the summed differences between the variables.
The correlation coefficient describes the shape of the graph.
The correlation coefficient describes the relationship between the two variables.
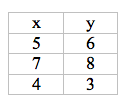
Mary is studying the relationship between hours slept and number of puzzles solved. She collects the following data where the x-value is hours slept and the y-value is puzzles solved: (5,3), (7,8), (4,6). Mary wants to calculate a Pearson coefficient, so she begins by organizing her data as shown below. Which of the following best describes the mistake that Mary made?
Mary did not put her x-values in order.
Mary did not put her y-values in order.
Mary did not make the number of puzzles her x-value.
Mary did not keep each subject's results together.
Mary did not keep each subject's results together.

What does sigma (shown below) mean in terms of mathematics?
To multiply
To sum
To square root
To square
To sum
In order to find a Pearson correlation, the distribution of the data must be _____.
Rounded
Even
Normal
Flat
Normal
coefficient of determination
R2
r2
a quantity that indicates how well a statistical model fits a data set
correlation coefficient
R
r
a measure of the statistical relationship between x and y
regression line
a line of best fit for the data points
Which of the following is TRUE about the correlation coefficient?
It is always less than 0.
It is a measure of the statistical relationship between x and y.
It is always greater than 1.
It is the mean value of the data set.
It is a measure of the statistical relationship between x and y.
What does r represent?
The correlation coefficient
The standard deviation of a data set
The mean of a data set
The coefficient of determination
The correlation coefficient
What does r^2 represent?
The coefficient of determination
The standard deviation of a data set
The mean of a data set
The correlation coefficient
The coefficient of determination
Which of the following is TRUE about the coefficient of determination?
It is always greater than 1.
It is always less than 0.
It is a quantity that indicates how well a statistical model fits a data set.
It is always the mean value of a data set.
It is a quantity that indicates how well a statistical model fits a data set.
How are the coefficient of determination and the correlation coefficient related?
The correlation coefficient is equivalent to the square of the coefficient of determination.
The coefficient of determination is equivalent to the square of the correlation coefficient.
The coefficient of determination is double the correlation coefficient.
The correlation coefficient is double the coefficient of determination.
The coefficient of determination is equivalent to the square of the correlation coefficient.
Pearson Correlation Coefficient
statistical formula that measures the strength between variables and relationships
this formula is often referred to as the Pearson R test
Step 1: Make a chart with your data for two variables, labeling the variables (x) and (y), and add three more columns labeled (xy), (x2), and (y2)
Step 2: Complete the chart using basic multiplication of the variable values
Step 3: After you have multiplied all the values to complete the chart, add up all of the columns from top to bottom
Step 4: Use this formula to find the Pearson correlation coefficient value
Step 5: Once you complete the formula above by plugging in all the correct values, the result is your coefficient value
Coefficient value
how strong the relationship is between two variables
can range between -1.00 and 1.00
Negatively correlated
when the coefficient value is in the negative range
Positively correlated
when the coefficient values is in the positive range
Statistical significance
must be present in order to establish a probability of the results without error
generally set to represent .05 or below
means that there is less of a chance of error
Zoe needs to analyze the strength of the relationship between two variables. What is the correct name for the test she needs to conduct?
Pearson R
PCC
Pearson Co
Correlation Co
Pearson R
Joe is doing an analysis of data for his Economics 104 class. He has the value of the foreign direct investment and political stability of one country. What could he learn about this relationship from the Pearson Coefficient?
How long ago something has occurred
How strong the relationship is
How varied the relationship is
Whether or not there is a causal link between the variables
How strong the relationship is
What is the range of the coefficient value?
-10.00 and 10.00
-1.00 to 1.00
-100.00 and 100.00
-5.00 and 5.00
-1.00 to 1.00
James is analyzing data for his final class. His teacher asked him to conduct a Pearson R test and to interpret the result. When calculating the Pearson R, James determined the increase of one variable correlates with a strong decrease of the other variable. What is the MOST likely value of the Pearson R Coefficient?
0
-0.87
0.91
-0.21
-0.87
Which of the following Pearson Coefficients is MOST statistically significant?
A coefficient with a p-value of 0.05
A coefficient with a p-value of 0.92
A coefficient with a p-value of 0.01
A coefficient with a p-value of 0.5
A coefficient with a p-value of 0.01
correlations
provide us with measurements of the actual relationships between two or more variables
standard correlation coefficient
derived using the differences between those individuals values and their averages
The price of a small company's stock correlated to a large capital index measurement is -0.02. What of the following is best understood from this fact?
A rise in the index is likely to result in a rise in the stock price.
The company stock price has an inverse relationship to the index.
The comparison is invalid, as the two measurements should not be correlated.
The company stock price has a random statistical relationship to the index.
The company stock price has a random statistical relationship to the index.
How is the standard correlation coefficient derived?
By using the difference between the net value and the average of individual values
By determining the median income level and calculating the average differences between that median point and the other data points
By using the differences between those individual values and their averages
By using the sum of averages and calculating the overall mean value those averages
By using the differences between those individual values and their averages
A portfolio of stocks has a correlation to a global energy index of +0.85. If you desire risk reduction in the portfolio, what is the best course of action?
Hold all your stocks as they currently are, and wait for market corrections.
Sell some of your energy stocks and purchase other unrelated assets.
Don't invest in energy stocks due to global warming.
Look for companies to invest in that are in the energy sector.
Sell some of your energy stocks and purchase other unrelated assets.
Every time the Federal Reserve bank decreases the prime lending rate by 1%, automobile sales go up by 2%. Which of the following is the best statement to make regarding the correlation of these values?
More money available means more cars bought, which is a positive correlation.
The two actions appear to be negatively correlated.
The two actions have no statistical relationship.
Falling interest rates cause more people to buy cars.
The two actions appear to be negatively correlated.
A company has to pay more in tariffs each year, and passes all of the added cost along to its customers as part of the retail sales price. If everything else stays exactly the same, what can be said about the correlation of tariffs and higher prices, as measured by that company?
The correlation of tariffs and higher prices will be positive.
The correlation of tariffs and higher prices will be zero.
The correlation of tariffs and higher prices will be random.
The correlation of tariffs and higher prices will be negative.
The correlation of tariffs and higher prices will be positive.
correlation coefficient
measures the association between two variables
CORREL function
is accessed in Excel by either typing =CORREL in the function box (that's the long text box labeled fx) or clicking on the fx label in order to bring up the list of functions
used to calculate the coefficient or use an Add-in, the Analysis ToolPak
How can you access the CORREL function in Excel?
Click on the Data ribbon
Click on the fx icon and search/select
Type CORREL in the cell
Click on Data Analysis Add-in
Click on the fx icon and search/select
There is a correlation coefficient between bean bag sales and drunk driving citations (0.86). What does this mean?
Drunk driving causes beanbag sales
Beanbag sales cause drunk driving
There is no relationship between the variables
There is a strong relationship between the variables
There is a strong relationship between the variables
If you don't see the Data Analysis option in the Data ribbon, what do you need to do?
Enable the Add-in through the CORREL function
Disable all Add-ins
Enable the Add-in in Excel
Re-install Excel
Enable the Add-in in Excel
In order to use the CORREL function in Excel, what is needed?
A single array of numeric data
Three arrays of numeric data
Two arrays of numeric data
Any number of text or numeric arrays
Two arrays of numeric data

Based on the data below, what can we say about Investments and Sales?
There is a negative correlation between Investments and Month
There is a positive correlation between Investments and Sales
There is a negative correlation between Investments and Sales
There is 100% correlation between Investments and Sales
There is a negative correlation between Investments and Sales