The Maxwell-Boltzmann Distribution Curve
1/8
There's no tags or description
Looks like no tags are added yet.
Name | Mastery | Learn | Test | Matching | Spaced | Call with Kai |
|---|
No analytics yet
Send a link to your students to track their progress
9 Terms
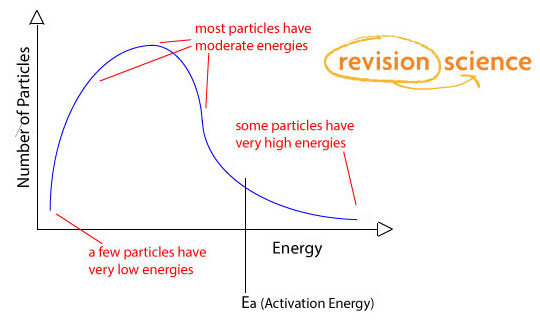
What is a Maxwell-Boltzmann Distribution curve?
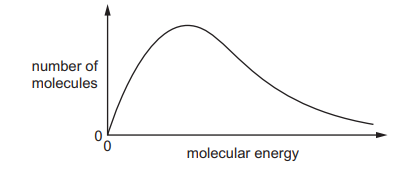
The Maxwell-Boltzmann Distribution represents the distribution of molecular energies in gases.
It is a plot of the number of particles, where each particle has a particular energy.
Explain why the curve always starts at the origin.
There are no particles with zero energy.
What does the area under the Maxwell-Boltzmann Distribution curve represent?
The area under the curve is a measure of the total number of particles present in a system.
Explain the difference between the median particle energy and mean particle energy.
The peak of the curve represents the media (most common) energy of any single particle in the reaction.
The mean particle energy is slightly higher than the median, because often very high energy particles are present, which distort the mean.
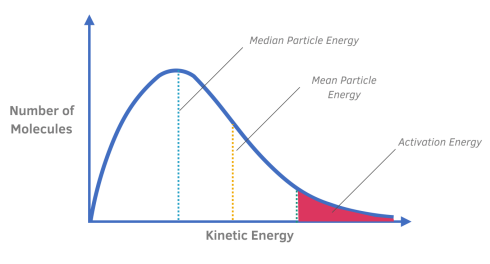
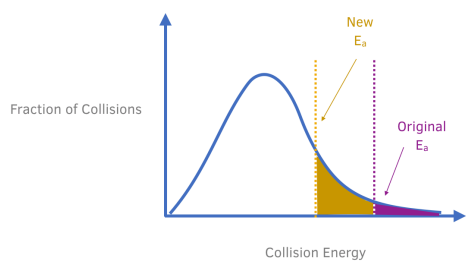
How is the activation energy represented on a Maxwell-Boltzmann Distribution curve?
A dotted line or straight line is used to represent the activation energy.
What does the shaded region to the right of the activation energy represent?
The shaded region to the right of the activation energy line represents the particles that will react when they collide.
These are the particles that have sufficient energy that is more than the activation energy.

How does increasing temperature affect the rate of a reaction?
Particles have more kinetic energy and move faster.
Increased movement of molecules means collisions occur more often and with greater energy.
As a result, more collisions have energy greater than the activation energy and result in a reaction.
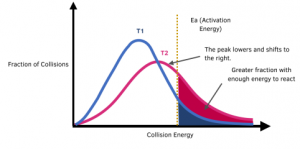
How do you represent an increase in temperature on a Maxwell-Boltzmann Distribution curve?
When the temperature is increased from T1 to T2, the shape of the Maxwell Boltzmann distribution changes. The peak lowers and shifts to the right.
Increasing the temperature increases the proportion of particles that have sufficient energy (at least the activation energy) to react. This can be observed from the shaded region which increases in area when the temperature is increased.
As a result of there being a greater proportion of particles having sufficient energy to react, the rate of reaction increases.
The graph shows that even a small increase in temperature can lead to a large increase in rate.
How do you represent the use of a catalyst on a Maxwell-Boltzmann Distribution curve?
Only the particles that are represented by the area to the right of the activation energy will react when they collide.
When the catalyst is used, an alternative route is provided with a lower activation energy. This is represented by the shift in the line, labelled activation energy, to the left.
According to the Maxwell Boltzmann distribution, using a catalyst increases the proportion of particles that have sufficient energy (at least the activation energy) to react. This can be observed from the shaded region which increases in area when the catalyst is used.
As a result of there being a greater proportion of particles having sufficient energy to react, the rate of reaction increases.