Bio Units 9-12
1/115
There's no tags or description
Looks like no tags are added yet.
Name | Mastery | Learn | Test | Matching | Spaced | Call with Kai |
|---|
No study sessions yet.
116 Terms
Plantae
Autotrophic, has a cell wall
Animalia
Heterotrophic, does not have a cell wall
Fungi
Heterotrophic, has a cell wall
Protista
Single-celled
Monera
Singled-celled, Prokaryotic, can be autotrophic or heterotrophic
Blue-Green Algae
Uses blue and green pigments to conduct photosynthesis
No
Does blue-green algae contain chloroplasts?
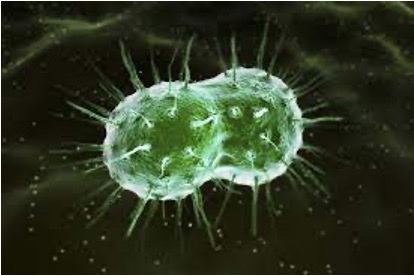
Diplo-
Bacterial prefix that describes bacteria that occur as pairs of cells joined together
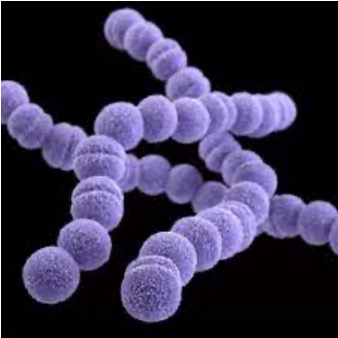
Strepto-
Bacterial prefix that describes bacteria that occur in chains of cells
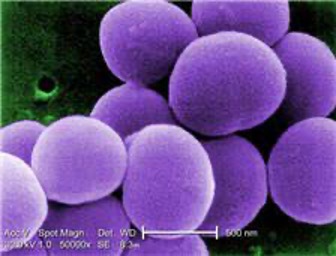
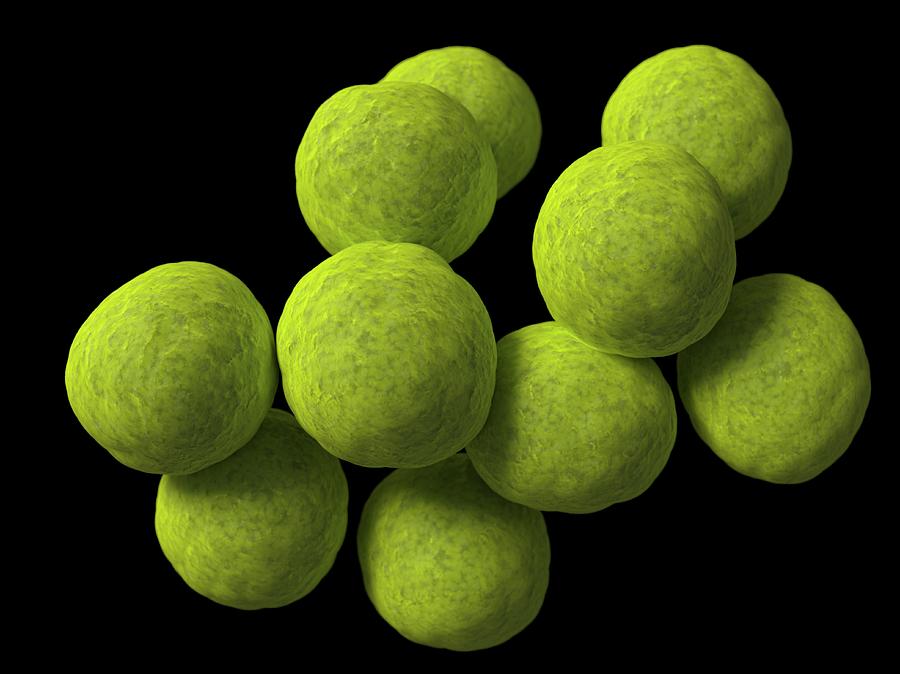
Staphylo-
Bacterial prefix that describes bacteria that occur in clusters of cells
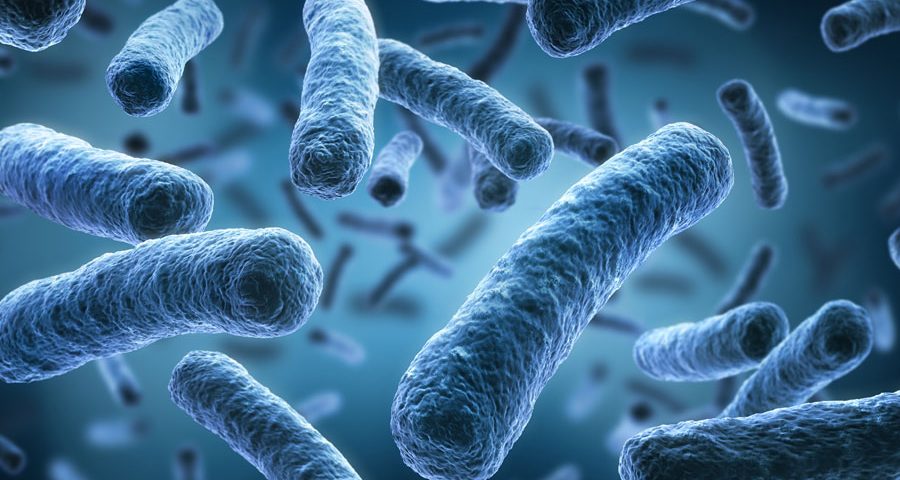
Bacillus
Rods
Coccus
Spheres
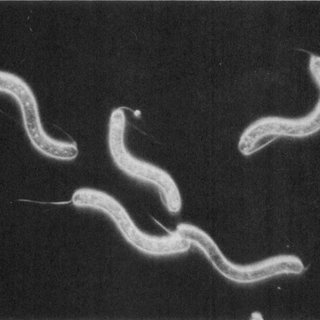
Spirillum
Fungi
Multicellular, Eukarytoic, Heterotrophic, with a cell wall
Hyphae
Thread-like cells that form a mat, obtain nutrients by absorption across cell walls
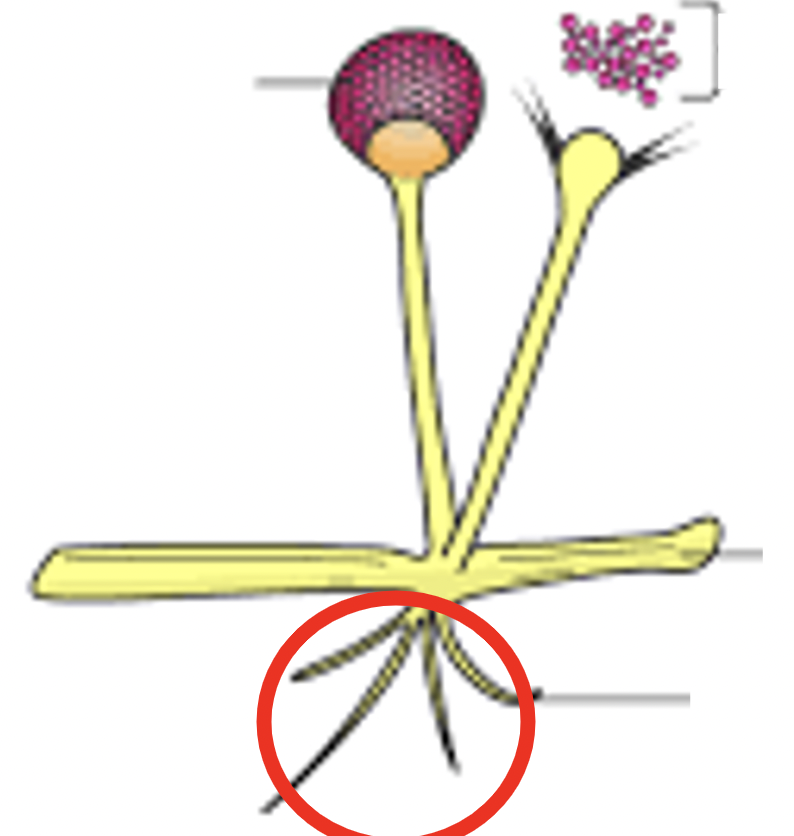
Mycelium
Mat formed by hyphae, ‘body’ of fungus
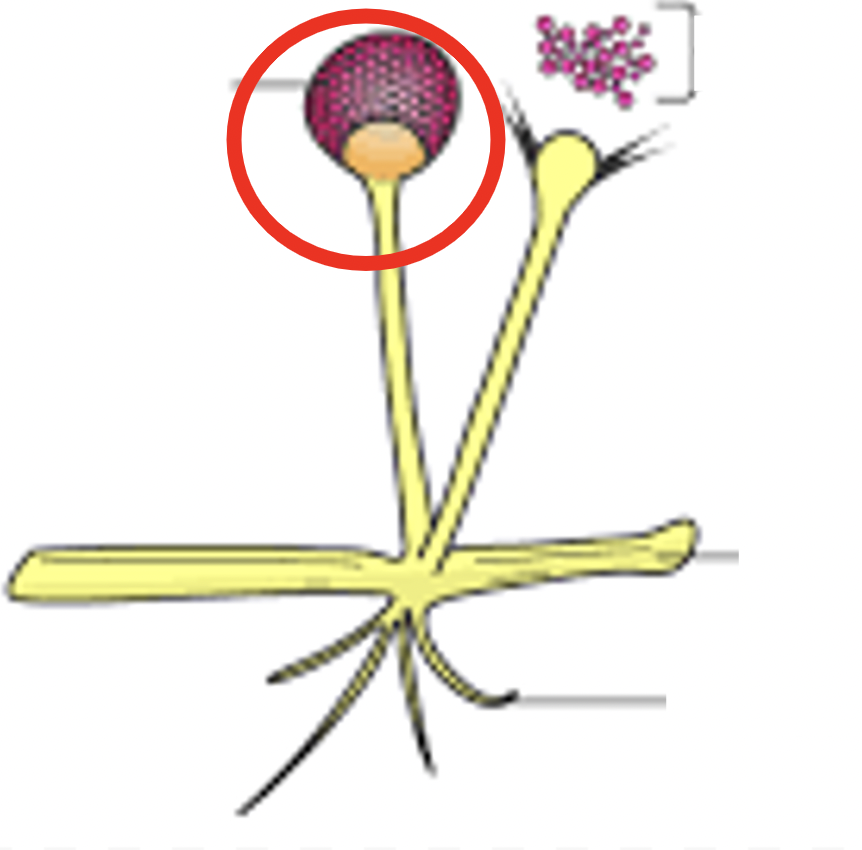
Sporangia
Spore-bearing structure, the spores are used for reproduction
High surface area :
Volume ratio
Plants
Multicellular
Eukaryotic
Autotrophic
Cell wall
Bryophyta
No vascular tissues, spores
Pterophyta
Has vascular tissue, spores
Coniferophyta
Has vascular tissue, seeds come in cones
Anthophyta
Has vascular tissue, seeds are in flowers or fruit
Photosynthesis
Majority of plants get nutrition through:
Porifera
Sponges, sessile and heterotrophic, invertebrate
Cnidaria
Coral, anemones, jellyfish
Can be sessile or mobile
Heterotrophic
Invertebrate
Platyhelminthes
Tapeworms, flukes, planaria
Can be parasitic
Heterotrophic
Invertebrate
Annelida
Earthworms, leeches
Worm-like
Segmented & have a coelom
Invertebrate
Mollusca
Clams, snails, slugs, octopus, squid
Have a coelom but not segmented
Have a mantle
Invertebrate
Mantle
Tissue that secretes a shell
Invertebrate
No backbone
Vertebrate
With a backbone
Coelom
Fluid filled cavity in the body
Sessile
Does NOT move
Arthropoda
Insects, spiders, millipedes, lobsters, crayfish, flies
Have a coelom and segmented
Have an exoskeleton
Have jointed appendages (legs, wings, etc)
Invertebrate
Echinodermata
Starfish, sea urchins, sea cucumbers, sand dollars
Spiny skin
Have a coelom
Five fold symmetry
Invertebrate
Chordata
Amphioxus, fish, amphibians, reptiles, birds, mammals
Have a coelom
Notochord
Pharyngeal gills
Dorsal nerve cord
Flow charts
Distinguishes traits from animal kingdoms
Organisms written at tips of the line
Biological traits written on the line
Distinguishing traits are complementary
Ex: Leaves without lobes vs leaves with lobes
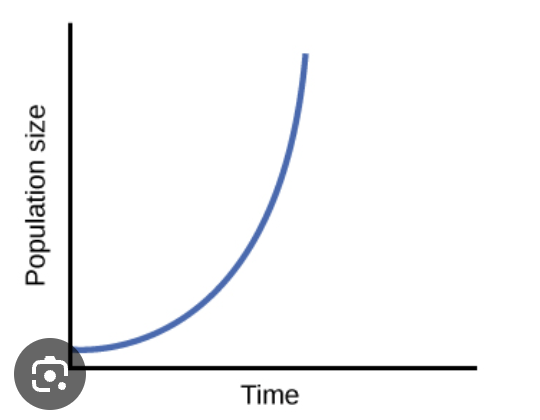
Potential Growth / Biotic Growth
Rate of increase of a population under ideal conditions
Logistic Growth
Growth curve in which the rate of increase slows and the curve flattens
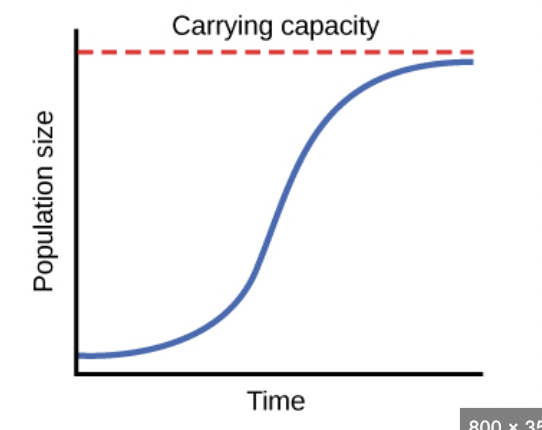
Carrying Capacity
Maximum number of individuals that a given habitat can support over time
Limiting Factors
Something that prevents a population from achieving its biotic potential
K (Carrying Capacity) can be estimated by:
The average number at which population fluctuates
Type I Survivorship Curve
High probability of survival early in life, low survival later in life
Usually mammals
Type II Survivorship Curve
Survival is not dependent on age (probability is constant)
Some insects, birds, lab organisms
Type III Survivorship Curve
Low probability of survival early in life, high survival later in life
Sea turtles
Organisms would have alot of babies to increase in order to increase the likelihood that one survives
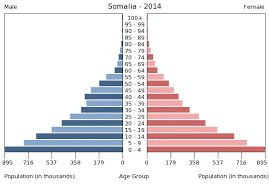
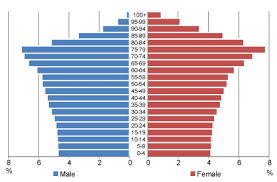
Age structure
Numbers/percentages of individuals in each age class of the population
Viewed in terms of ability
Increasing/growing population pyramid
Broad base in pre-productive ages (bottom)
Stable population pyramid
Roughly equal numbers of individuals within each age class
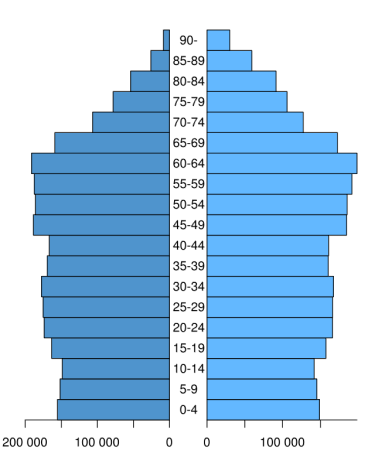
Decreasing/declining population pyramid
Most individuals in post-reproductive class (top)
Least in pre-productive class (bottom)
Survivorship
Probability of surviving, varies with age
Fecundity
Reproductive output of an individual (# of offspring/female)
Age-specific fecundity
How each age class contributes to population growth
Net reproductive rate
Expected # of offspring of a female during her life time
R > 1
Population growing in size
R = 1
Population is stable
R < 1
Population is decreasing in size
R
Sum of average fecundity in each age class
Trophic Structure
The organization of a community based on feeding relationships
Trophic Level
Position on the food chain
Producers
Autotrophs; primarily photosynthetic organisms
Primary Consumers
Organisms that feed on producers
Secondary Consumers
Organisms that eat primary consumers
Tertiary Consumer
Organisms that eat secondary consumers
Decomposer
Organisms that obtain their energy and nutrients from dead organic matter
Food Web
A graphic of the feeding relationship among organisms in an ecosystem
Ecological Pyramid
A graphic of the trophic structure of an an ecosystem in which numbers/biomass are represented
As the pyramid goes up
Number of organisms decreases
Biomass decreases
Plant biomass
is not completely convertible into animal biomass because it is indigestible
Heat and excrement
Energy can be lost as
Decomposers
can reclaim some of the lost energy
Less biomass
Less energy at higher trophic levels =
Competitive dominance hierarchy
Graphic representation of competitive relationships
Share the resource by partitioning
Multiple organisms using one resource
Do not partition resource
Multiple organisms not using one resource
Different niche = no partitioning
Multiple organisms using one resource but in different ways
Most competitive
Organisms with the most arrows pointing at it is the
Habitat
The physical space occupied by an organism
Niche
The ecological role of an organism and how it interacts with its environment
Biotic Factors
Organisms in the environment (living things as a whole)
Abiotic Factors
Non-living components of the environment (rocks, dirt, etc)
Keystone Species
A species that has disproportionately large impact on its ecological community compared to its low abundance
Keystone predators
Top predators that have a large impact on the ecosystem
Natural Selection
Natural process that results in the survival and reproductive success of individuals or groups best adjusted to their environment
Natural Variability
Some individuals are better suited to the environment than others
Adaptive Traits
Traits that give them an natural advantage, more likely to survive and reproduce to pass down these traits
Variation
Some traits are better suited for the environment than others
Heritability
Part of the phenotype (physical characteristics) that is genetically based and is capable of being inherited
Non-random Survival and Reproduction
Organisms who happen to be best suited to the environment survive and reproduce
Mutations =
Random
Natural Selection =
NOT random
Natural selection doesn’t:
cause favorable traits to appear in the population
Natural selection picks
amongst existing variants that arise by mutation and happen to be favorable
allele frequencies =
evolution
Gene Flow
Exchange of genes by migration between two populations
Populations that continue to exchange genes
will have similar gene pools
When populations are separated:
speciation is likely to occur
Speciation
evolutionary process by which populations become a new, distinct species
Genetic Drift
Random changes in gene frequency due to sampling error
Population size is low
gene frequency will vary erratically