Biogeography and Primary Production in Ecosystems
1/132
There's no tags or description
Looks like no tags are added yet.
Name | Mastery | Learn | Test | Matching | Spaced |
|---|
No study sessions yet.
133 Terms
Hectare
Unit of area equal to 10,000 square meters.
Amazon Rainforest
Contains more plant species than all of Europe.
Amazon River
Home to more fish species than Atlantic Ocean.
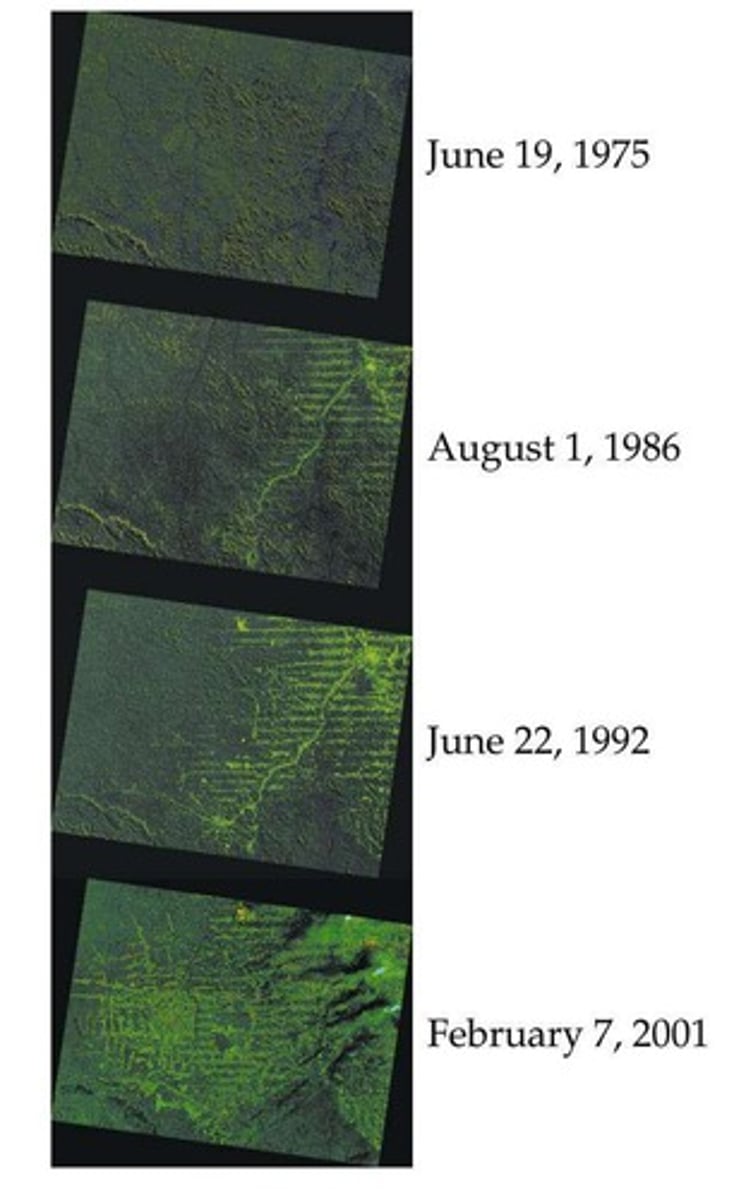
Deforestation
Conversion of forested areas to non-forest uses.
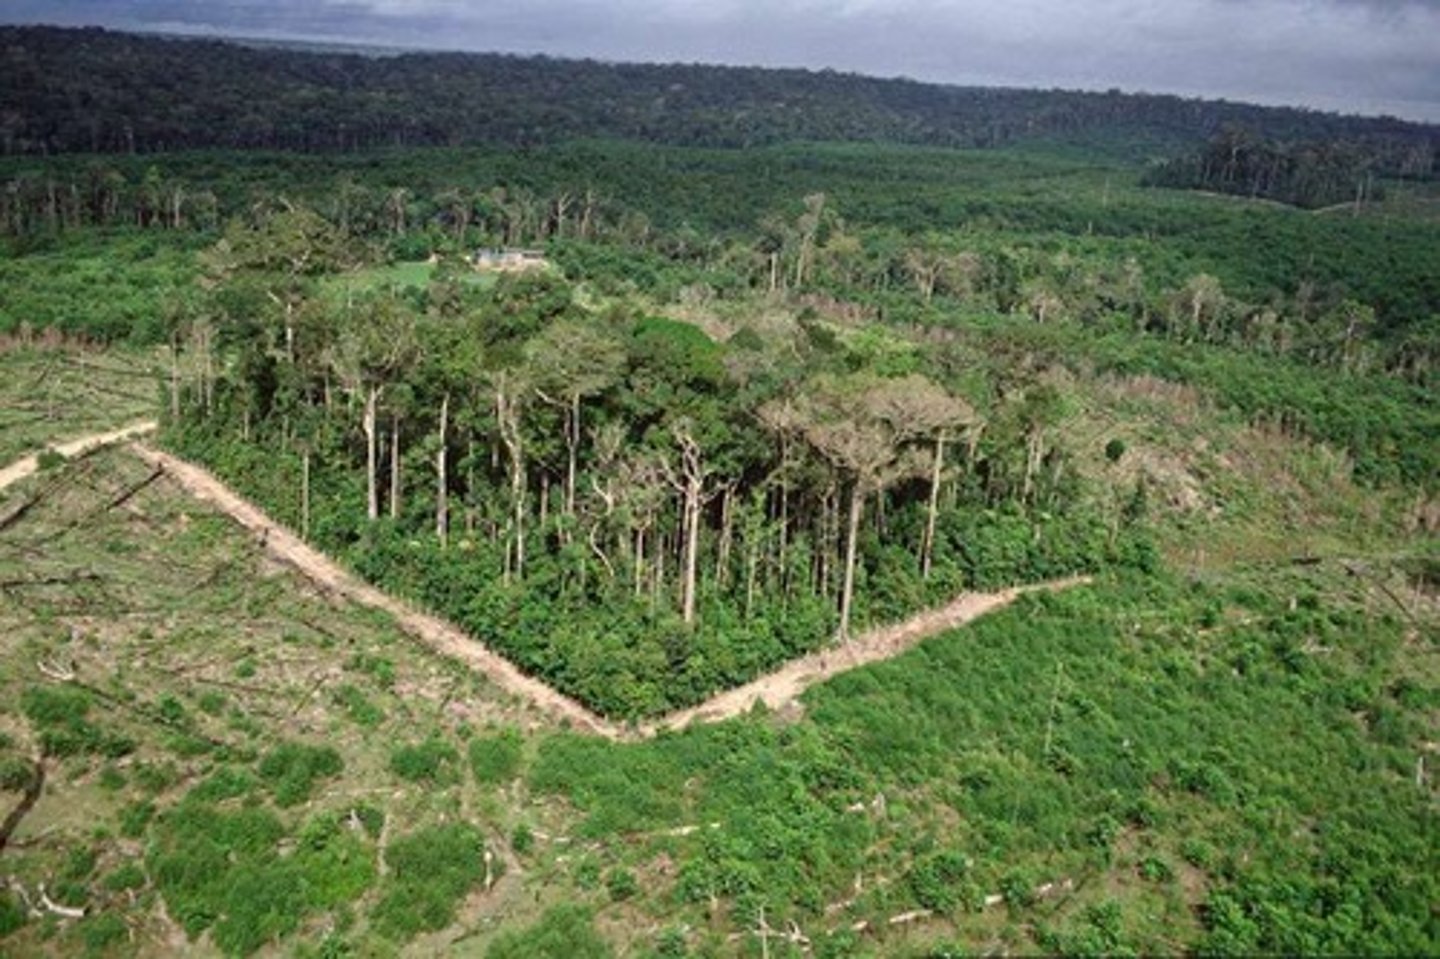
Dynamics of Forest Fragments Project
Study on minimum rainforest area for species diversity.
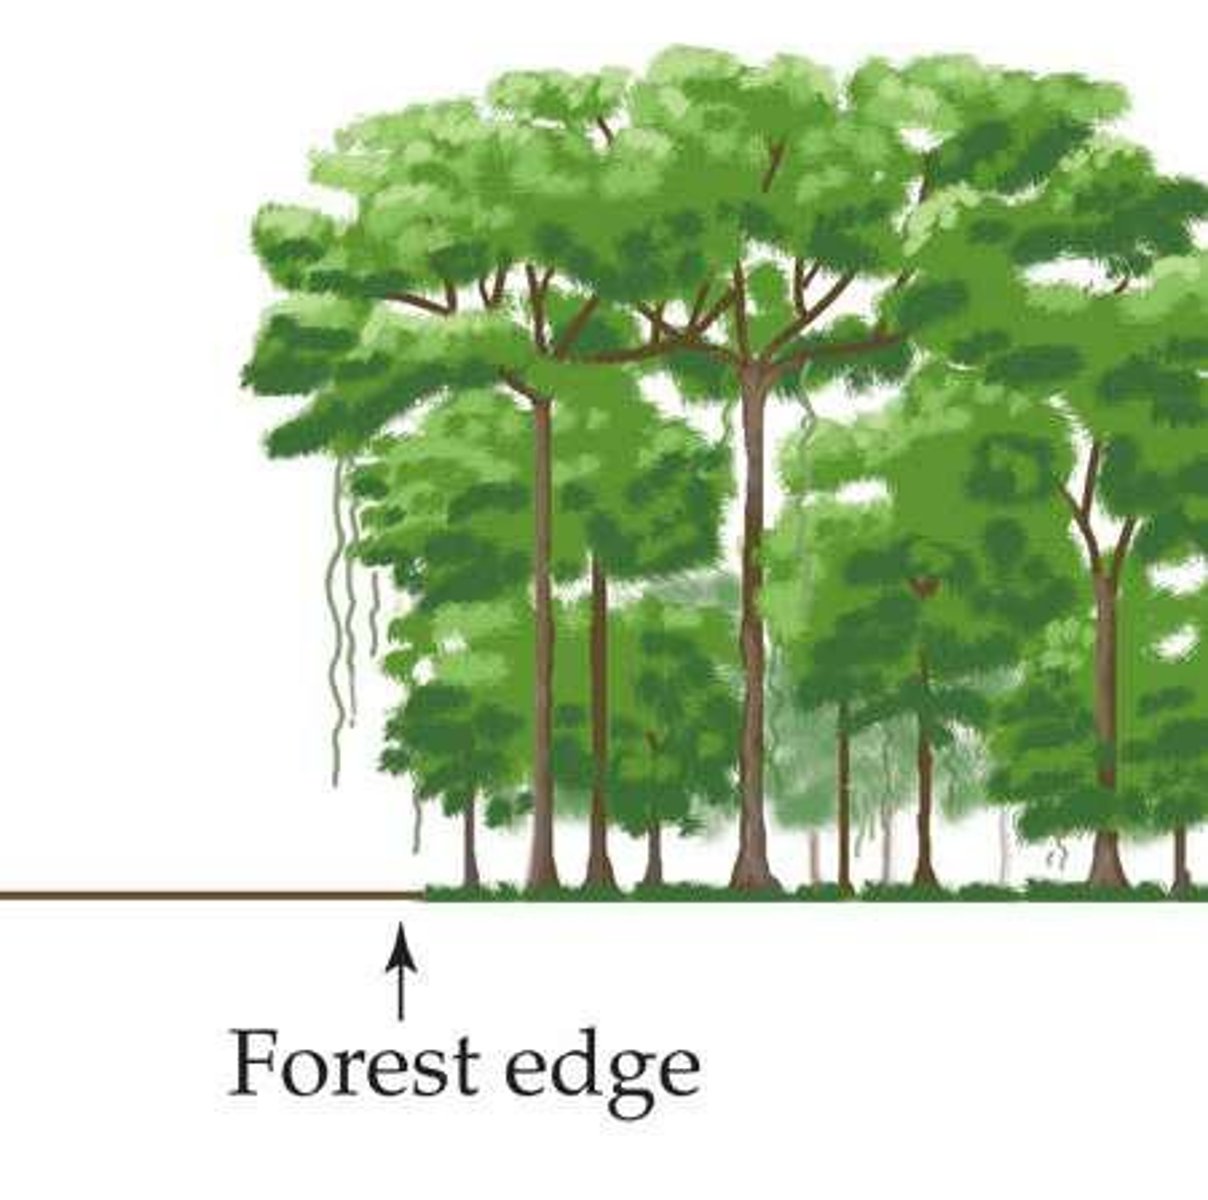
Edge Effects
Changes in species composition due to habitat fragmentation.
Species Diversity
Variety of species within a given area.
Endemic Species
Species unique to a specific geographic location.
Global Scale
Study of species diversity across the entire world.
Regional Scale
Species diversity tied to uniform climate areas.
Landscape Features
Topographic elements influencing species migration and extinction.
Local Scale
Species interactions within a specific community.
Alpha Diversity
Species diversity within a community.
Beta Diversity
Species turnover between different communities.
Gamma Diversity
Total species diversity across a regional pool.
Spatial Scale
Levels of geographic analysis in biogeography.
Species Isolation
Separation of species by geographical barriers.
Speciation Rate
Frequency of new species formation over time.
Extinction Rate
Frequency of species disappearance over time.
Dispersal Limitations
Barriers preventing species from spreading.
Forest Fragmentation
Breaking up of forest into smaller patches.
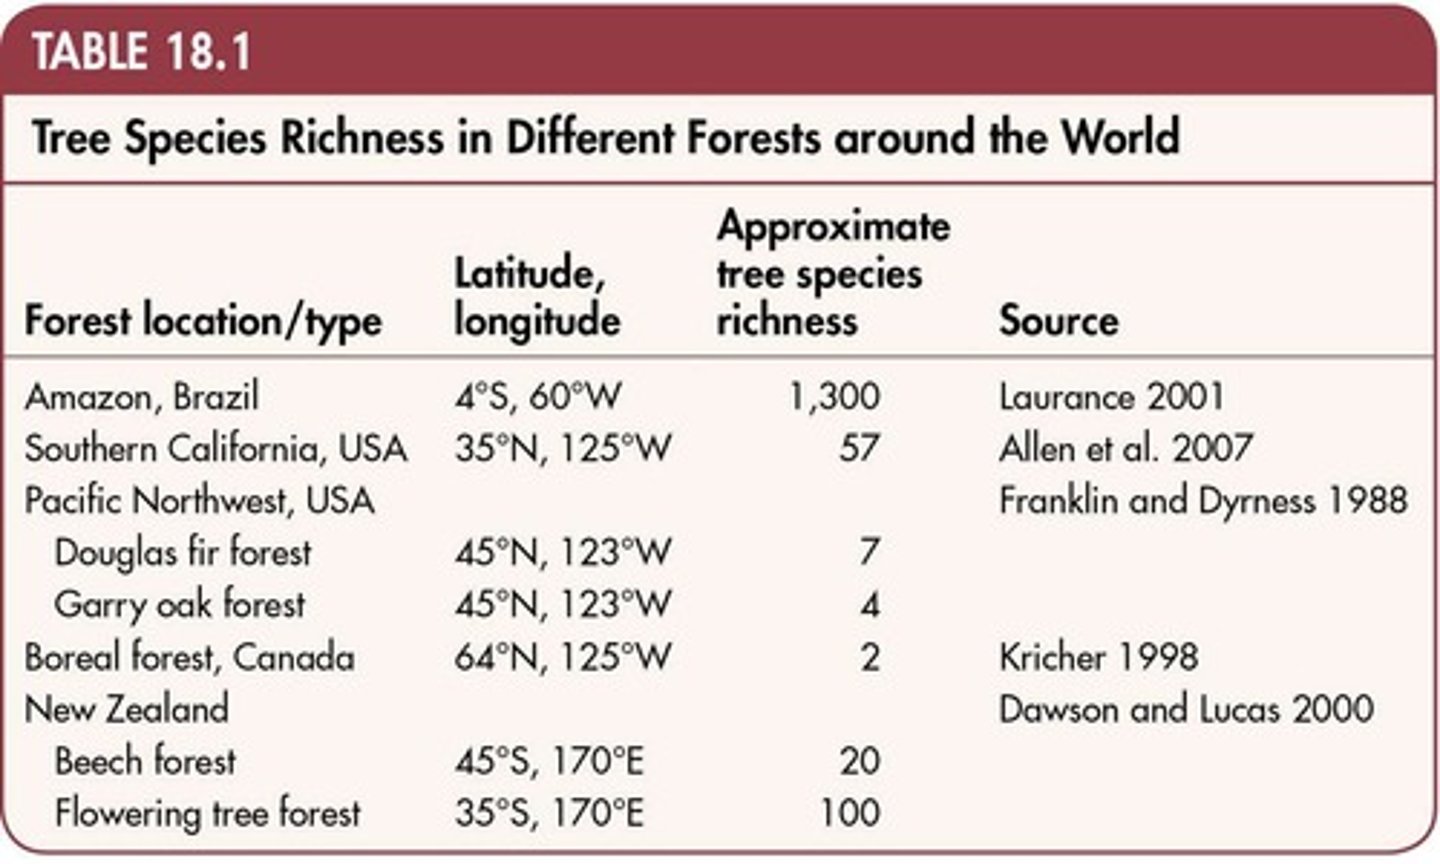
Plant Species Count in Amazon
1,300 tree species identified in the Amazon.
Boreal Forest Species Count
Only 2-3 tree species found in Boreal regions.
Terrestrial plants
Plants that grow on land ecosystems.
Soil bacteria
Bacteria that inhabit soil environments.
Scale of 102-104 m2
Area range for studying local species.
Scale of 102 cm2
Smaller area for local ecological studies.
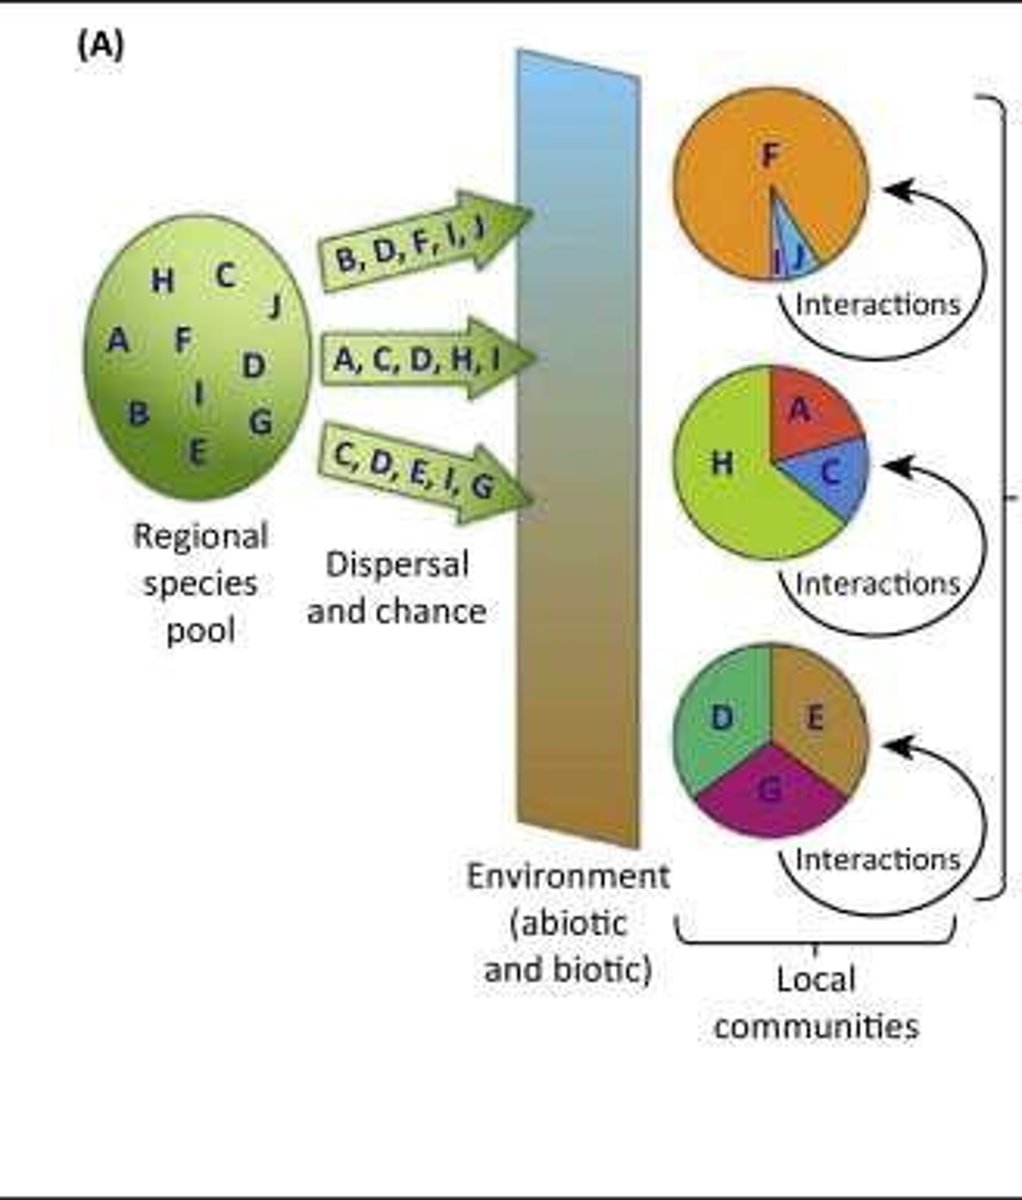
Regional species pool
Source of species for local communities.
Local assemblages
Species communities in a specific area.
Species richness
Number of different species in an area.
Slope = 1
Indicates equal local and regional species diversity.
Saturation point
Limit of species diversity due to local factors.
Witman et al. (2004)
Study on invertebrate communities in various regions.
75% local variation
Explained by the regional species pool influence.
Global patterns of diversity
Influenced by area, isolation, and climate.
Alfred Russel Wallace
Father of biogeography, studied species distributions.
The Geographical Distribution of Animals
Wallace's 1876 publication on species distribution.
Biogeographic regions
Six major areas based on species distribution.
Continental drift
Movement of Earth's tectonic plates over time.
Vicariance
Species separation due to geographical barriers.
Ratites
Flightless birds with a common Gondwana ancestor.
Negative relationship
Higher latitude correlates with lower species diversity.
Seabirds diversity
Highest in temperate and polar latitudes.
Tropical species diversity hypotheses
Three theories explaining high diversity in tropics.
Evolutionary time
Duration of species evolution affecting diversity.
Diversification rate
Speed at which new species evolve.
Carrying Capacity
Maximum population size an environment can sustain.
Species Diversification Rate
Rate at which new species evolve over time.
Species Diversification Time
Duration available for species to evolve.
Tropical Productivity
High biological productivity in tropical regions.
Species-Area Relationship
Species richness increases with area sampled.
Island Biogeography
Study of species distribution on islands.
Equilibrium Theory
Balance between immigration and extinction rates.
Immigration Rate
Frequency of new species arriving in an area.
Extinction Rate
Frequency of species disappearing from an area.
Species-Area Curve
Graph showing species richness vs. area size.
Distance Effect
Species diversity decreases with distance from source.
Krakatau Case Study
Volcanic island recovery observed after 1883 eruption.
Turnover Rate
Rate at which species are replaced in an area.
MacArthur and Wilson
Developers of island biogeography theory.
Climatic Stability
Consistency of climate over long periods.
Population Size
Number of individuals in a species.
Geographic Range
Area occupied by a species.
Local Diversity
Species variety within a specific local area.
Regional Species Pool
Total species available in a region.
Matrix Habitat
Surrounding habitat differing from isolated areas.
Volcanic Island Recovery
Process of species re-colonization after disturbance.
Mangrove Experiment
Study showing species recovery after insect removal.
Species Turnover
Change in species composition over time.
Deep Sea
A habitat with extreme pressure and darkness.
Ecosystem
All biotic and abiotic components influencing energy flow.
Primary Production
Chemical energy generated by autotrophs.
Autotrophs
Organisms converting energy into chemical energy.
Gross Primary Production (GPP)
Total carbon fixed by autotrophs.
Primary Productivity
Rate of primary production in ecosystems.
Leaf Area Index (LAI)
Leaf area per unit ground area.
Photorespiration
Net energy loss in plants during respiration.
Net Primary Production (NPP)
Energy captured by autotrophs minus respiration.
Energy Flow
Movement of energy through an ecosystem.
Biotic Components
Living organisms within an ecosystem.
Abiotic Components
Non-living elements affecting ecosystems.
Photosynthesis
Process converting sunlight into chemical energy.
Chemosynthesis
Energy production using inorganic compounds.
Carbon Currency
Measurement unit for primary production.
Environmental Conditions
Factors influencing plant NPP allocation.
Incremental Gain
Diminishing returns from added leaf layers.
Temperature Effect
High temperatures favor photorespiration over photosynthesis.
Shading Impact
Reduced photosynthesis due to leaf layer shading.
Functional Categories
Grouping organisms by energy acquisition methods.
Lindeman's Paper
1942 work on energy flow in ecosystems.
Net Primary Production (NPP)
Energy available after plant respiration.
Gross Primary Production (GPP)
Total energy captured by photosynthesis.
Respiration
Process adding CO2 to the environment.
Net Ecosystem Exchange (NEE)
GPP minus total respiration measurements.
Chlorophyll
Pigment absorbing light for photosynthesis.
Eddy Covariance
Method measuring CO2 gradients in plant canopies.
Aboveground Biomass
Plant mass above soil level.
Belowground Biomass
Plant mass below soil level.
Nutrient Availability
Essential nutrients affecting plant growth rates.
Water Availability
Moisture levels influencing ecosystem productivity.