Chapter 3: Scatterplots & Correlation
 Call Kai
 Learn
Learn Practice Test
 Spaced Repetition
 Match
Match Flashcards
 Knowt Play
1/13

There's no tags or description
Looks like no tags are added yet.
Name | Mastery | Learn | Test | Matching | Spaced | Call with Kai | Chat |
|---|
No analytics yet
Send a link to your students to track their progress
14 Terms
How do we describe bivariate (two-variable explanatory-response variable) when graphed?
FUDS:
Form
Linear vs. non-linear
Unusual features
Outliers
Gaps
Direction
Positive association vs. negative assoiciation (slope)
Strength
Strong vs. weak correlation
what happens to strength and slope when you switch x and y
strength stays the same; slopes changes
Does changing units (like miles → km) change strength?
no
Correlation coefficient / interpret the value of r
correlation coefficient = r value
measures strength of association (closer to 1 = stronger)
ex: if r = 0.86, say there is a strong, positive relationship btwn x and y
Least Squares Regression Line equation
LSRL: ŷ = a + bx
ŷ = predicted y value
a = y-int
b = slope
Always define ŷ and x; either by saying “where ŷ = ___ and x = ___” or put the actual context in place of ŷ and x and put a hat over the ŷ
To get the LSRL, do stat → calc → #8 (LinReg (a + bx))
Residual equation
Residual= y - ŷ
Residual is the difference btwn an observed value of the response variable and the value predicted by the regression line
If the residual is positive, then the actual value lies ABOVE the predicted value
If the residual is negative, then the actual value lies BELOW the predicted value
Interpret the slope in context
For every increase of one unit in the x, the predicted y will increase/decrease by about slope according to the LSRL
ex: for every increase of one degrees temp, the predicted number of ice creams sold will increase by about 4 according to the LSRL
Interpret the y-intercept in context
When x = 0, the predicted y is y-int according to the LSRL
ex: when it is 0 degrees, the predicted number of ice creams sold is 10 according to the LSRL
Coefficient of determination / interpretation
Coefficient of determination = r2
(r2)% of the variation in y can be explained by x according to the LSRL
ex: if r2 = 0.70 → 70% of the variation in ice creams sold can be explained by temperature according to the LSRL
Get r from r2
Square root r2 as a decimal
If slope is positive, then r is positive
If slope is negative, then r is negative
How to get a residual plot
Put x data in L1
Put y data in L2
Do linreg(ax + b) to store the data in your calculator
Go to L3 → list → RESID
Stat plot → x-list: L1, y-list: L3
Interpret the residual plot
If the data in the residual plot is random and scattered, then a linear model is the best fit for the data
Extrapolation
be careful predicted values outside the data range; the linear relationship may not continue
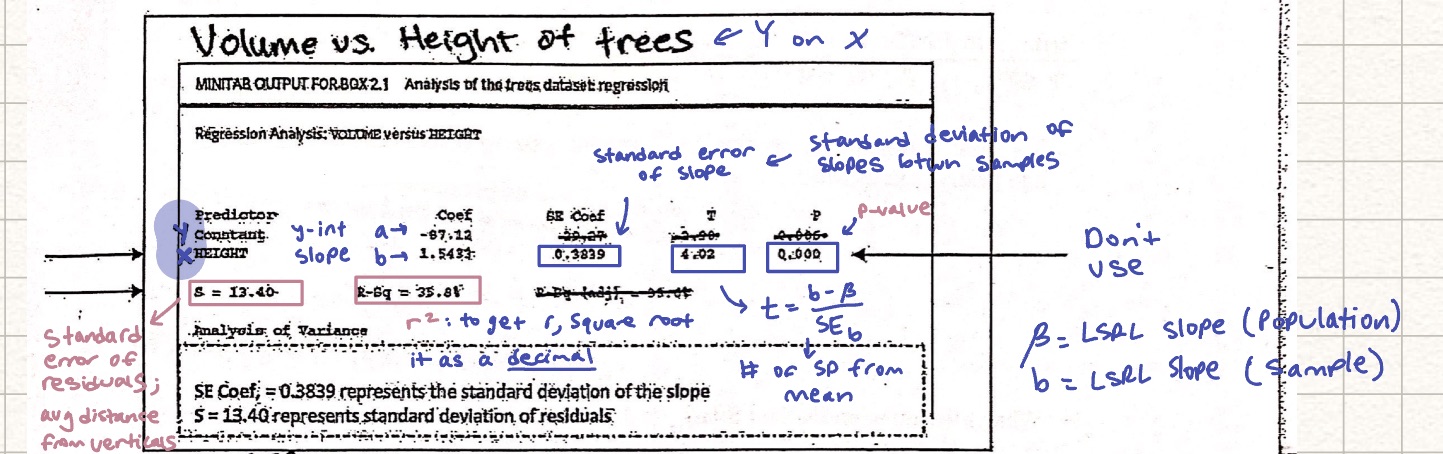
How to read a minitab output