Confidence and uncertainty
1/7
There's no tags or description
Looks like no tags are added yet.
Name | Mastery | Learn | Test | Matching | Spaced |
|---|
No study sessions yet.
8 Terms
probability
likelihood of something happening
probability (a priori)
the probability of an event based on logical reasoning or theoretical analysis, before any empirical data or observation is considered
probability (a posteriori)
the probability of an event occurring after taking into account observed data or evidence.
posteriori probability and sampling distribution
If we know freq distribution - can calculate proportion of values observed within a specified range of values
central limit theorem
states that the sampling distribution of the mean will be approximately normally distributed, regardless of the shape of the population distribution, as long as the sample size is sufficiently large.
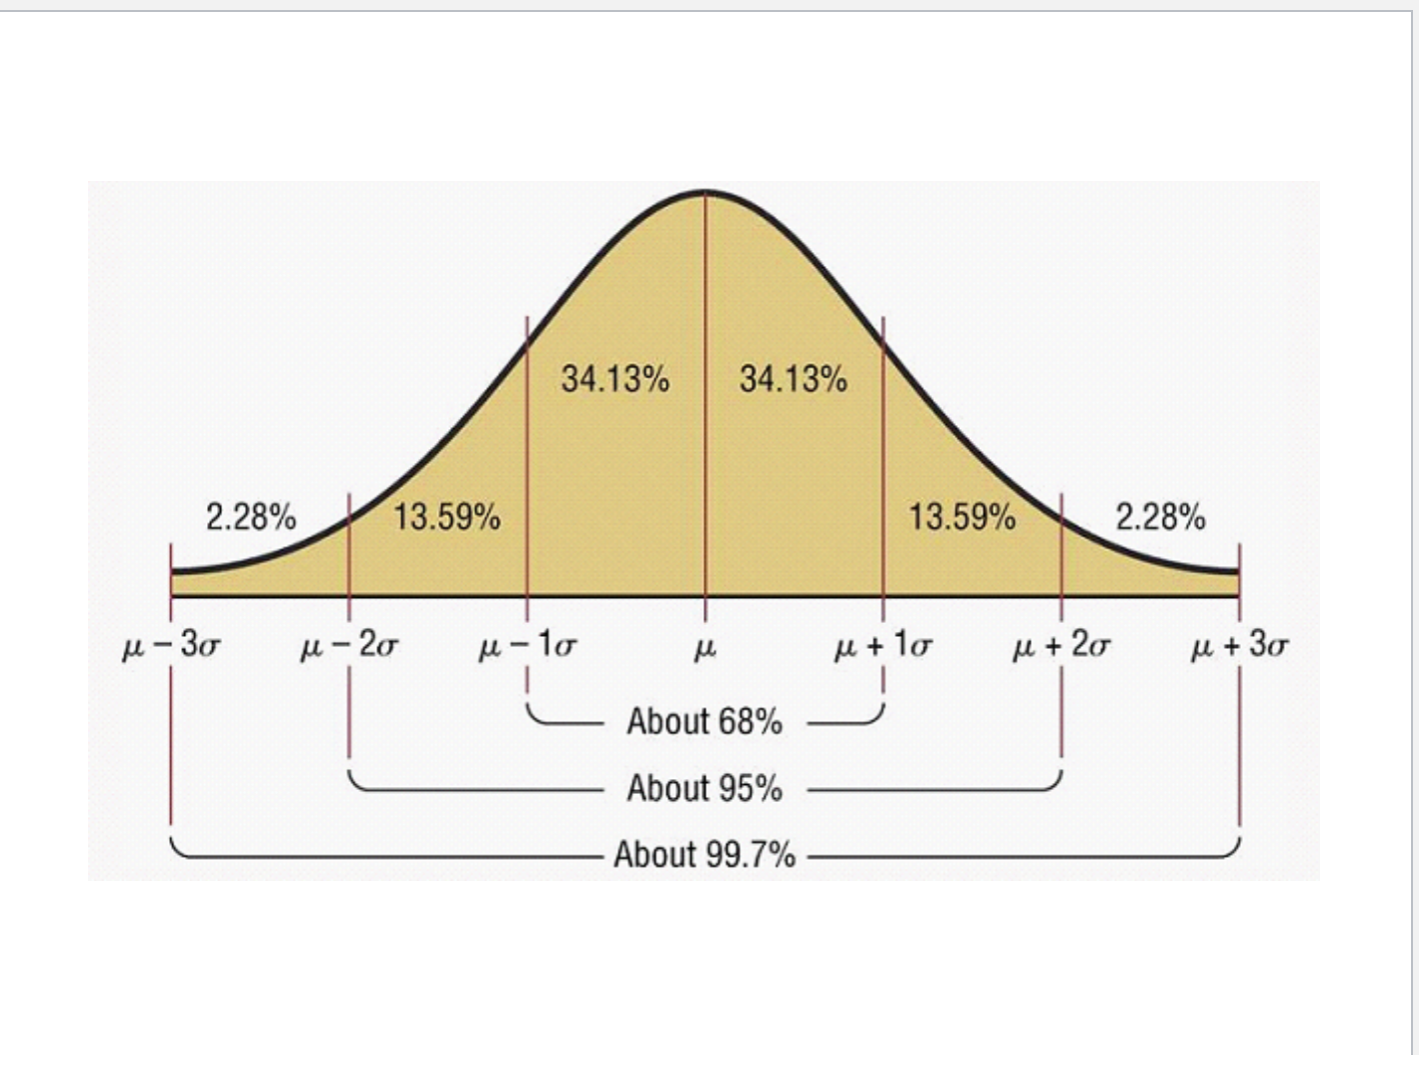
bell shape
calculating probabilities from normal distribution
need to find z value by doing x - mean / std
look at table to find z value
less than = area under the table
greater than = area under the table - 1
between = bigger z value (larger area) - smaller z value (smaller area)
total area under the curve = 1
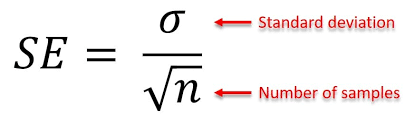
estimating the standard deviation of the sample means
estimated by the standard error
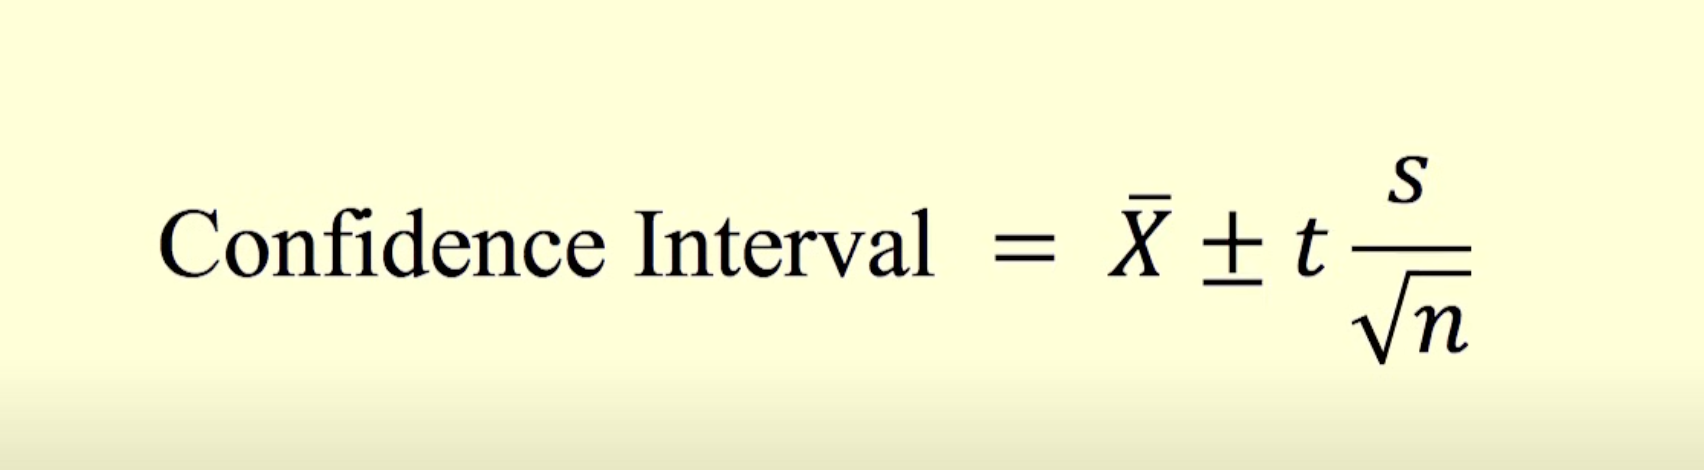
confidence intervals for the mean
range of values - to show uncertainties
the larger the sample size, the smaller the confidence interval
to calculate it need to know how variable means are need to know mean of means from sample
the value of t depends on sample size and chosen level of confidence
the bigger the t value is the bigger the confidence level is