Marketing research exam 3
1/72
There's no tags or description
Looks like no tags are added yet.
Name | Mastery | Learn | Test | Matching | Spaced |
|---|
No study sessions yet.
73 Terms
noncomparative scaling
Each stimulus object (construct) is scaled independently of other objects
No comparison of object to other specific object or"your preferred brand"
2 categories of noncomparative scaling techniques
1) Continuous rating scale
2) itemized ratings
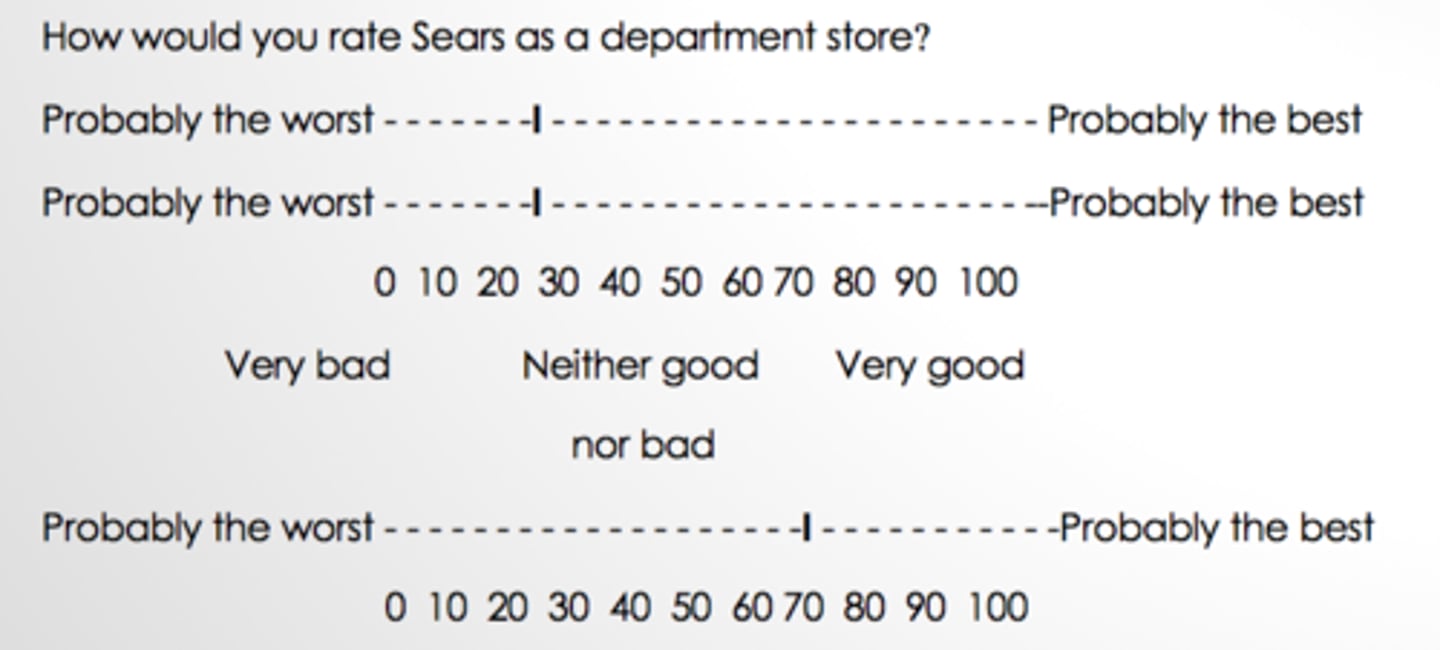
continuous rating scale
Respondents rate objects by placing mark at the appropriate position on a line running from one extreme of a criterion to the other
Not restricted to marks pre-specified by researcher
Once completed, researcher divides line into as many categories desired
Assigns scores based upon categories
EASY to construct but unreliable- we don’t use
itemized ratings
Measurement scale with numbers and/or descriptions with each category
• Categories ordered in terms of scale position
• Respondents select specific categories that best describes object being rated
3 types of itemized ratings techniques
1. likert scale
2. semantic differential scale
3. stapel scale
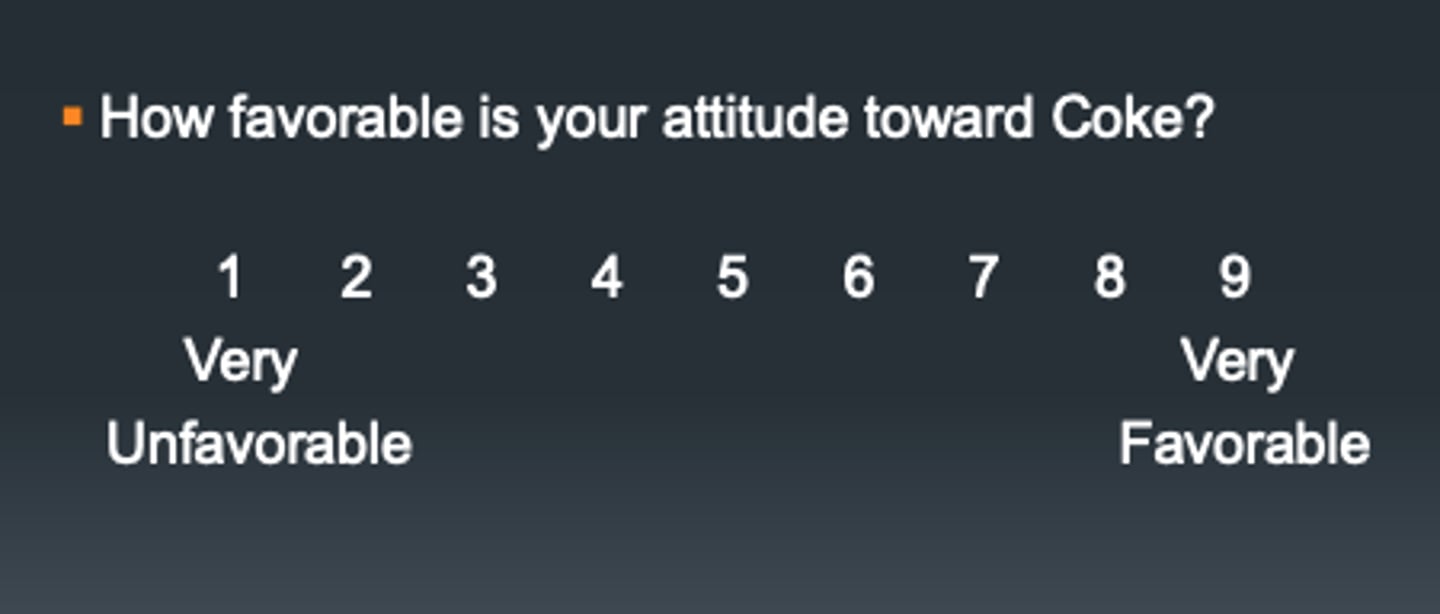
1. Likert scale (itemized rating)
Respondent indicates degree of agreement or disagreement with each of series of statements (5-point)
adv: easy to construct & administer
dis: longer to complete (respondents must read each statement)

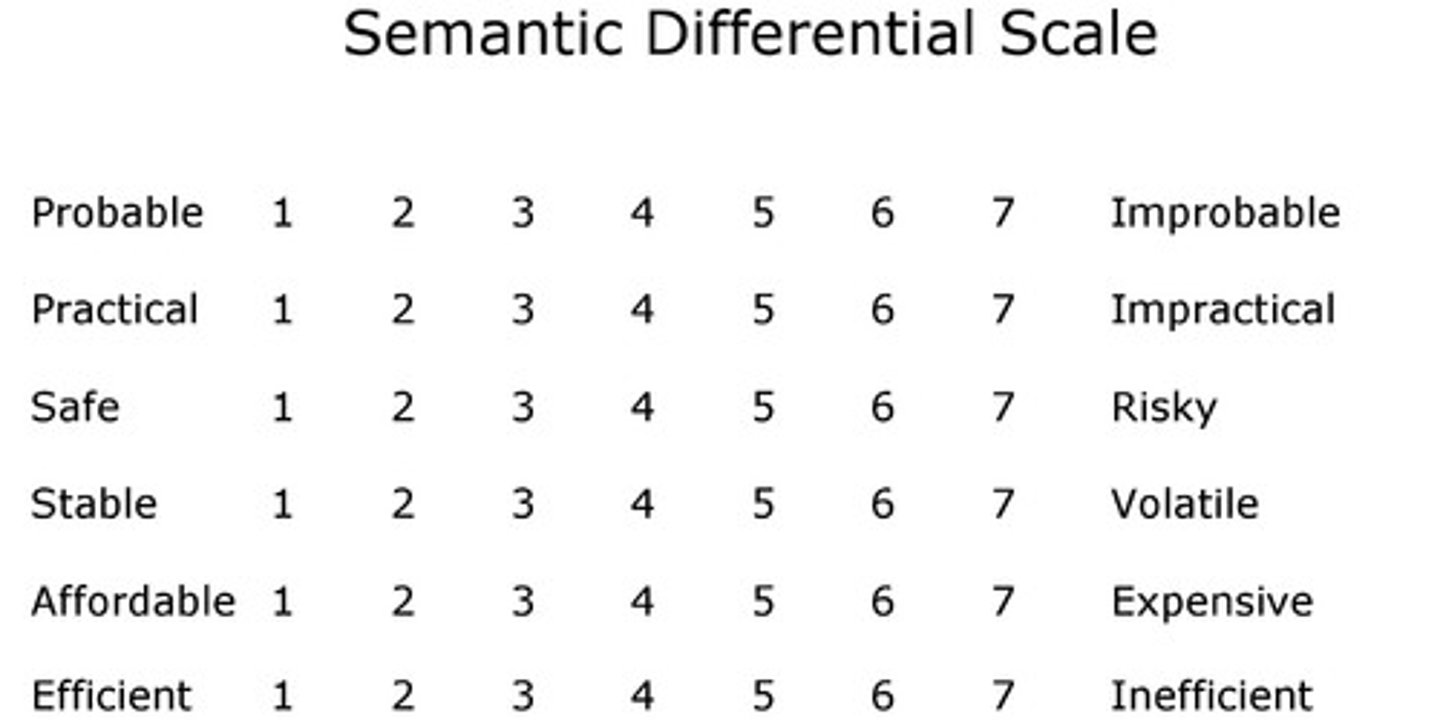
2. semantic differential scale (itemized rating)
7-point rating scale
– Anchors are bipolar (i.e., “opposites”) adjectives in nature- “cold” versus “warm”
– Scales
Positive scales (1 to 7)
Negative and positive (-3 to +3)
– Good for measuring
Brand Image, Personality, Attitude
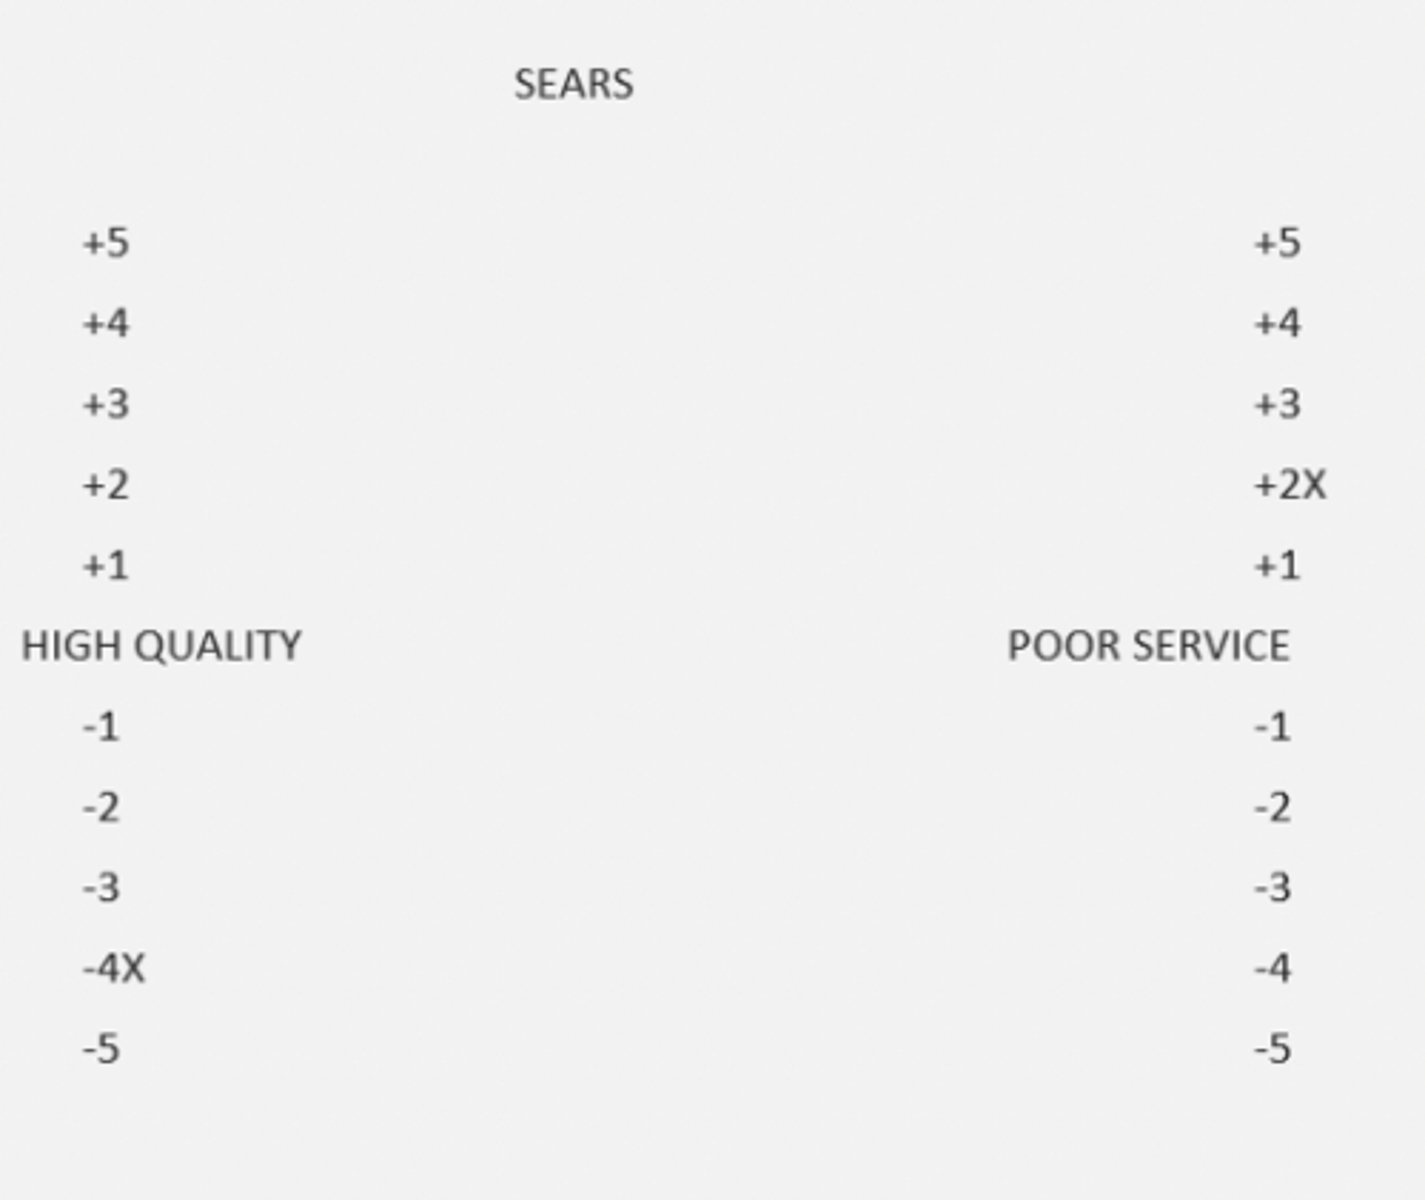
3. stapel scale (itemized rating)
Single adjective in middle of even-numbered range of values for –5 to +5 with no neutral point
Usually presented vertically
Respondents asked how accurately or inaccurately each term describes object
Adv: Since not differential scale in nature
No need to pretest for bipolar anchors
*too few scale options cannot measure accurately
Rating scale decisions (4)
1. number of scale categories
2. balanced vs. unbalanced scales
3. odd vs. even number of categories
4. forced vs non forced choice
1. number of scale categories
Conflicting considerations
– Greater number of scale categories
Better able to detect differences among respondents
– But most respondents can’t handle more than a few categories
Also, may exaggerate differences among respondents
– Lesser number of scale categories
May not detect small differences that actually exist
– Traditional guidelines» Between 5 and 9 categories (7 is most common)
2. balanced vs. unbalanced scales
• Balanced scale– Equal number of favorable and unfavorable categories
• Unbalanced scale– Unequal number of favorable and unfavorable categories
• Traditional guideline– Used balanced to obtain more objective responses
– Use unbalanced if:
Ensure normal distribution if nature of responses are expected to be skewed
But, take into account in analysis
3. odd vs even number of categories
Odd number scales have a middle, or natural category, reducing variability unlike even numbers
an odd numbered scale has a midpoint to include a neutral option
4. forced vs. non forced choice
Forced rating scale
• Absence of “no opinion”– Forces response
• If have no opinion probably mark middle position– But if many have no opinion
Will distort measures of central tendency
– Nonforced rating scale• Use if expect many “no opinions”
multi-item scales
Use of multiple questions (scale items) in order to more completely measure construct of interest
• Construct– Characteristic of interest» Loyalty
– Usually are Latent Variables
Not directly measurable
ex- age, occupation
Steps to Create (multi-item scales)
Develop theoretical definition
Generate initial pool of items
Reduce number of items based on judgment
Collect data from pretest
Statistically assess items
Develop purified scale
Collect additional data from different sample
Evaluate (reliability, validity)
Prepare final scale
measurement accuracy (multi-item scales)
Measurement of characteristic is not true value of characteristic• Is simply an observation of true value
– Measurement error can occur» Variation in information sought and information generated by measurement process
Measurement Error -True Score Model
(Xo = Xt + Xs + Xr)
Xo= observed measurement
Xt = true measurement of characteristic
Xs = systematic error (same effects each time used)
Xr = random error (effects vary each time used)
Random vs Systematic
Reliability (measurement error)
Extent to which scale produces consistent results if repeated measurements are made on characteristic
2 types of error
1) systematic error
2) random error
Systematic error
has no effect on (reliability)
Consistent biases that skew measurements (e.g., poorly worded questions, cultural differences).
random error
Will lower reliability
So, reliability of a scale is the extent to which it is free from random error
Unpredictable, occur due to chance (e.g., respondent misunderstanding, environmental distractions).
Reliability assessment (2)
- test retest
- Internal Consistency Reliability
Test-Retest
- Same respondents are administered same scales at 2 diff time periods (usually 2-4 weeks)
- Degree of similarity of measurements determines degree of reliability (test scales if scales are highly correlated)
Test-Retest rarely used
Measurement (testing) effects
Impractical
Internal Consistency Reliability (reliability assessment)
Each item measuring same construct should be consistent in measurement
split half reliability (internal consistency)
Scale items are divided in half
» Measures from each half are assessed for consistency
» By testing for correlation between each half-scale
- Problem with
» Results are based on how scale items are split
Cronbach's alpha (internal consistency)
Average of all possible split-half coefficients (correlations) resulting from different ways of splitting scale items
– Variation of Coefficient
Range is between 0 and 1.0
Value of .70 is recognized minimum for marketing research
Use of redundant scale items will artificially inflate Cronbach’s Alpha
Validity
Extent to which differences in observed scale scores reflects true differences (accuracy) among constructs being measured
Rather than systematic or random errors
True differences between “Trust” and “Affect”
“Are we measuring what we intend to measure?”
– So, Perfect Validity
No measurement error exists
Validity assessment (2)
(1) Content (face) validity
(2) Construct Validity
(1) Content (face) validity
- Subjective, but systematic evaluation of scale items
- Assess how well content of scale represents measurement task at hand
- Insufficient for formal analysis of validity
(2) Construct Validity
Answers question: “Are we measuring the construct we intend to measure (and not some other construct)?”
Factor analysis employed to assess
Construct validity assessment
(2a) Convergent Validity
(2b) Discriminant Validity
(2a) Convergent Validity
Extent to which the scale correlates positively with other measures of same construct
(2b) Discriminant Validity
Extent to which a measure does not correlate with other measures used to measure other constructs from which it is supposed to differ
Relationship between Reliability and Validity
• If scale is perfectly Valid
– Then there is no measurement error
» Then scale is perfectly reliable
• If scale is perfectly Reliable
– Then absence of random error– But systematic error could still exist
» So, not necessarily perfectly valid
Generalizability
- Extent to which measurement results obtained from a sample can be applied to a population of interest
– Assumes high reliability and validity– Entire environment within sample must equal that of population» Randomized sample
findings must be a reflection of ______________?
reality
frequency distribution
Examination of a single variable
- A count of number of responses associated with different values of the variable
-Includes for each possible value (response):
frequency counts, percentages, cumulative percentage
uses of frequency distribution
Determine extent of nonresponse (“missing”)
– Identify illegitimate responses• Those outside range of response options
– Identification of outliers
– Assess shape of distribution
• Through use of Frequency Histogram
statistics used (frequency distribution) measures of location
Mean
Mode
Median
measures of central tendency
describes center of distribution
measures of variability
indicates dispersion of distribution
includes:
range
variance
standard deviation
range
difference between smallest and largest value in sample
measures spread of data
variance
Based on deviation from the mean
Difference from mean and observed value
Variance is the mean squared deviation from mean for all values (divided by [n - 1] )
standard deviation
square root of variance
expressed in same units of data (since not squared)
measures of shape
assess nature of distribution
- to identify appropriate statistical analysis techniques (normal distribution)
-skewness
normal distribution (measures of shape)
Bell-shaped curve
– Values are same above and below mean
» Mean = mode = median
» Deviations from mean is same for above and below mean
skewness (measures of shape)
- deviations from the mean are not equal for above or below mean
- is the tendency of the deviations from the mean to be larger in one direction
hypothesis testing steps
1. Formulate hypothesis
2. Select appropriate test (all 2 tail)
3. Choose level of significance
4. Collect data and calculate test statistic
5. Determine the probability
6. & 7. Compare critical value and make decision
8. Marketing research conclusion
types of hypotheses
null hypothesis (H0)
alternative hypothesis (H1)
null hypothesis (H0)
assumes status quo
no difference or effect --> The null hypothesis is assumed true until there is sufficient evidence to reject it.
alternative hypothesis (H1)
- opposite of null
- some differences or effect expected (usually only stated in research)
main type of testing **
two-tailed test:
if testing for any differences from mean
- either greater than or less than
2. select appropriate test (hypothesis testing)
Based upon nature of data and distribution
• Example: if testing for differences between means and:
– Have normal distribution» and– Variance of population is known
» Use of z-test
– If not know above assumptions:» Use t-test
type I error (alpha error)
Rejection of null when is actually true (court system)
Tolerable risk of committing type I error
Known as level of significance
Type II Error (beta error)
Null hypothesis not rejected when is actually false
Not set by researcher
step 4. collect data and calculate test statistic
sample size depends upon
- quantitative factors (desired alpha and beta errors)
- qualitative factors (past research, budget, etc)
- calculate statistic (ex: t statistic)
for 2-tailed testing:
- If z-stat (calculated) ≥ z (critical value [1.645]), then reject null
- Or, if t-stat (calculated) ≥ 1.96, then reject null
T value is 1.96 or higher → __________
REJECT the null hypothesis
correlation (Pearson's correlation coefficient r)
Summarizes the strength of association between two metric (continuous) variables
- r is between -1.0 and 1.0
Closer to 1 the stronger the strength - closer to zero the weaker the strength
Covariance between X and Y are divided by the standard deviation of X and Y
Can directly compare correlations between variables
covariance
Signifies a systematic relationship between two variables- In which a change in one implies a corresponding change in the other» Analysis of the relationship between the variances of two variables
regression analysis
Analyzes associative relationships between a metric dependent variable and one or more independent variables
regression analysis can assess:
If relationships exist
Strength of relationships
Structure of relationships
Prediction of value of dependent variable
Control for variables which are not of interest
bivariate regression
Derives mathematical relationship, in form of equation, between one metric dependent variable and one metric independent variable
--> Similar to correlation
least squares procedure
used to identify best fitting straight line to scattergram
--> minimizes sum of squared errors
statistics involved (bivariate regression)
- coefficient of determination
- standard error (SE)
- standardized regression coefficient (beta)
- sum of squared errors
- t statistic
coefficient of determination (r^2)
-measures strength of association
- range: 0 to 1
signifies proportion of variation in Y accounted for by variation in X
standard error (SE)
standard deviation of regression coefficient (beta-b)
standardized regression coefficient (beta coefficient)
slope obtained by the regression of Y on X when data is standardized
sum of squared errors
distance of all points from the regression line are squared and summed --> measurement of total error
t statistic =
slope / standard deviation
used to test null hypothesis regarding existence of relationship
X and y are ________ related
linearly
multiple regression
2 or more independent variables and one metric dependent variable
Able to assess impact of multiple X variables on Y variable given the simultaneous impacts of all X variables on Y variable
Statistics involved (multiple regression)
- adjusted r squared
- f test