Economics: Production Functions, Costs, and Profit Analysis
1/27
There's no tags or description
Looks like no tags are added yet.
Name | Mastery | Learn | Test | Matching | Spaced | Call with Kai |
|---|
No analytics yet
Send a link to your students to track their progress
28 Terms
Production Function
relationship between quantity produced and how many inputs (Q and L)
Firm
Organization that produces goods and services for sale
Product Curve
The change in output that results from employing an added unit of labor. MPL (∆Q/∆L). An illustration of the production function.
When does MPL reach max production?
When MPL = 0
When does a graph experience "increasing returns"
when slope is increasing
When slope is negative
graph experience "inflation" ,negative returns
slope is decreasing, but still positive. (inflection point)
graph experience "diminishing returns"
Explicit cost
Costs a business or individual receive when they directly pay for somth (visible)
Implicit cost
Costs an individual incurs when they choose one alternative over the other. (doesn't always relate to money)eg: if u open a bakery, costs of being able to win a salary from a standard 9-5
fixed input
an input whose quantity is fixed for a period of time and cannot be changed (in the short run at least one is fixed)
varied input
input whose quantity is can change at any time. (In the long run all inputs are varied)
short run
at least one input is fixed.
long run
all inputs can be changed (varied)
Fixed Cost
Independent of output (expenses that remain constant no matter the lvl of production)
Variable cost
dependent on output (eg output goes down cost goes down vice versa)
Opportunity Cost
Explicit + Implicit
Accounting Profit
total revenue - explicit costs
Total Revenue
Profit x Quantity
Economic Profit
Total Revenue - Opportunity cost
Normal Profit
Economic Profit = 0
EP>0
Good choice
EP<0
pick another alternative
Total Cost
fixed cost + variable cost
Marginal Cost
∆TC/∆Q
Fixed cost = Total cost
When quantity = 0
Average Fixed Cost
FC/Q
Economies of scale
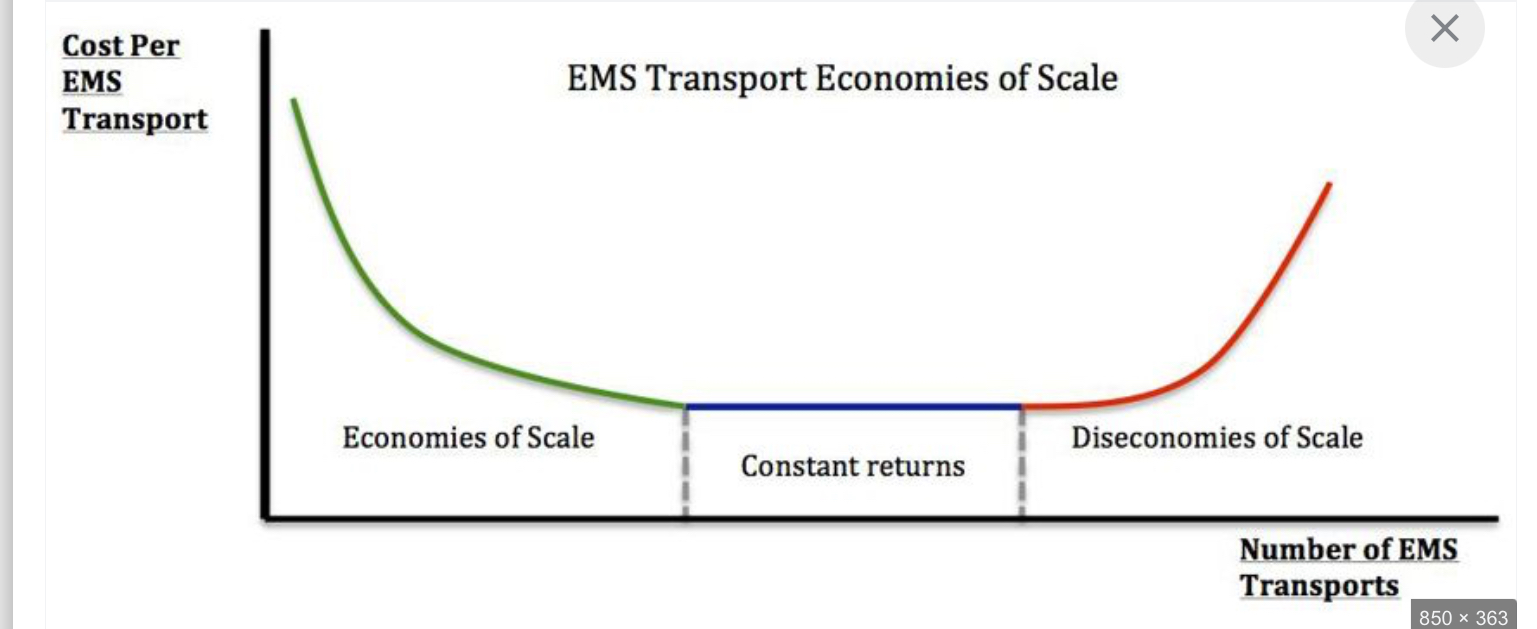
Diminishing returns
benefit from adding one more unit of input eventually decreases