Reliability and validity
1/11
There's no tags or description
Looks like no tags are added yet.
Name | Mastery | Learn | Test | Matching | Spaced |
|---|
No study sessions yet.
12 Terms
Define measurement error
The difference between the true value and observed value
What you actually measured vs true value
What is causing the measured value to be different from the true value
X = T +/- E
X = observed measurement
T = actual value (true score)
What you would have gotten under perfect conditions
E = error component
Difference between true and observed
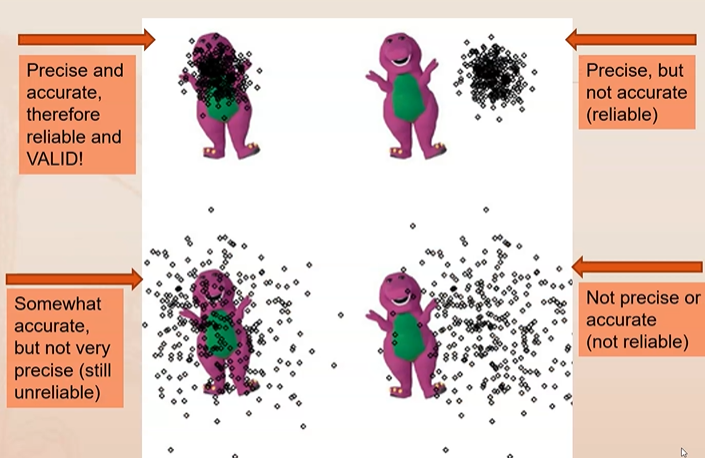
Define reliability
The extent to which a measurement is consistent
Reproducibility, dependability, consistency
The FUNDAMENTAL to measurement
Give confidence in data but DOESN’T guarantee accuracy
Allows us to assume changes are due to independent variable and NOT an error
Take measurements over and over again
Variances should be small between values
Affected by random error
As random errors decrease, observed measurement moves closer to true value (making measurement more reliable)
Affects validity
Reliably late
Consistently inaccurate
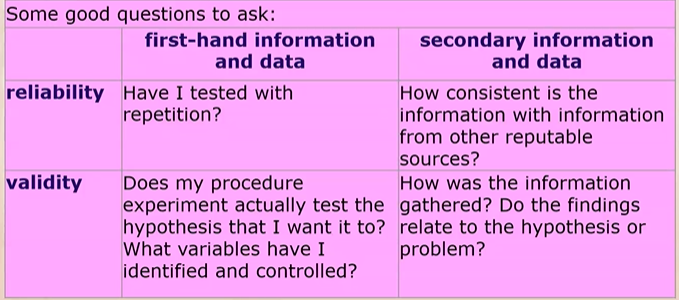
Define validity
Ensures that a test is measuring what it is intended to measure
Related to accuracy
Are you measuring what you think you’re measuring?
Implies reliability
Implies that a measurement is relatively free from error
A valid test is also reliable
Low reliability = NOT VALID (low validity)
Strong reliability does not guarantee strong validity
Affected by systematic error & extreme random error
Systematic = although measurement may be consistent, they may not be accurate
Random = inconsistent instrument cannot produce meaningful measurements
Two types
Internal = the degree to which the changes in the dependent variable are the result of manipulation of the independent variable
Within study/experiment
External = the degree to which the results of your sample can be inferred to the general population
Applying results to overall population
Define accuracy
Agreement between measured result and actual/true value
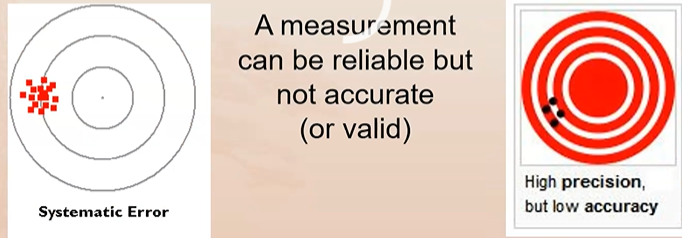
Affected by systematic error
A measurement can be reliable but NOT accurate (valid)
*Considered accurate when they’re on the bullseye
Define precision
Repeatability or reproducibility of measurement
Consistent value does NOT imply correct value
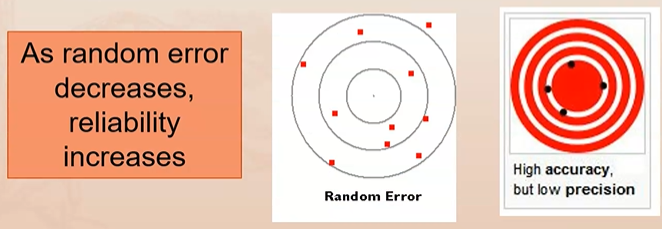
Affected by random error
As random error decreases, reliability increases
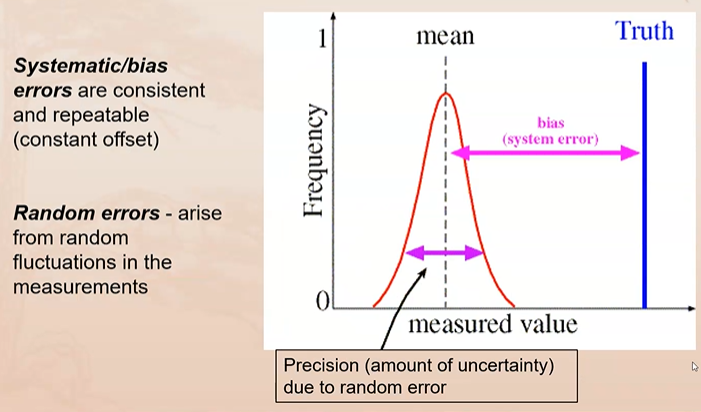
Define systematic error
Consistent over or under estimation of the true value
Predictable
Consistent and repeatable (constant offset)
Affects accuracy
Ex: deteriorating reagents & consistently high/low control values
Define random error
Error due to chance, unpredictable
Assumed that if enough measurements are made, random error eventually “cancel out”
Arise from random fluctuations in measurements
Affects precision & reliability
Ex: human error, mechanical inaccuracy, simple mistakes, temp changes
What is “regression toward the mean”
Regression towards the mean = rare or extreme data points, are usually followed by data that’s closer to the mean
Must consider “extremeness” of measured scores when examining effect of error on reliability
High and low measurements
High = high positive error
Low = high negative error
Second measurement often shows less extreme value (closer to the mean)
The more often data points taken, extremeness moves closer to mean
Pre-test vs post-test
What are examples of regression fallacy?
“a type of logical error where someone mistakenly assumes a cause-and-effect relationship exists when it doesn't, particularly in situations involving natural fluctuations and regression to the mean”
What is the difference between statistically significant and clinically significant?
Statistically significant does NOT necessary mean clinically significant
Define minimal clinically significant difference (MCID)
MCID = the smallest different in a measured variable that signifies an important rather than trivial difference in the patient’s condition
Ex: HIV viral load monitoring
Results must be 3-fold change
Amount of change necessary to see a change in a clinical presentation
Looking at the picture…
* A is the only one that is statistically and clinically significant
* C has a statistical significance
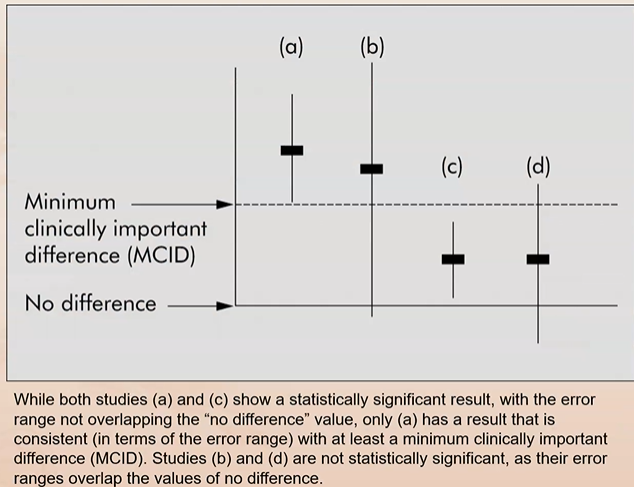

What do each of the images represent
Look at the image