UNIT 7 APBio Final Exam
1/111
Earn XP
Description and Tags
CB 1-8: 7; 7.1-3,10, 7.2, 7.4, 7.10,v7.4-5, 7.6, 7.9 intro, 7.9, 7.10, 7.11, 7.12, U7 progress check mcq A, U7 progress check mcq B
Name | Mastery | Learn | Test | Matching | Spaced | Call with Kai |
|---|
No analytics yet
Send a link to your students to track their progress
112 Terms
Which of the following is probably the best explanation for the fact that Antarctic penguins cannot fly, although there is evidence that millions of years ago their ancestors could do so?
A) Penguins live on land and feed in the water; therefore they have no need to fly.
B) The Antarctic home of penguins is flat and barren; therefore there is no place to fly.
C) Ancestral penguins without large wings were better able to swim and feed in the water; therefore they passed their genes for shorter wing structure on to their offspring.
D) Ancestral penguins did not use their wings for long periods of time; therefore today’s penguins have only tiny, nonfunctional wings.
E) The cold and wind of Antarctica make flight impossible; therefore penguins that live there have lost the ability to fly.
C) Ancestral penguins without large wings were better able to swim and feed in the water; therefore they passed their genes for shorter wing structure on to their offspring.
A biologist spent many years researching the rate of evolutionary change in the finch populations of a group of islands. It was determined that the average beak size (both length and mass) of finches in a certain population increased dramatically during an intense drought between 1981 and 1987. During the drought, there was a reduction in the number of plants producing thin-walled seeds.
Which of the following statements might best explain the increase in average beak size in the finch population during the drought?
A) Finches with bigger beaks are better able to crack thick-walled seeds and produce more surviving offspring.
B) Finches with bigger beaks can attack and kill finches with smaller beaks.
C) Finches with bigger beaks possess more powerful flight muscles and are able to find more food.
D) Finches that crack large seeds develop larger beaks over time.
A) Finches with bigger beaks are better able to crack thick-walled seeds and produce more surviving offspring.
A biologist spent many years researching the rate of evolutionary change in the finch populations of a group of islands. It was determined that the average beak size (both length and mass) of finches in a certain population increased dramatically during an intense drought between 1981 and 1987. During the drought, there was a reduction in the number of plants producing thin-walled seeds.
The biologist discovered that from 1988 to 1993, the average beak size declined to pre-1981 levels. The reversal in beak size from 1988 to 1993 was most likely related to which of the following events?
A) A loss of food supply for the finches
B) The end of the drought
C) An increase in drought conditions
D) An increase in predators consuming finches
B) The end of the drought
the food supply would increase for finches post-drought
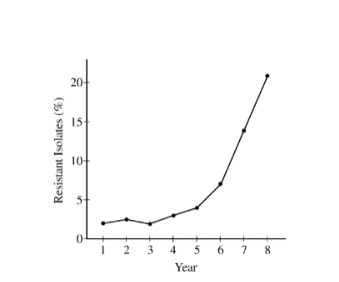
Over several years, bacteria were isolated from members of a human population and tested for antibiotic resistance. The percent of bacterial isolates that were found to be antibiotic resistant is presented in the graph above for each year of the study. Which of the following conclusions is best supported by the information presented in the graph?
A) The greatest increase in antibiotic resistance occurred from the first year to the third year of the study.
B) gene flow in the population occurred at the same rate for the entire duration of the eight-year study.
C) Because evolution in bacterial populations occurs over millions of years, the results are due to random variation.
D) Natural selection over multiple generations is favoring antibiotic resistance in the population of bacteria.
D) Natural selection over multiple generations is favoring antibiotic resistance in the population of bacteria.
reminder: gene flow is the movement of genetic materials from one population of species to another
Ciprofloxacin is given as an antibiotic to healthy livestock to promote efficient weight gain. Strains of the bacterium Campylobacter jejuni naturally colonize the digestive tracts of livestock, and the C. jejuni can be transferred to people through the handling and consumption of contaminated meat. People infected with C. jejuni also are treated with ciprofloxacin.
Which of the following is the most likely consequence of adding ciprofloxacin to animal feed?
A) Naturally occurring strains of C. jejuni will reproduce more rapidly in the digestive tracts of livestock, reducing the risk of food-borne illnesses in people.
B) Ciprofloxacin-resistant strains of C. jejuni will have a selective advantage in the digestive tracts of livestock, increasing the risk of serious infections in people.
C) Ciprofloxacin-sensitive strains of C. jejuni will be consumed in meat that contains a chemical that inhibits bacterial growth, reducing the risk of food poisoning in people.
D) Actively growing strains of C. jejuni will metabolize the nutrients in meat produced by livestock operations, increasing the risk of protein deficiencies in people.
B) Ciprofloxacin-resistant strains of C. jejuni will have a selective advantage in the digestive tracts of livestock, increasing the risk of serious infections in people.
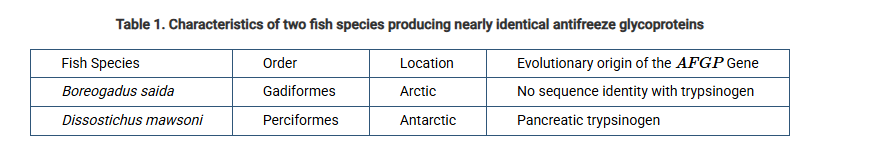
Two species of fish that live in extremely cold environments produce near-identical antifreeze glycoproteins, called AFGPs. Scientists have determined the origins of the AFGP gene in both species. Selected characteristics of the two fish species are provided in Table 1.
Based on the information in Table 1, which of the following statements best describes the production of nearly identical AFGPs in these two species of fish?
A)The fish eat the same type of food, which resulted in the evolution of similar digestive proteins.
B) The fish live in environments with similar selective pressures, and those that produce AFGPs are better able to survive.
C) The Antarctic fish species evolved into a separate species after being geographically isolated from the Arctic population because of commercial fishing.
D) The production of AFGPs similar was due to random splicing of exons in both species.
B) The fish live in environments with similar selective pressures, and those that produce AFGPs are better able to survive.
A researcher is studying two different species. Which of the following sets of observations would best support the claim that the two species have structural similarities as a result of convergent evolution?
A)
Genetic Similarity | Function of Structure | Form of Structure |
Low | Same | Different |
B)
Genetic Similarity | Function of Structure | Form of Structure |
Low | Different | Same |
C)
Genetic Similarity | Function of Structure | Form of Structure |
High | Same | Different |
D)
Genetic Similarity | Function of Structure | Form of Structure |
High | Different | Same |
A)
Genetic Similarity | Function of Structure | Form of Structure |
Low | Same | Different |
convergent evolution: unrelated species that evolve to have similar traits due to species living in the same environment or endure similar environmental pressures
ex: wings in birds and bats; both have similar function to fly, but their wings evolved differently
Sugar gliders and Northern flying squirrels are mammals that have many morphological similarities despite being genetically different. Both are nocturnal and have large eyes to help them see in the dark. Both live in trees and have flaps of skin connecting their front and back legs, and when their front and back legs are extended, the flaps allow the animals to glide from one tree branch to another. Sugar gliders are native to Australia, and Northern flying squirrels are native to North America.
Which of the following best explains the morphological similarities between these two species?
A) The similarities in traits indicate the species are the result of divergent evolution from a common ancestor that had the same traits that these two species share.
B) The traits evolved through sympatric speciation, which often results in species being highly similar because they evolve in the same area.
C) The two species evolved as the result of two separate bottleneck events that reduced the existing populations to a few individuals who happened to have the same traits.
D) The similarities between the species evolved independently as a result of similar selective pressures in each species’ environment.
D) The similarities between the species evolved independently as a result of similar selective pressures in each species’ environment.
reminder: sympatric speciation; populations live in same area-no physical barrier
allopatric speciation; populations geographically isolated from eachother
In Darwinian terms, the fittest individuals of a species are those that
A) attract the most mates
B) grow to the largest size
C) are best adapted to the temperature extremes to which they are exposed
D) are best equipped to cope with the predators to which they are exposed
E) leave the greatest number of reproducing descendants
E) leave the greatest number of reproducing descendants
Poaching is the illegal hunting or capturing of wild animals. Both male and female African elephants have tusks that are a significant source of ivory used for ornaments and jewelry.
Assuming that the size of the tusks is heritable, which of the following is the most likely long-term effect of poachers targeting African elephants with large tusks?
A) An increase in average tusk size because of the need to provide more ivory for the poaching hunters
B) A decrease in average tusk size because elephants with large tusks are less likely to survive to reproduce
C) An increase in average tusk size to provide the elephants with a defensive mechanism against poachers
D) A decrease in average tusk size to reduce the energy investment in the tusks
B) A decrease in average tusk size because elephants with large tusks are less likely to survive to reproduce
In plants, members of the euphorbia family and the cactus family have separate origins, with the euphorbia evolving in the desert regions of Asia and Africa and the cacti in the desert regions of the Americas. Both have fleshy stems adapted for water storage, protective spines, and leaves that are greatly reduced or absent. The similarities between these two families of plants represent an example of
A) coevolution
B) convergent evolution
C) genetic drift
D) sympatric speciation
E) balanced polymorphism
B) convergent evolution
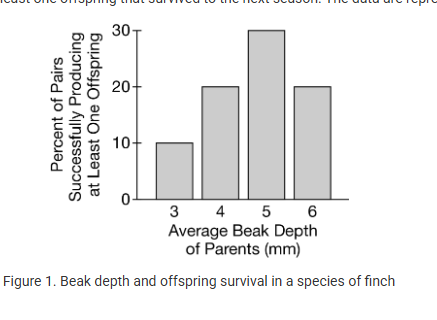
Scientists investigated the role that beak depth plays in the ability of one species of seed-eating finch to reproduce. The scientists calculated the average beak depth of finches in mating pairs and then observed whether or not the pairs produced at least one offspring that survived to the next season. The data are represented in Figure 1.
Based on the data in Figure 1, which of the following best describes the concept illustrated?
A) Parental pairs with a specific beak depth had the highest reproductive fitness.
B) Parental pairs with a specific beak depth ate the most nutritious seeds.
C) Finches with a certain beak depth rarely find mates.
D) Increasing average beak depth results in increasing finch fitness.
A) Parental pairs with a specific beak depth had the highest reproductive fitness.
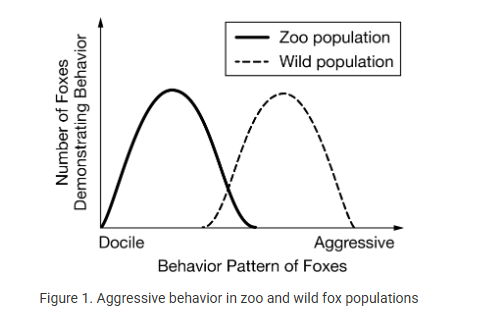
Over many years of a breeding program, a zoo has an established population of foxes that is well adapted for living in captivity. A representative sample of wild foxes from the neighboring forest was used to start the zoo population. A study was conducted to compare the behavior of the zoo fox population with the wild fox population in the neighboring forest. The behaviors of equal numbers of foxes from each population were assessed. Each fox’s behavior was scored on a continuum from docile to aggressive based on its interaction with a trained behaviorist. The data is shown in Figure 1.
The phenotypic variation in behavior between the two populations can best be described as resulting from
A) s-xual selection
B) natural selection
C) artificial selection
D) genetic drift
C) artificial selection
reminder: genetic drift; a random change in allele frequencies due to chance, especially in small populations.
the breeding program prevents offspring varieties due to chance
A small number of lizards from a mainland population have been deposited on four isolated islands because of the effects of a rare strong storm.
Which of the following best predicts the outcome of these lizards reproducing for many generations on the islands?
A) Courtship rituals specific to each island lizard species prevent the lizards from interbreeding.
B) Speciation results from bottleneck events that happened before the ancestral species reached the islands.
C) The different species that currently exist are the result of hybridization between lizards from different islands.
D) The isolation prevents gene flow; thus, the lizards on different islands experience prezygotic isolation.
D) The isolation prevents gene flow; thus, the lizards on different islands experience prezygotic isolation.
focuses on allopatric speciation, leading to biological barriers between species
A current challenge for doctors involves the bacterial strain Clostridioides difficile, which no longer responds to traditional antibiotic treatments.
Which of the following best explains why this particular strain of bacteria is resistant to antibiotic treatment?
A) Mutations creating new alleles occur more frequently in this species of bacteria than in other species.
B) The bacteria have high genetic variability and high reproductive rates.
C) Crossing over during meiosis increased genetic variability in the bacteria.
D) The bacteria are able to recognize and destroy the antibiotics by breaking them down extracellularly.
B) The bacteria have high genetic variability and high reproductive rates.
mutation rates are typically similar between species. bacteria can produce several generations in one day
The bird, Parus major, is commonly found in man-made habitats. During the summer these birds primarily feed on insects, and in the winter, when insects are scarce, they forage in gardens and bird feeders for seeds, nuts, and berries. Recently, climate change has led to a decrease in food available from gardens, and scientists have observed that the average beak length of the birds has increased.
Which of the following best explains the directional shift in beak length in these birds?
A) Longer beaks allow the birds to better fend off predators.
B) Longer beaks increase the fitness of the birds in wild habitats.
C) Longer beaks allow the birds to better access seeds in bird feeders.
D) Longer beaks decrease the fitness of the birds in wild habitats.
C) Longer beaks allow the birds to better access seeds in bird feeders.
During the winter, birds use food from gardens or bird feeders. Without the food source from gardens, bird rely on bird feeders more; B is too vague
In eastern gray squirrels, Sciurus carolinensis, the allele for black fur (B) is dominant to the allele for gray fur (b). In a particular population of gray squirrels, 64% have black fur and 36% have gray fur. A researcher calculated the allele frequencies to be B = 0.4 and b = 0.6. Five years later, the researcher returned to the location and determined the allelic frequencies within the squirrel population to be B = 0.6 and b = 0.4.
Which of the following could best explain the increase in the frequency of the B allele in the population after five years?
A) The frequency of the B allele increased because it is the dominant allele.
B) The frequency of the B allele increased because squirrels with gray fur exhibited greater fitness.
C) The frequency of the B allele increased due to the selective pressures of the environment.
D) The frequency of the B allele increased because black squirrels randomly mate with other eastern gray squirrels.
C) The frequency of the B allele increased due to the selective pressures of the environment.
For following group of questions first study the description of the situation and then choose the one best answer to each question following it and fill in the corresponding oval on the answer sheet.
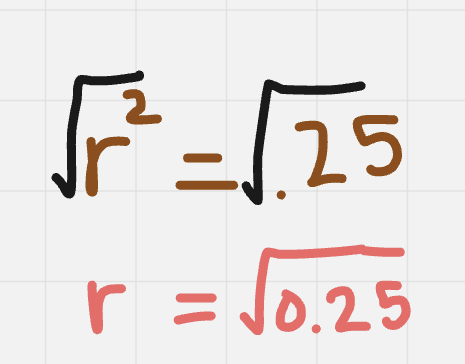
A survey reveals that 25 percent of a population of 1,000 individuals have attached earlobes (are homozygous recessive for the trait). For the following questions, assume that the population fits the parameters of the Hardy-Weinberg law.
What is the frequency of the recessive allele?
A) sqrt(0.75)
B) 0.75
C) sqrt(0.50)
D)sqrt(0.25)
E) 0.25
D)sqrt(0.25)
For following group of questions first study the description of the situation and then choose the one best answer to each question following it and fill in the corresponding oval on the answer sheet.
A survey reveals that 25 percent of a population of 1,000 individuals have attached earlobes (are homozygous recessive for the trait). For the following questions, assume that the population fits the parameters of the Hardy-Weinberg law.
If p equals the frequency of the dominant allele and q equals the frequency of the recessive allele, which of the following terms represents the frequency of the individuals who show the dominant phenotype?
A) p2
B) q2
C) 2pq
D) p2 + 2pq
E) p2 + q2
D) p2 + 2pq
In a small group of people living in a remote area, there is a high incidence of “blue skin”, a condition that results from a variation in the structure of hemoglobin. All of the “blue-skinned” residents can trace their ancestry to one couple, who were among the original settlers of this region. The unusually high frequency of “blue skin” in the area is an example of
A) mutation
B) genetic drift
C) natural selection
D) sexual selection
E) heterozygote advantage
B) genetic drift
genetic drift: allele became common by chance since the population started from a very small group (def: allele frequencies changing randomly)
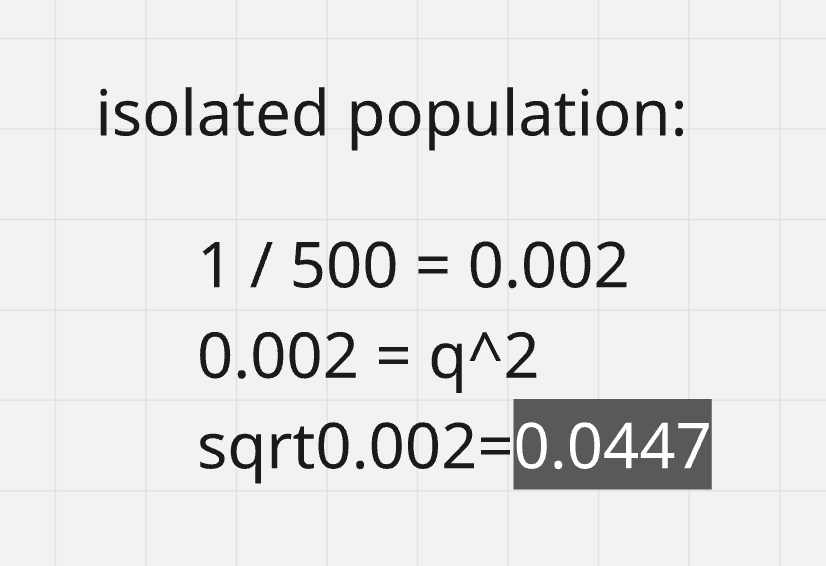
Ellis-van Creveld syndrome is a recessive genetic disorder that includes the characteristics of short stature and extra fingers or toes. In the general population, this syndrome occurs in approximately 1 in 150,000 live births. In a particular isolated population, however, the incidence of this syndrome among live births is 1 in 500.
Assume that both the isolated population and the general population are in Hardy-Weinberg equilibrium with respect to this syndrome. Which of the following best describes the difference between the frequency of the allele that causes the syndrome in the general population and the frequency of the allele in the isolated population?
A) The frequency of the Ellis-van Creveld allele is 0.002 in the isolated population and 0.0000066 in the general population, which suggests that selection for this trait is occurring in both populations.
B) The frequency of the Ellis-van Creveld allele is 0.0447 in the isolated population and 0.0026 in the general population, showing that the rate of genetic mutation is highest among individuals in the isolated population.
C) The frequency of the Ellis-van Creveld allele is 0.002 in the isolated population and 0.0000066 in the general population, which demonstrates gametic incompatibility between the populations.
D) The frequency of the Ellis-van Creveld allele is 0.0447 in the isolated population and 0.0026 in the general population, which suggests that genetic drift has occurred in the isolated population.
D) The frequency of the Ellis-van Creveld allele is 0.0447 in the isolated population and 0.0026 in the general population, which suggests that genetic drift has occurred in the isolated population.
The different species of finches on the Galapagos Islands are believed to have arisen as a result of natural selection acting on populations of finches that had experienced
A) convergent evolution
B) gene flow
C) the bottleneck effect
D) geographic isolation
E) hybrid sterility
D) geographic isolation
gene flow mixes populations together; speciation requires reduced gene flow
reminder: gene flow → transfer of alleles between populations
Which of the following statements best explains how a condition of Hardy-Weinberg equilibrium results in a population that exhibits stable allele frequencies (i.e., a nonevolving population) ?
A) Large populations are not subject to natural selection.
B) Random mating prevents gene flow from changing allele frequencies.
C) Without migration or mutation, new alleles cannot be introduced to the population.
D) In the absence of selection, allele frequencies in a population will not change.
C) Without migration or mutation, new alleles cannot be introduced to the population.
Not D → Other than natural selection, there are other factors that can affect allele frequenices in a population
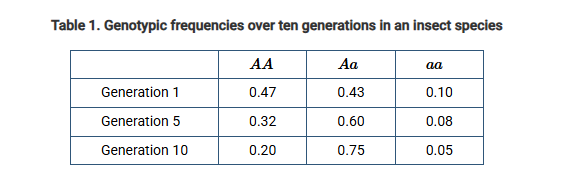
In a large, isolated population of an insect species, a specific gene locus has one dominant allele (A) and one recessive allele (a). The genotype frequencies of the gene were collected for ten generations, as shown in Table 1.
Which of the following could best account for the change in genotypic frequencies over the ten generations?
A) Because the allele A is unstable, over the course of the study most of the A alleles mutated to become a alleles.
B) The population is in Hardy-Weinberg equilibrium, which allows for changes in genotypic frequencies every generation.
C) The population is not exhibiting random mating between individuals.
D) The population is becoming extinct because the a allele is disappearing.
C) The population is not exhibiting random mating between individuals.
nonrandom mating occurs
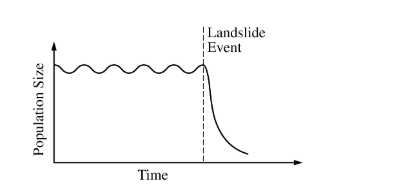
Undersea landslides can disrupt marine habitats by burying organisms that live on the ocean floor. The graph above shows the size of a population of a certain organism that lives on the ocean floor. The population was affected by a recent landslide at the time indicated on the graph. Which of the following best predicts how the population will be affected by the landslide?
A) The surviving organisms will evolve into a new species.
B) The reduced population will likely have allelic frequencies that are different from the initial population.
C) The population will adapt to deeper waters to avoid future landslides.
D) The reduced population will have a greater number of different genes than the initial population.
B) The reduced population will likely have allelic frequencies that are different from the initial population.
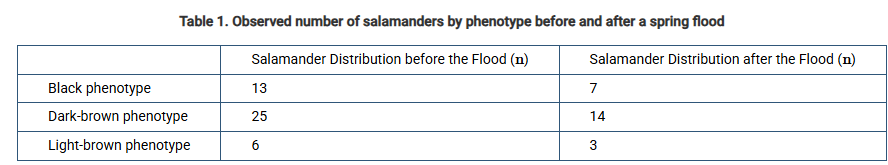
Students observed the distribution of different color phenotypes in northern ravine salamanders (Plethodon electromorphus) before and after a spring flood. The data are shown in Table 1.Which of the following is an appropriate null hypothesis regarding the phenotypic frequencies of this population of salamanders before and after the flood?
A) More black salamanders survived because they could better hide from predators on the dark muddy soil, so the frequency of the black phenotype significantly increased in the population after the flood.
B) Fewer light-brown salamanders survived because they had a reduced chance of finding mates due to the high water levels, so the frequency of the light-brown phenotype in the population decreased after the flood.
C) More dark-brown salamanders migrated to a new, drier area because of the flood and fewer of them remained in the original habitat, so the frequency of dark-brown salamander significantly decreased in the population after the flood.
D) The proportions of black, dark-brown, and light-brown salamanders before and after the flood are not significantly different, and any observed differences are due to random chance.
D) The proportions of black, dark-brown, and light-brown salamanders before and after the flood are not significantly different, and any observed differences are due to random chance.
null hypothesis → phenotypic frequencies changed due to chance
Some cells release active signaling proteins when membrane-bound precursor proteins are cleaved by proteolytic enzymes. The signaling proteins can then bind to receptors on the surface of a target cell, thereby activating an intracellular signaling pathway and eliciting a response from the target cell.
This mechanism of activating receptor-binding signaling proteins has been observed in a variety of organisms from bacteria to humans. Many of the enzymes responsible for proteolysis of membrane-bound precursor proteins have been isolated and characterized.
Which of the following questions would be most appropriate to investigate whether the proteolytic enzymes are evolutionarily conserved among species?
A) Are the genes encoding the proteolytic enzymes expressed in the same cell types in all species?
B) Once the precursor proteins of different species are cleaved, do the active signaling proteins bind to the same receptors on different target cells?
C) If a proteolytic enzyme from one species is incubated with a precursor protein from another species, does correct cleavage occur?
D) Are the proteolytic enzymes synthesized in the rough endoplasmic reticulum of all species?
C) If a proteolytic enzyme from one species is incubated with a precursor protein from another species, does correct cleavage occur?
question asks if enzymes stayed structurally/functionally across over time;
same expression location and conserved enzyme structure/function don’t correlate
testing receptor function doesn’t support evidence needed either
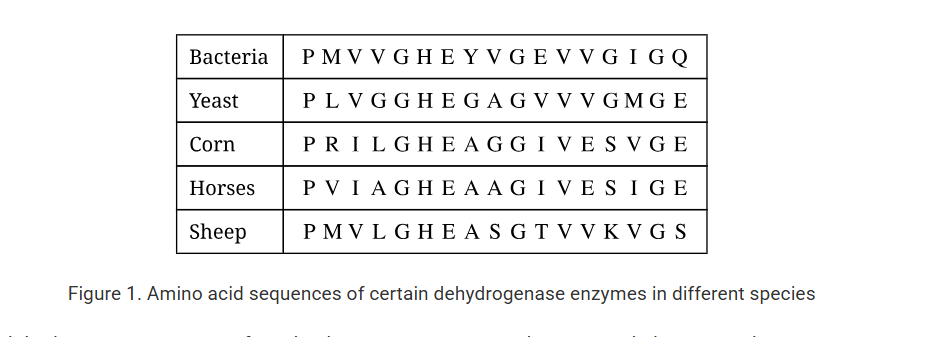
Portions of the amino acid sequences of some dehydrogenase enzymes found in bacteria, yeast, corn, horses, and sheep are shown in Figure 1. Each letter represents a different amino acid in the sequence.
Based on Figure 1, which of the following conclusions about the enzymes is most likely correct?
A) Corn and horse dehydrogenase enzymes arose separately during each organism’s evolution and now exhibit strong sequence similarity as a result of their similar catalytic roles.
B) These enzymes all evolved from a common prokaryotic dehydrogenase enzyme, so they exhibit regions of sequence similarity.
C) Any evolutionary relationship is unlikely, because there is little sequence similarity between these enzymes.
D) No conclusion can be drawn based on amino acid sequence, because there are twenty amino acids and only four nucleotides.
B) These enzymes all evolved from a common prokaryotic dehydrogenase enzyme, so they exhibit regions of sequence similarity.
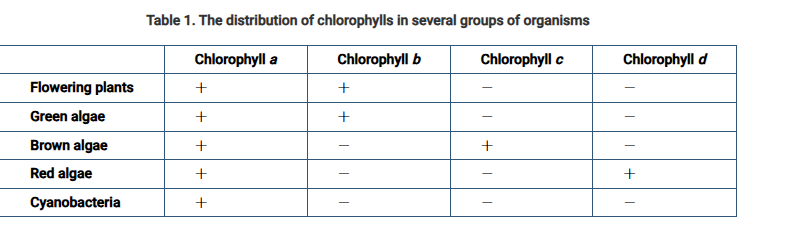
Different photosynthetic organisms have different types of chlorophyll molecules. The distribution of chlorophylls in several different groups of organisms is shown in Table 1. A plus sign (+) in the table indicates the presence of a chlorophyll, while a minus sign (-) indicates its absence.
Based on the data, which of the following most likely describes the evolutionary relationship among the organisms?
A) Because brown algae, red algae, and cyanobacteria lack chlorophyll b, they evolved before green algae and flowering plants did.
B) Because green algae and flowering plants contain chloroplasts, they evolved more recently than brown algae, red algae, and cyanobacteria did.
C) Because increasingly complex forms of chlorophyll are found in red algae, brown algae, green algae, and flowering plants, respectively, this reflects the order of their appearance.
D) Because all of the organisms contain chlorophyll a, the organisms share a common ancestor.
D) Because all of the organisms contain chlorophyll a, the organisms share a common ancestor.
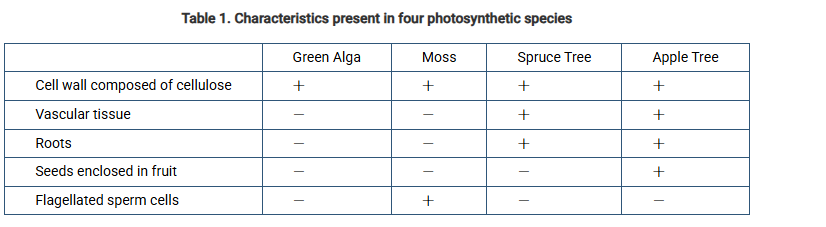
Students analyzed several photosynthetic eukaryotic organisms in the laboratory to determine their phylogenetic relationships. The organisms were Spirogyra (a green alga), a moss, a spruce tree, and an apple tree. Table 1 compares several characteristics in the organisms (+ indicates the trait is present, - indicates the trait is absent).
Which of the following rows of data listed in table 1 best supports the possibility of a common ancestor for the organisms listed there?
A) Vascular tissue
B) Seeds enclosed in fruit
C) Cell wall composed of cellulose
D) Flagellated sperm cells
C) Cell wall composed of cellulose
The hormone prolactin has varying effects in many different animal species. All vertebrates produce prolactin, which is involved in signal transduction pathways. In mammals, prolactin stimulates the production of milk in mammary glands. In fish, prolactin plays an important role in osmoregulation. In birds, prolactin is involved in lipid metabolism.
Which of the following best explains the presence of prolactin in various vertebrate species?
A) Though all vertebrates produce prolactin, its varied uses indicate it arose as a result of convergent evolution and not as a result of common ancestry.
B) Prolactin is a homologous hormone because it has a common origin but different functions in various species.
C) Prolactin will bind only to intracellular receptors in animal species with phospholipid bilayers, so its effects are varied in different species.
D) Because of different receptors activating different signal transduction pathways within the same species, it is likely that prolactin production is a trait with highly selective pressure.
B) Prolactin is a homologous hormone because it has a common origin but different functions in various species.
homologous: same structure, different function
The amino acid sequence of cytochrome c is exactly the same in humans and chimpanzees. There is a difference of 13 amino acids between the cytochrome c of humans and dogs, and a difference of 20 amino acids between the cytochrome c of humans and rattlesnakes.
Which of the following statements is best supported by these data?
A) Rattlesnakes apparently gave rise evolutionarily to the dog, chimpanzee, and human.
B) Cytochrome c apparently has an entirely different function in rattlesnakes than in mammals, which explains the difference in the number of amino acids.
C) Cytochrome c is not found universally in animals.
D) Cytochrome c from a rattlesnake could function in a dog, but not in a chimpanzee.
E) The human is apparently more closely related to the chimpanzee than to the dog or rattlesnake.
E) The human is apparently more closely related to the chimpanzee than to the dog or rattlesnake.
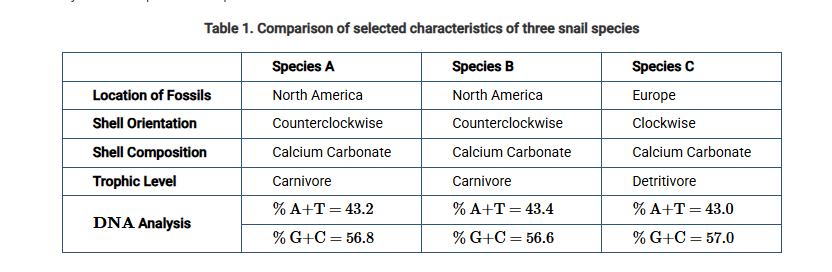
Researchers studying the evolutionary relationships of three species of snails collected the data shown in Table 1.
Which of the following data sets is most likely to provide reliable information about the evolutionary relationships among these three snail species?
A) Shell composition and shell orientation
B) Trophic level and DNA analysis
C) Location of fossils and shell orientation
D) Shell composition and location of fossils
C) Location of fossils and shell orientation
other options show evolutionary similarity, but we need information to distinguish relationships
with C, we can identify A and B are more closely related
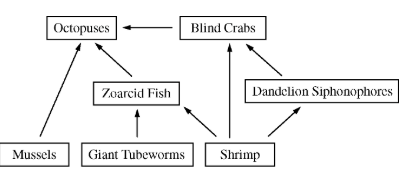
The food web above represents feeding relationships in a biological community near a deep-sea hydrothermal vent. Hydrothermal vents are geysers on the seafloor that gush super-heated, mineral-rich water. The seawater surrounding hydrothermal vents typically contains carbon dioxide (CO2), molecular hydrogen (H2), hydrogen sulfide (H2S), and methane (CH4). Sunlight, however, fails to reach the seafloor where deep-sea hydrothermal vents are located.
As part of an investigation, researchers collected living specimens from an area near a deep-sea hydrothermal vent. Mussels in the collection were found to be dependent on molecular hydrogen in seawater. Also, the researchers discovered multiple species of bacteria living in the gills of the mussels. Mussels use gills for filter-feeding and gas exchange with the surrounding seawater. On the basis of their experimental results, the researchers hypothesized that some bacteria living in the gills of the mussels are capable of chemosynthesis.
Researchers are investigating the evolutionary relationships among organisms found near deep-sea hydrothermal vents and similar organisms found closer to the ocean surface. Which of the following scientific questions is most relevant to the investigation?
A) What are the nucleotide sequences of ribosomal RNA genes that are found in the genomes of the different species?
B) What large-scale geological events have occurred recently in the Mid-Atlantic Ocean?
C) Does water temperature at different ocean depths affect the relative levels of dissolved oxygen?
D) Do species found near deep-sea hydrothermal vents all have the same haploid number of chromosomes?
A) What are the nucleotide sequences of ribosomal RNA genes that are found in the genomes of the different species?
using DNA/RNA to determine evolutionary relationships is most efficient
The wing of a bat, the flipper of a whale, and the forelimb of a horse appear very different, yet detailed studies reveal the presence of the same basic bone pattern. These structures are examples of
A) analogous structures
C) vestigial structures
D) balanced polymorphism
E) convergent ‘evolution
B) homologous structures
same structure, different function
Lobe-finned fishes were present in the oceans of the world approximately 400 million years ago. The first tetrapods (vertebrates that had limbs and could move on land) date to about 365 million years ago. One hypothesis states that early tetrapods evolved from lobe-finned fishes. Which of the following is the best plan for testing the hypothesis?
A) Determining the number of fins found on lobe-finned fishes from different geographical locations
C) Comparing the arrangements of bones in the fins of lobe-finned fishes and limbs of the earliest tetrapods
D) Sequencing DNA isolated from fossils of lobe-finned fishes to determine the size of the genome
B) Measuring the proportion of radioisotopes found in fossils of early tetrapods
look for homologous structures
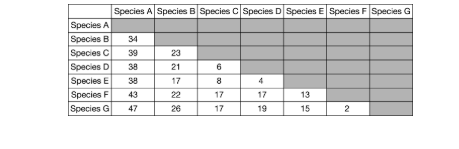
Scientists are interested in determining the evolution of seven lizard species found on different islands of the Canary Island group. They isolated DNA from individuals of each species and sequenced the mitochondrial gene that encodes cytochrome b. The numbers of genetic differences between species are shown in the table below.
Based on the data in the table, which of the following lizard species are most closely related?
A) Species C and species B
B) Species E and species D
C) Species F and species B
D) Species G and species A
B) Species E and species D
has fewest genetic differences (4)

Five new species of bacteria were discovered in Antarctic ice core samples. The nucleotide (base) sequences of rRNA subunits were determined for the new species. The table below shows the number of nucleotide differences between the species.
Which of the following phylogenetic trees is most consistent with the data?
C)
species 3 and 4 have fewest difference of 1. Species 1 and 2 have fewest difference of 3. species 5 has the highest differences compared to all other species
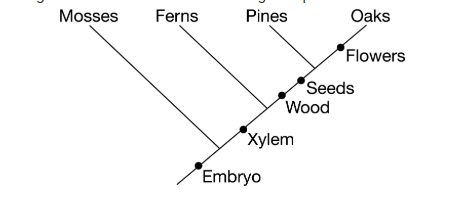
The cladogram shows shared traits among four plant taxa.
Based on the cladogram, which of the following are the traits shared between ferns and pines?
A) Xylem only
B) Seeds and wood only
C) Embryo and xylem only
D) Embryo, xylem, wood, and seeds only
C) Embryo and xylem only
ferns do NOT have wood or seeds
As you move upward, organisms inherit all PREVIOUS traits
A number of different phylogenies (evolutionary trees) have been proposed by scientists. These phylogenies are useful because they can be used to
A) determine when two similar populations of a species evolved into two separate species
B) evaluate which groups of organisms may be most closely related
C) demonstrate that all photosynthetic organ-isms are members of the Kingdom Plantae
D) demonstrate that natural selection is the prevailing force in evolution
E) demonstrate which taxa (groups of organisms) contain the most highly evolved species
B) evaluate which groups of organisms may be most closely related
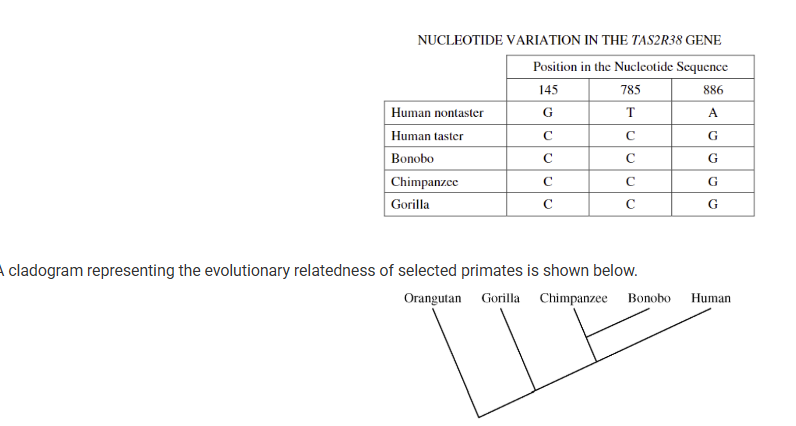
The TAS2R38 gene encodes a receptor protein that influences the ability to taste bitterness. The gene has two alleles: a dominant, wild-type allele that enables an individual (taster) to taste bitterness and a recessive, mutant allele that interferes with the ability of an individual (nontaster) to taste bitterness. Three single nucleotide mutations in the coding region of the TAS2R38 gene are associated with the nontaster allele. The nucleotides present at the three positions are shown in the table below.
A cladogram representing the evolutionary relatedness of selected primates is shown below.
Which of the following conclusions is supported by the data?
A) Humans and bonobos belong to the same genus because the nucleotide sequence of the TAS2R38 gene is the same
B) Chimpanzees are equally related to humans and bonobos because all three groups possess variants of the TAS2R38 gene.
C) Humans are more closely related to bonobos than to chimpanzees because the branch of the tree with humans is closest to the branch of the tree with bonobos.
D) Bonobos are more closely related to humans than to gorillas because bonobos and humans share a more recent common ancestor than bonobos and gorillas do.
D) Bonobos are more closely related to humans than to gorillas because bonobos and humans share a more recent common ancestor than bonobos and gorillas do.
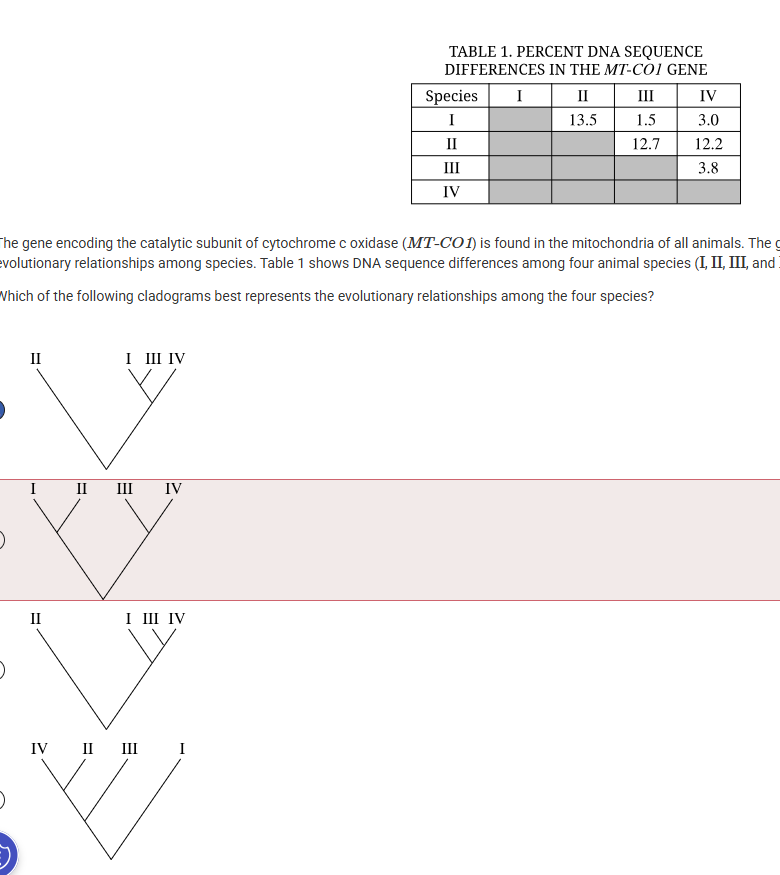
The gene encoding the catalytic subunit of cytochrome c oxidase (MT-CO1) is found in the mitochondria of all animals. The gene evolves rapidly and is often used to determine evolutionary relationships among species. Table 1 shows DNA sequence differences among four animal species (I,II ,III , and IV).
Which of the following cladograms best represents the evolutionary relationships among the four species?
A)
I and III: 1.5
I and IV: 3.0
IV and III: 3.8

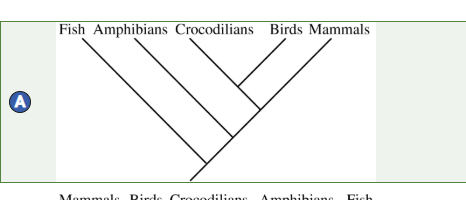
The table above shows derived characters for selected organisms. Based on the information in the table, which of the following cladograms best represents the evolutionary relationships among the organisms?
A
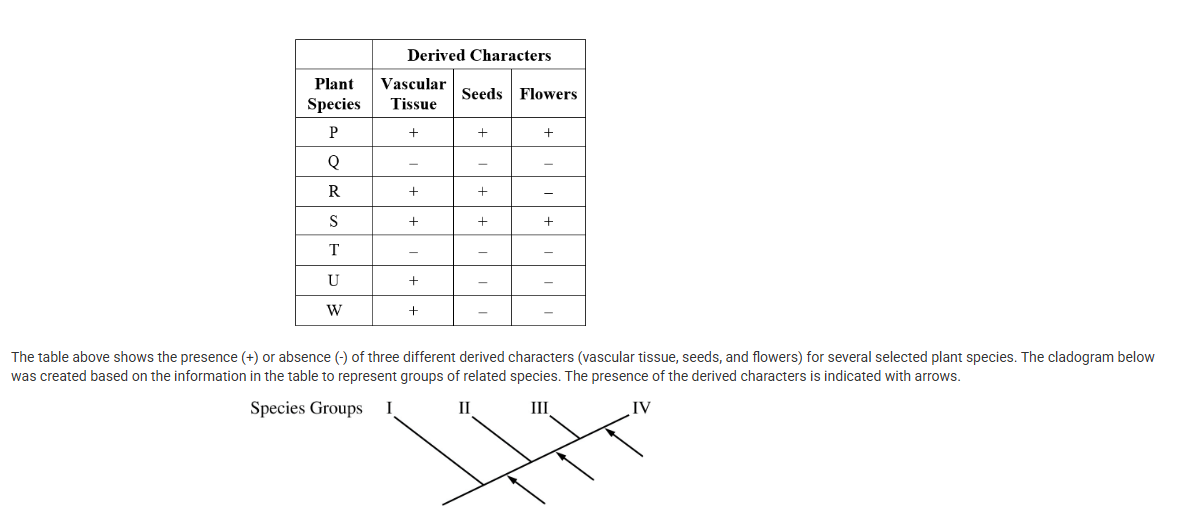
The table above shows the presence (+) or absence (-) of three different derived characters (vascular tissue, seeds, and flowers) for several selected plant species. The cladogram below was created based on the information in the table to represent groups of related species. The presence of the derived characters is indicated with arrows.
Group IV of the cladogram most likely includes which of the following species?
A) P and S only
B) Q and T only
C) R and W only
D) U and W only
A) P and S only
fills all of the presence traits
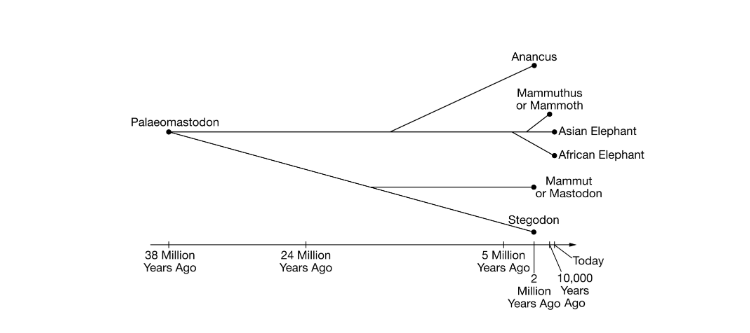
Which of the following claims is best supported by the information in the figure?
A) The Asian and African elephants are the most closely related species shown on the tree.
B) The mammoth diverged from its most recent common ancestor with African elephants before the mastodon diverged from its most recent common ancestor with Stegodons.
C) The mastodon and the Stegodon diverged from their common ancestor 2 million years ago.
D) The common ancestor of the African elephant and the mastodon is the Palaeomastodon.
D) The common ancestor of the African elephant and the mastodon is the Palaeomastodon.
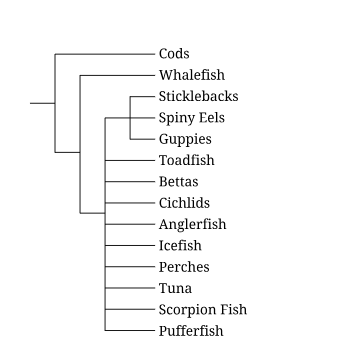
Cods and icefish are the only orders of fish that include species that produce antifreeze proteins in their blood. Based on the cladogram in Figure 1, which of the following scenarios describes the most likely evolutionary history of antifreeze protein synthesis in fish?
A) Antifreeze proteins arose twice, once in the cod lineage and once in the icefish lineage.
B) Antifreeze proteins arose once in a common ancestor of cods and icefish.
C) Antifreeze proteins arose once in the most recent common ancestor of whalefish and icefish.
D) Antifreeze proteins were lost repeatedly in fish lineages.
A) Antifreeze proteins arose twice, once in the cod lineage and once in the icefish lineage.
One of the oldest known mammalian fossils belongs to a small furry species, Hadrocodium wui, that lived 195 million years ago. For the following 100 million years, only a small number of groups of mammalian fossils are found in the fossil record. By 65 million years ago, the nonavian dinosaurs were extinct. By 55 million years ago, there were 130 mammal genera, including 4,000 different species that occupied a wide variety of habitats.
Which of the following best describes the cause of the rapid increase in the number of mammalian species between 65 and 55 million years ago?
A) It took over 100 million years for enough random mutations to occur in the genomes of early mammals to provide the variation needed for the observed speciation.
B) It took over 100 million years for the early mammals to disperse over a wide enough geographic area to allow allopatric speciation to occur.
C) After the dinosaur extinction, many ecological niches became available, leading to the adaptive radiation of mammals.
D) After the dinosaur extinction, mammal population sizes increased, allowing species to become more easily detectable in the fossil record.
C) After the dinosaur extinction, many ecological niches became available, leading to the adaptive radiation of mammals.
Female European corn borer moths (Ostrinia nubilalis) produce the sex pheromone 11—tetradecenyl acetate (11—TDA), which attracts males of their species. 11—TDA can be produced in two forms, E and Z, each with a different three-dimensional shape. Researchers have discovered two different strains of the European corn borer moth living in the same area. Females of the E strain produce primarily the E form of 11—TDA and females of the Z strain produce primarily the Z form of 11—TDA. Males of both strains are more attracted to the form of 11—TDA produced by the females of the same strain.
Which of the following best predicts a long-term effect of the differences between the E and Z strains?
A) The difference between the forms of the sex pheromone 11—TDA produced by E and Z strains will act as a prezygotic reproductive barrier leading to sympatric speciation.
B) The difference between the forms of the sex pheromone 11—TDA produced by E and Z strains will act as a postzygotic reproductive barrier, leading to allopatric speciation.
C) Since the E and Z strains are both part of the same species, they will produce fertile offspring, leading to a single strain that produces both forms of 11—TDA.
D) Since the E and Z strains are found in the same geographic area, they will hybridize, leading to a single strain that produces the dominant form of 11—TDA.
A) The difference between the forms of the sex pheromone 11—TDA produced by E and Z strains will act as a prezygotic reproductive barrier leading to sympatric speciation.
On a large volcanic island, researchers are studying a population of annual herbaceous plants. Which of the following observations best supports the prediction that speciation will occur within the existing plant population?
A) Individuals of the species sometimes reproduce asexually by producing runners.
B) Lava has separated the population into two areas: an upland forest and a lowland marsh.
C) Multiple groups of birds depend on the fruit produced by the plants as a source of food.
D) The plants produce more seeds during warm summers than they do during cool summers.
B) Lava has separated the population into two areas: an upland forest and a lowland marsh.
allopatric speciation

Researchers were modeling the effects of repeated cycles of isolation with occasional interbreeding among five hypothetical fish species (species A, B, C, D, and E) found in two separate lakes (lakes I and II) that are occasionally joined by flooding, as shown in Figure 1. The research team indicated that species A would be considered to be the single common ancestor of species B, C, D, and E.
Which of the following mechanisms could most likely account for the origin of species B in Lake I?
A) Allopatric speciation
B) Directional selection
C) Stabilizing selection
D)Sympatric speciation
D)Sympatric speciation
species A and B coexist
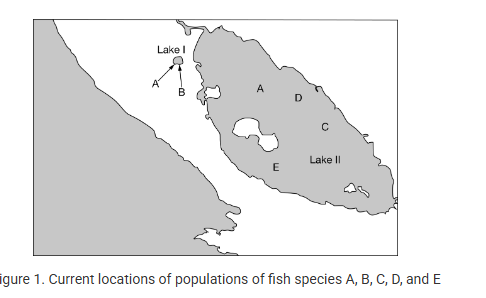
Researchers were modeling the effects of repeated cycles of isolation with occasional interbreeding among five hypothetical fish species (species A, B, C, D, and E) found in two separate lakes (lakes I and II) that are occasionally joined by flooding, as shown in Figure 1. The research team indicated that species A would be considered to be the single common ancestor of species B, C, D, and E.
Which of the following data could best support the claim that species B arose from a speciation event in Lake I?
A) All of the fish species occupy the same niches in their respective lakes.
B) DNA analysis shows fewer differences between species A and species B in Lake I than between species B and the populations in Lake II.
C) Species A and species B have similar body shapes due to convergent evolution in their habitats.
D) Individuals of species A from Lake can mate and produce viable offspring with individuals of species A from Lake II.
B) DNA analysis shows fewer differences between species A and species B in Lake I than between species B and the populations in Lake II.
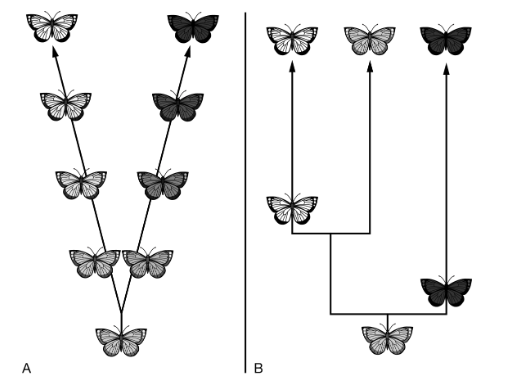
Figure 1 compares two models of speciation, A and B.
Which of the following best explains how the ecological conditions are likely to be different in the two models?
A) In model A the ecological conditions remain unchanged for long periods of time and then change drastically; in model B the ecological conditions change drastically from generation to generation.
B) In model A the ecological conditions remain unchanged; in model B the ecological conditions change gradually over long periods of time.
C) In model A the ecological conditions are changing drastically from generation to generation; in model B the ecological conditions remain unchanged.
D) In model A the ecological conditions change gradually over a long period of time; in model B the ecological conditions remain unchanged for long periods of time and then change drastically.
D) In model A the ecological conditions change gradually over a long period of time; in model B the ecological conditions remain unchanged for long periods of time and then change drastically.
A biologist spent many years researching the rate of evolutionary change in the finch populations of a group of islands. It was determined that the average beak size (both length and mass) of finches in a certain population increased dramatically during an intense drought between 1981 and 1987. During the drought, there was a reduction in the number of plants producing thin-walled seeds.
Which of the following procedures was most likely followed to determine the change in beak size?
A) A few finches were trapped in 1981 and again in 1987, and their beak sizes were compared.
B) The beak size in fifteen finches was measured in 1987, and the beak size in the original finches was determined by estimation.
C) The beak size in a large number of finches was measured every year from 1981 to 1987.
D) Finches were captured and bred in 1981, and the beak size of the offspring was measured.
C) The beak size in a large number of finches was measured every year from 1981 to 1987.
Commercial bananas are grown as a monoculture, with all banana plants cloned from one original banana plant. The commercial strains of bananas are seedless, so each new banana plant has to be manually planted from a cutting of an existing banana root. In the 1950s, the Gros Michel banana strain, the dominant export banana at that time, was destroyed by the fungus Fusarium oxysporum. A new Fusarium resistant variety, the Cavendish banana, was developed and is currently the banana strain grown for export. Recently, a Fusarium strain that successfully attacks the Cavendish strain has been documented.
Which of the following best provides reasoning supporting a method that would help protect commercial banana crops from infection by pathogenic organisms such as Fusarium fungi?
A) The commercial banana strains should be exposed to X-rays to encourage random mutations that will then be passed to offspring, producing resistance to pathogenic organisms.
B) The Cavendish banana plants should be exposed to pathogenic organisms under controlled conditions, so the plants can be encouraged to mutate and develop resistance to the pathogens.
C) The commercial banana strains should not be grown in monocultures, since many pathogenic organisms are able to evolve rapidly in response to a single selective pressure.
D) Growing the Cavendish strain under different conditions will allow natural selection to produce the variation needed to resist infection by pathogenic organisms.
C) The commercial banana strains should not be grown in monocultures, since many pathogenic organisms are able to evolve rapidly in response to a single selective pressure.
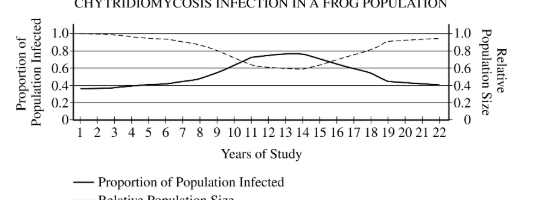
Chytridiomycosis is a potentially lethal fungal infection that adversely affects some frog populations. The incidence and severity of the fungal infection can vary over time. Which of the following statements best describes the changes in the frog population that are depicted in the model above?
A) The fungus that infected the frog population was initially virulent but it later became harmless. Based on the trend over the past few years of the study, the fungus has become extinct.
B) Infected individuals gradually died out, and genetically resistant individuals became more common. The frog population recovered because of the increased frequency of resistant individuals.
C) The patterns of the curves on the graph indicate a sudden increase in the severity of the fungal infection. A large proportion of the frog population died because the individuals could not evolve fast enough.
D) The size of the frog population decreased sharply upon initial contact with the fungus. The fungus eventually became symbiotic with individual frogs, and the frog population began to recover.
B) Infected individuals gradually died out, and genetically resistant individuals became more common. The frog population recovered because of the increased frequency of resistant individuals.
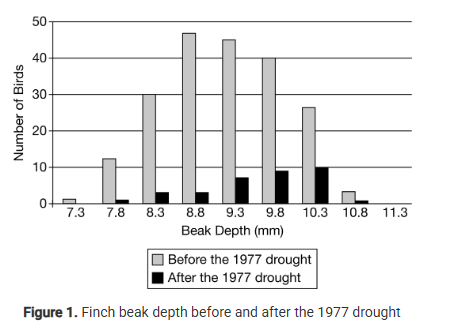
Finch beak depth was measured before and after a severe drought in 1977. The averaged results are shown in Figure 1. After the drought, there were fewer seeds available for the finches to eat and the seeds that did remain were larger and harder to crack open. Researchers claim that when large, hard seeds are the predominate food source, the average beak depth of these finches tends to increase in subsequent generations.
Using the evidence provided, which of the following best justifies the researchers' claim?
A) Finch beak depth increased after the drought because the overall numbers of finches decreased, reducing competition for resources.
B) Finch beak depth increased as a consequence of selective pressure after the drought because the remaining seeds were larger and harder.
C) Finch beak depth increased after the drought due to intraspecific competition since finches with deeper beaks attract more mates.
D) Finch beak depth increased after the drought due to increased predation since finches with deeper beaks can fight off predators more effectively.
B) Finch beak depth increased as a consequence of selective pressure after the drought because the remaining seeds were larger and harder.
Two populations of a species of squirrel are geographically isolated from each other. Although they have the same population density, one population is significantly larger in number than the other. A new bacterial disease, which is easily spread and extremely virulent, affects both populations at the same time. Which of the following is the best prediction of how the new disease will affect the two populations?
A) The two populations will be equally affected, because the ability to trigger an immune response is randomly distributed among all squirrels of that species.
B) The larger population will be less affected by the disease than will the smaller population, because the mutation rate of the larger population is higher than the mutation rate of the smaller population.
C) The smaller population will be more affected than will the larger population, because the smaller population has less genetic variation than the larger population has.
D) The smaller population will be less affected than will the larger population, because the smaller population exhibits more genetic drift than the larger population exhibits.
C) The smaller population will be more affected than will the larger population, because the smaller population has less genetic variation than the larger population has.
Malaria is caused by several different species of Plasmodium, a protozoan parasite. Plasmodium resistance to the common drugs used to treat malaria has increased in recent years.
In a scientific study, Plasmodium samples were analyzed in blood drawn from a large number of infected patients before drug treatment and subsequently from the subset of infected patients with drug-resistant Plasmodium. DNA sequences of four different Plasmodium genes thought to be involved in resistance were compared between samples from patients with drug-sensitive Plasmodium and patients with drug-resistant Plasmodium.
Which of the following best supports the hypothesis that preexisting mutations confer drug resistance?
A) Drug resistance can sometimes be reversed by simultaneous treatment with a drug that inhibits the drug-pumping mechanism of Plasmodium.
B) Some of the mutations that occur most frequently in samples from patients treated with antimalarial drugs are detectable in Plasmodium samples collected prior to use of antimalarial drugs.
C) Continued use of the same antimalarial drugs leads to increased Plasmodium resistance.
D) The same mechanism of drug resistance in Plasmodia isolated from separate populations of patients resulted from an accumulation of new genetic mutations.
B) Some of the mutations that occur most frequently in samples from patients treated with antimalarial drugs are detectable in Plasmodium samples collected prior to use of antimalarial drugs.
Rock pocket mice live in the deserts of the American southwest. Ancestral pocket mice all had light-colored coats that blended in with the region’s rocks and sandy soil, keeping the mice hidden from predatory owls. About 1.7 million years ago, a series of volcanic eruptions spewed out wide trails of black lava into the middle of rock pocket mouse territory. Currently there are two color morphs of rock pocket mice: light-colored mice that are typically found in habitats with sandy soil, and dark-colored mice that are typically found in habitats with dark-colored lava rocks.
Which of the following best justifies the claim that alleles that may be adaptive in one type of environment can be deleterious in another because of different selective pressures?
A) Light- and dark-colored mice survive in many environments because they are able to avoid predation by moving into tunnels.
B) Light-colored mice are more likely to survive than dark-colored mice in habitats with lava rocks and sandy soil.
C) Light-colored mice are significantly more susceptible to predation by owls in habitats with lava rocks than in habitats with sandy soil.
D) Dark-colored mice are more likely to survive than light-colored mice in habitats with lava rocks and sandy soil.
C) Light-colored mice are significantly more susceptible to predation by owls in habitats with lava rocks than in habitats with sandy soil.
Many scientists claim that the synthesis of the first organic molecules from inorganic precursors was possible because of the highly reducing atmosphere found on primitive Earth.
Which of the following is an appropriate null hypothesis that could be used when investigating the claim?
A) The level of atmospheric oxygen on modern Earth is significantly higher than on primitive Earth.
B) Organic molecules were transported to primitive Earth by a meteorite or other celestial event.
C) The synthesis of organic molecules from inorganic molecules is possible under current atmospheric oxygen levels as well as those found on primitive Earth.
D) The absence of a significant quantity of atmospheric oxygen is required for the synthesis of organic molecules from inorganic precursors.
C) The synthesis of organic molecules from inorganic molecules is possible under current atmospheric oxygen levels as well as those found on primitive Earth.
despite different conditions, null hypothesis suggests there would be no difference
A scientist is attempting to provide support for the hypothesis that RNA was the first genetic material. Which of the following would be a workable alternate hypothesis?
A) RNA, like DNA, is a carrier of genetic information and contains the nitrogen bases adenine, guanine, and cytosine.
B) RNA can be observed to self-replicate without the assistance of proteins, while DNA always requires protein-based enzymes to replicate.
C) RNA exists in both single-stranded and double-stranded configurations; however, it is less stable compared with DNA.
D) Transfer RNA and ribosomal RNA are products of transcription, but they are not translated as is mRNA.
B) RNA can be observed to self-replicate without the assistance of proteins, while DNA always requires protein-based enzymes to replicate.
“which supports the theory that RNA was first genetic material?”
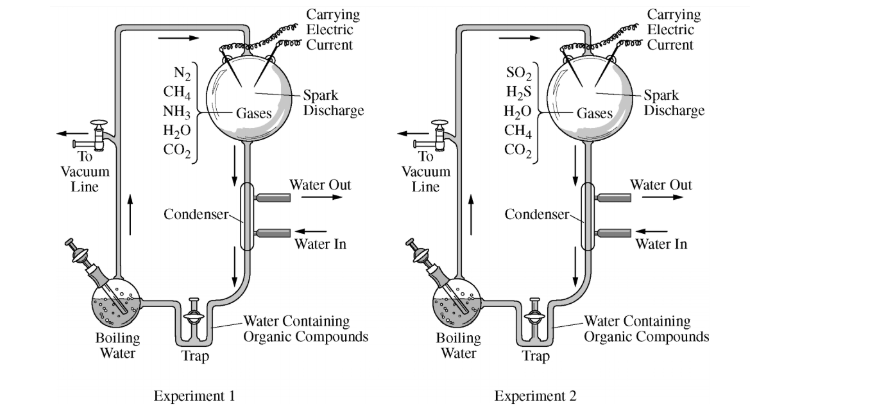
Two groups of students attempted to re-create the primitive atmospheric conditions of early Earth using the apparatus represented below. Each group ran the experiment with different gas mixtures in the apparatus.
Which of the following statements best justifies the claim that the conditions in at least one of the experiments could generate the molecular building blocks essential for life?
A) The carbon dioxide (CO₂) gas and water (H₂O) vapor in experiment 1 could react spontaneously to produce the phospholipids required by the first life-forms.
B) The nitrogen (N₂) gas and ammonia (NH₃) gas in experiment 1 could provide the elemental nitrogen required for the formation of amino acids.
C) The sulfur dioxide (SO₂) gas in experiment 2 could donate the excited electrons required to drive the process of photosynthesis.
D) The methane (CH₄) gas in experiment 2 could act as the electron acceptor required to complete the process of cellular respiration.
B) The nitrogen (N₂) gas and ammonia (NH₃) gas in experiment 1 could provide the elemental nitrogen required for the formation of amino acids.
All of the following were likely present on the primitive Earth during the evolution of self-replicating molecules EXCEPT
A) amino acids and nucleotides
B) nitrogen
C) simple carbohydrates
D) freestanding liquid water
E) an O2-rich atmosphere
E) an O2-rich atmosphere
The Stanley Miller apparatus demonstrated that organic molecules could assemble spontaneously in an environment lacking free oxygen and containing water, methane, and ammonia in the presence of an abundant energy source, such as an electric discharge. The research was considered supportive of the organic soup hypothesis, which states that the primitive atmosphere provided inorganic precursors from which organic molecules could have been synthesized in the presence of an energy source. Based on subsequent research, the primordial atmosphere was determined to contain less methane and more carbon dioxide. The new data about the composition of the early atmosphere had which of the following effects on origin-of-life hypotheses?
A) Miller’s work was discarded as not relevant to an origin-of-life hypothesis.
B) Miller’s work was used to refute the new hypothesis about the composition of the atmosphere.
C) The organic soup hypothesis was abandoned as no longer being supportable.
D) A new organic soup hypothesis was proposed to account for the new data about the atmosphere.
D) A new organic soup hypothesis was proposed to account for the new data about the atmosphere.
science does not work as one detail changed → hypothesis deleted forever; instead its new evidence → hypothesis revised/refined

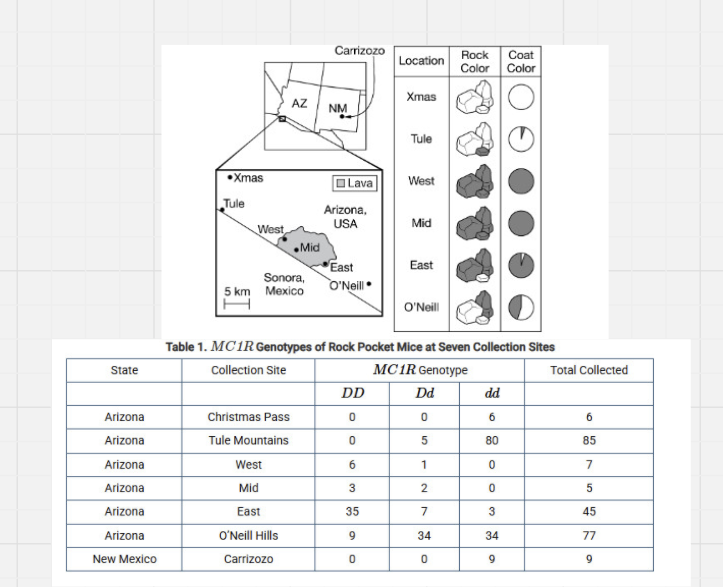
Researchers have undertaken a long-term study of populations of rock pocket mice, Chaetodipus intermedius, in Arizona and New Mexico. Rock pocket mouse fur is either dark or light in color. Most of the populations studied live in areas with light-colored granite rocks; however, some areas are dominated by dark-colored rocks from ancient lava flows. Researchers collected mice from six sites in Arizona and recorded their coat colors. Figure 1 shows the study sites, the rock colors, and the distribution of coat colors.
In the Arizona populations, the melanocortin-1 receptor (MC1R) gene is responsible for coat color phenotype (light or dark). The MC1R D allele, which results in a dark coat, is dominant to the d allele. Researchers collected samples of mice from all six study sites and sequenced the MC1R gene. They also collected mice with dark coats from a location in New Mexico, the Carrizozo lava flow, to determine if the MC1R gene was also responsible for the dark coat colors observed in that population. The rock pocket mouse population in Carrizozo is isolated from the populations in Arizona. Table 1 presents the genotypic data from sampled mice from all seven locations.
Which of the following best describes the processes occurring between the mouse populations and their environments?
A) Natural selection favors the mice with the dark coat color, causing the mice in all of the populations to be better adapted.
B) Natural selection favors the mice with the light coat color, causing the mice in all of the populations to be better adapted.
C) Dark color is selected for in mice from the West, Mid, and East populations.
D) Light color is selected for in mice from the West, Mid, and East populations.
C) Dark color is selected for in mice from the West, Mid, and East populations.
Researchers have undertaken a long-term study of populations of rock pocket mice, Chaetodipus intermedius, in Arizona and New Mexico. Rock pocket mouse fur is either dark or light in color. Most of the populations studied live in areas with light-colored granite rocks; however, some areas are dominated by dark-colored rocks from ancient lava flows. Researchers collected mice from six sites in Arizona and recorded their coat colors. Figure 1 shows the study sites, the rock colors, and the distribution of coat colors.
In the Arizona populations, the melanocortin-1 receptor (MC1R) gene is responsible for coat color phenotype (light or dark). The MC1R D allele, which results in a dark coat, is dominant to the d allele. Researchers collected samples of mice from all six study sites and sequenced the MC1R gene. They also collected mice with dark coats from a location in New Mexico, the Carrizozo lava flow, to determine if the MC1R gene was also responsible for the dark coat colors observed in that population. The rock pocket mouse population in Carrizozo is isolated from the populations in Arizona. Table 1 presents the genotypic data from sampled mice from all seven locations.
Owls (primary predators of rock pocket mice) are nocturnal visual predators that are able to distinguish effectively between dark and light colors in low-light conditions.
Which of the following best explains the relationship between coat color and predation rate in the rock pocket mouse population on the lava flow rocks with respect to the different coat color phenotypes?
A) A dark coat color provides camouflage to mice on the lava flow rocks; therefore, mice with dark coats have a lower predation rate in that habitat.
B) At night, predators have reduced vision, so there is no relationship between coat color and predation rate on rock pocket mice.
C) A dark coat color reflects less light and therefore mice with dark coats have a lower predation rate.
D) A light coat color reflects more light and therefore mice with light coats have a lower predation rate.
A) A dark coat color provides camouflage to mice on the lava flow rocks; therefore, mice with dark coats have a lower predation rate in that habitat.

Researchers have undertaken a long-term study of populations of rock pocket mice, Chaetodipus intermedius, in Arizona and New Mexico. Rock pocket mouse fur is either dark or light in color. Most of the populations studied live in areas with light-colored granite rocks; however, some areas are dominated by dark-colored rocks from ancient lava flows. Researchers collected mice from six sites in Arizona and recorded their coat colors. Figure 1 shows the study sites, the rock colors, and the distribution of coat colors.
In the Arizona populations, the melanocortin-1 receptor (MC1R) gene is responsible for coat color phenotype (light or dark). The MC1R D allele, which results in a dark coat, is dominant to the d allele. Researchers collected samples of mice from all six study sites and sequenced the MC1R gene. They also collected mice with dark coats from a location in New Mexico, the Carrizozo lava flow, to determine if the MC1R gene was also responsible for the dark coat colors observed in that population. The rock pocket mouse population in Carrizozo is isolated from the populations in Arizona. Table 1 presents the genotypic data from sampled mice from all seven locations.
Based on the data in Table 1, which of the following best describes the relationship between the MC1R gene and coat color in the Carrizozo, New Mexico, rock pocket mouse population?
A) The MC1R D allele is responsible for dark coat color in the Carrizozo population and likely spread from the Arizona population through migration.
B) The MC1R D allele is not responsible for dark coat color in the Carrizozo population, so the dark coat color is likely a result of convergent evolution.
C) The MC1R D allele is absent from the Carrizozo population, so all the mice in this population must have coats that are light in color.
D) The MC1R D allele is absent from the Carrizozo population because of different environmental pressures in the Carrizozo population.
B) The MC1R D allele is not responsible for dark coat color in the Carrizozo population, so the dark coat color is likely a result of convergent evolution.
passage sayd the mice in carrizaro are dark, but not caused by the MC1R D allele. meaning another allele is causing the fur to turn black; example of convergent evolution

Researchers have undertaken a long-term study of populations of rock pocket mice, Chaetodipus intermedius, in Arizona and New Mexico. Rock pocket mouse fur is either dark or light in color. Most of the populations studied live in areas with light-colored granite rocks; however, some areas are dominated by dark-colored rocks from ancient lava flows. Researchers collected mice from six sites in Arizona and recorded their coat colors. Figure 1 shows the study sites, the rock colors, and the distribution of coat colors.
In the Arizona populations, the melanocortin-1 receptor (MC1R) gene is responsible for coat color phenotype (light or dark). The MC1R D allele, which results in a dark coat, is dominant to the d allele. Researchers collected samples of mice from all six study sites and sequenced the MC1R gene. They also collected mice with dark coats from a location in New Mexico, the Carrizozo lava flow, to determine if the MC1R gene was also responsible for the dark coat colors observed in that population. The rock pocket mouse population in Carrizozo is isolated from the populations in Arizona. Table 1 presents the genotypic data from sampled mice from all seven locations.
The researchers built an enclosure to prevent migration into and out of the O’Neill rock pocket mouse population for a period of two years.
Which of the following best predicts the effect of the enclosure on the O’Neill population?
A) The O’Neill population will rapidly evolve into a separate species.
B) The O’Neill population will become less diverse due to the bottleneck effect.
C) The frequency of the MC1R D allele will decline due to natural selection.
D) One of the alleles for the MC1R gene will become fixed due to genetic drift.
C) The frequency of the MC1R D allele will decline due to natural selection.

Researchers have undertaken a long-term study of populations of rock pocket mice, Chaetodipus intermedius, in Arizona and New Mexico. Rock pocket mouse fur is either dark or light in color. Most of the populations studied live in areas with light-colored granite rocks; however, some areas are dominated by dark-colored rocks from ancient lava flows. Researchers collected mice from six sites in Arizona and recorded their coat colors. Figure 1 shows the study sites, the rock colors, and the distribution of coat colors.
In the Arizona populations, the melanocortin-1 receptor (MC1R) gene is responsible for coat color phenotype (light or dark). The MC1R D allele, which results in a dark coat, is dominant to the d allele. Researchers collected samples of mice from all six study sites and sequenced the MC1R gene. They also collected mice with dark coats from a location in New Mexico, the Carrizozo lava flow, to determine if the MC1R gene was also responsible for the dark coat colors observed in that population. The rock pocket mouse population in Carrizozo is isolated from the populations in Arizona. Table 1 presents the genotypic data from sampled mice from all seven locations.
Which of the following is closest to the frequency of theMC1R D allele in the Tule Mountain population?
A) 0.03
B) 0.06
C) 0.94
D) 0.97
A) 0.03
80/85= q²
sqrt(80/85) - 1 = p

Researchers have undertaken a long-term study of populations of rock pocket mice, Chaetodipus intermedius, in Arizona and New Mexico. Rock pocket mouse fur is either dark or light in color. Most of the populations studied live in areas with light-colored granite rocks; however, some areas are dominated by dark-colored rocks from ancient lava flows. Researchers collected mice from six sites in Arizona and recorded their coat colors. Figure 1 shows the study sites, the rock colors, and the distribution of coat colors.
In the Arizona populations, the melanocortin-1 receptor (MC1R) gene is responsible for coat color phenotype (light or dark). The MC1R D allele, which results in a dark coat, is dominant to the d allele. Researchers collected samples of mice from all six study sites and sequenced the MC1R gene. They also collected mice with dark coats from a location in New Mexico, the Carrizozo lava flow, to determine if the MC1R gene was also responsible for the dark coat colors observed in that population. The rock pocket mouse population in Carrizozo is isolated from the populations in Arizona. Table 1 presents the genotypic data from sampled mice from all seven locations.
The researchers determined that the East lava flow population is not in Hardy-Weinberg equilibrium.
Which of the following best explains why the population is not in Hardy-Weinberg equilibrium?
A) The presence of heterozygotes for MC1R the gene in the East lava flow population indicates that mating is occurring randomly between mice with different coat colors.
B) The selective pressures on the East lava flow population are not strong enough to maintain Hardy-Weinberg equilibrium.
C) The East lava flow population does not experience migration, which is a required condition for Hardy-Weinberg equilibrium.
D) The presence of MC1R alleles in the East lava flow population is an indication of gene flow from mice populations living on light granite rocks.
D) The presence of MC1R alleles in the East lava flow population is an indication of gene flow from mice populations living on light granite rocks.
Geologic events such as mountain building can directly affect biodiversity. The Sino‑Himalayan fern, Lepisorus clathratus is widely distributed on the Qinghai‑Tibetan plateau.
If geologic events lead to a series of new mountain ranges that divide the plateau into several discrete valleys, which of the following best describes how the L. clathratus population would be affected?
A) Geographic isolation will create separate gene pools, leading to speciation over time.
B) Gene flow will be reduced by sexual selection and polyploidy.
C) Chance events will cause allele frequencies to fluctuate unpredictably from one generation to the next.
D) Ferns reproduce asexually, so there will be no impact on the gene pool of the species.
A) Geographic isolation will create separate gene pools, leading to speciation over time.
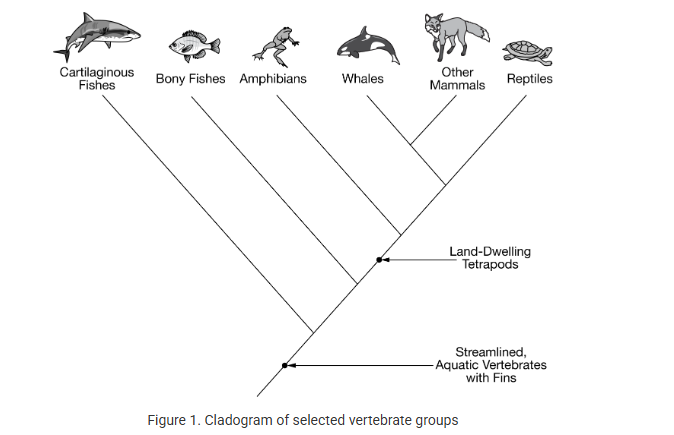
Whales, bony fishes, and cartilaginous fishes all have similar adaptations that enable them to live in the ocean. Figure 1 shows the phylogenetic relationships of selected vertebrates.
Based on the phylogenetic relationships shown in Figure 1, which of the following best explains the similarities exhibited by whales, bony fishes, and cartilaginous fishes?
A) Convergent evolution, because these organisms do not share a recent common ancestor.
B) Adaptive radiation, because all three groups evolved from a unique, shared common ancestor from the cartilaginous fishes group.
C) Mutation, because the shared traits can be traced back to a shared recent common ancestor.
D) Founder effect, because all three groups formerly existed together as one population that then was disrupted, causing speciation.
A) Convergent evolution, because these organisms do not share a recent common ancestor.
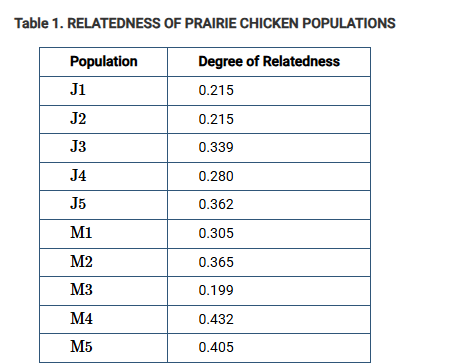
The degrees of relatedness in several native populations of prairie chickens in Marion and Jasper Counties in Illinois were determined. The degree of relatedness is inversely proportional to genetic diversity; that is, populations with a high degree of relatedness have less genetic diversity. Table 1 shows the collected data. Populations J1 through J5 are located in Jasper County. Populations M1 through M5 are located in Marion County. Numbers above 0.125 indicate a high degree of relatedness.
Scientists claim that some of the populations in Marion County are at an increased risk of decline or extinction. Based on the data in table 1, which of the following best provides evidence to support this claim?
A) The Marion County populations have a higher rate of mutation than the Jasper County populations, as evidenced by the higher degrees of relatedness.
B) The Marion County populations are less stable because they are smaller than the Jasper County populations.
C) The M2 population has a higher degree of relatedness than the M1 population, meaning that it has more genetic diversity.
D) The M4 and M5 populations have the lowest genetic diversity of all populations.
D) The M4 and M5 populations have the lowest genetic diversity of all populations.
In addition to the ABO blood groups, humans have an MN blood type system in which the M and N alleles are codominant to one another. A group of scientists found that in one population the frequency of the M allele was 0.82, and the frequency of the N allele was 0.18.
Assuming that the population is in Hardy-Weinberg equilibrium, which of the following is the expected frequency of individuals with the genotype MN?
A) 0.148
B) 0.295
C) 0.640
D) 0.672
B) 0.295
(0.18)(0.82)(2)=2pq
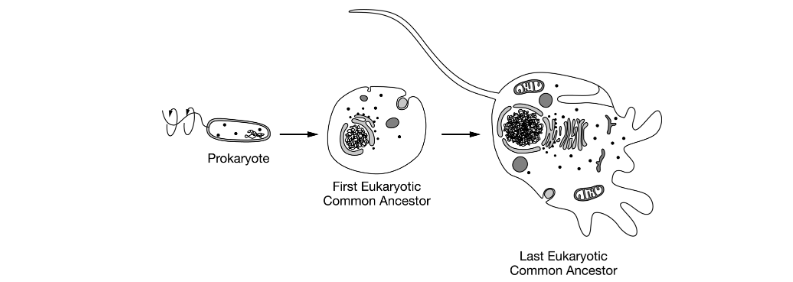
Figure 1 shows some major structural changes between a typical prokaryotic cell, the first eukaryotic common ancestor, and the last eukaryotic common ancestor.
Based on the information provided in the figure, which of the following best predicts how membrane-bound organelles provided unique evolutionary advantages to the last eukaryotic common ancestor?
A) Cells with nuclear membranes were better able to protect their genetic material against damage.
B) Cells with flagella were better able to find food and escape predators.
C) Cells with ribosomes were better able to produce proteins needed for a variety of metabolic functions.
D) Cells with mitochondria were able to utilize metabolic energy more efficiently.
D) Cells with mitochondria were able to utilize metabolic energy more efficiently.
Some plant species flower in response to increasing daily temperatures in the spring. Many of these species rely on pollinators that migrate based on changes in day length and the position of the Sun. The current global warming trend is placing new selective pressures on the species involved in these relationships.
Which of the following best explains the impact of these new selective pressures on the organisms involved?
A) If the environment for the plant species becomes too warm, the pollinators will no longer migrate to that area in the spring, continuing on to a more northern environment instead.
B) The warmer temperatures will lead to a drier environment, so the plants will no longer produce enough nectar to attract the pollinators.
C) The plant species will flower earlier in the spring in response to rising temperatures before the arrival of the pollinators, so seeds will not be produced.
D) Migrating pollinators will start migrating later in the year, switching from spring-flowering plants to summer-flowering plants.
C) The plant species will flower earlier in the spring in response to rising temperatures before the arrival of the pollinators, so seeds will not be produced.
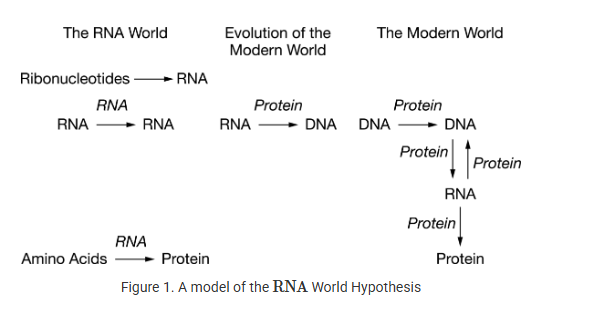
One facet of the study of the origin of life focuses on the nature of the first genetic material. Figure 1 describes a possible scenario, known as the RNA World Hypothesis, that could have led to the evolution of our modern-day genetic material. This hypothesis states that the first genetic material was RNA, not DNA, and a transitional period led to the emergence of DNA as the storage molecule for genetic material.
A scientist wishes to provide experimental evidence to support the model shown in Figure 1 by demonstrating the ability to synthesize an RNA molecule. Which of the following is an alternative hypothesis that can be tested to support the RNA World Hypothesis?
A) A protein template that matches proteins found on the primitive Earth added to a mixture of deoxyribonucleotides will produce double-stranded DNA molecules.
B) Double strands of DNA placed in a harsh environment will unwind and form RNA molecules for long term information storage.
C) A pool of amino acids can spontaneously form into single-stranded RNA, which would then code for proteins.
D) A mixture of ribonucleotides such as adenine and uracil will spontaneously form single extended chains of RNA.
D) A mixture of ribonucleotides such as adenine and uracil will spontaneously form single extended chains of RNA.
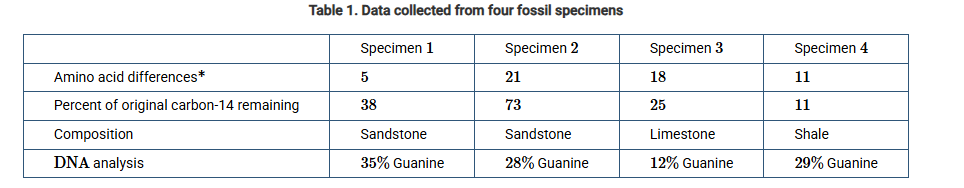
Scientists want to determine the age of four fossil specimens. They have analyzed the fossils and gathered the data shown in Table 1.
amino acid differences of a conserved protein compared with a fifth fossil specimen
Which of the specimens indicated in the table is the oldest?
A) Specimen1
B) Specimen2
C) Specimen3
D) Specimen4
D) Specimen4
been decaying the longest because it has the less percentage of carbon-14 left
A researcher created an experimental chamber that allowed a population of fruit flies to mate randomly, but where female flies had to choose one of three side-chambers in which to lay eggs. All three side-chambers were the same except for the added scent of apple in side-chamber A, banana in side-chamber B, and cucumber in side-chamber C. Only eggs deposited in side-chamber C were allowed to hatch and produce offspring. Adult flies did not know which side-chamber was producing offspring. Every day for 100 days, the researcher counted the number of flies in each side-chamber. By day 100, the number of flies in side-chamber C greatly increased, while the number of flies in side-chambers A and B had greatly decreased.
Which of the following statements best explains why there were more flies in side-chamber C, than in side-chambers A or B, on day 100?
A) More flies were entering side-chamber C because flies that prefer the scent of cucumber were artificially selected for.
B) More flies were entering side-chamber C because female flies learned which side-chamber allowed for successful reproduction.
C) More flies were entering side-chamber C because female fruit fly offspring produced in side-chambers A and B were less fit for the environment.
D) More flies were entering side-chamber C because male fruit fly offspring produced in side-chambers A and B were less fit for the environment.
A) More flies were entering side-chamber C because flies that prefer the scent of cucumber were artificially selected for.
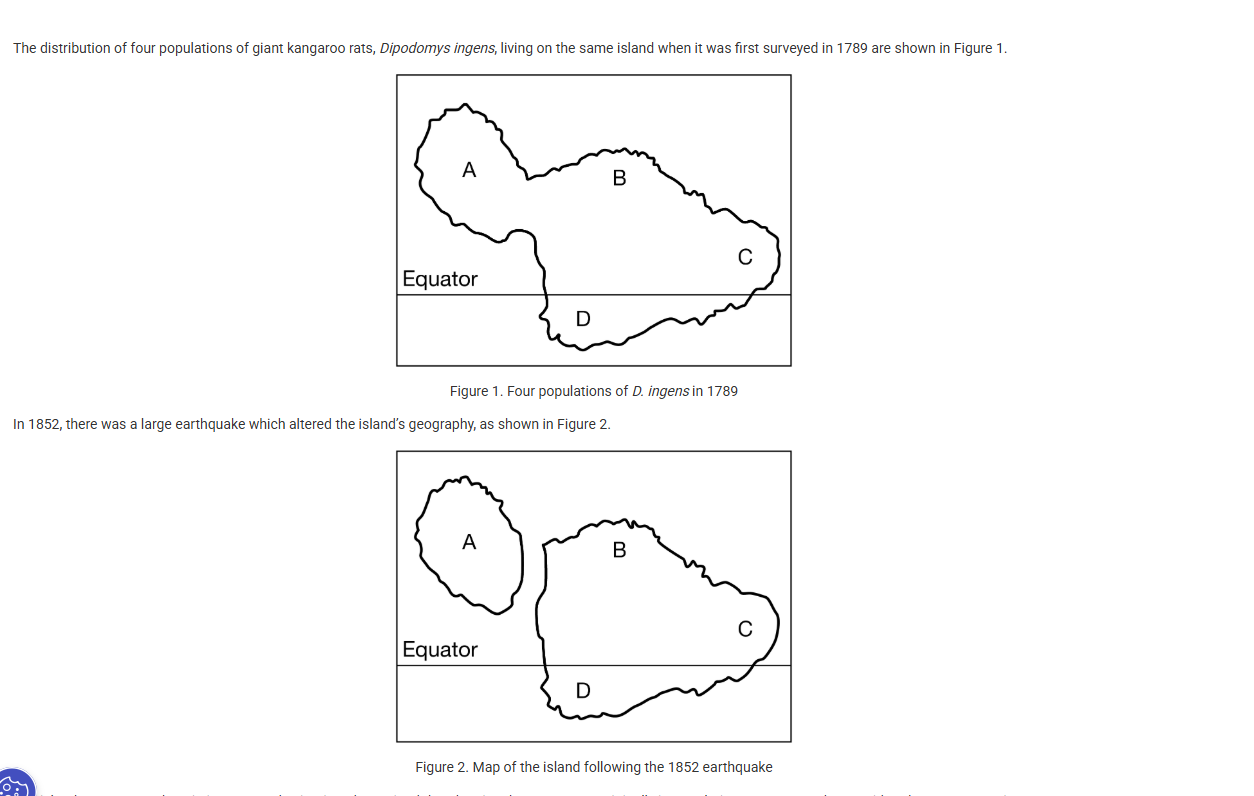
The distribution of four populations of giant kangaroo rats, Dipodomys ingens, living on the same island when it was first surveyed in 1789 are shown in Figure 1.
In 1852, there was a large earthquake which altered the island’s geography, as shown in Figure 2.
The island was surveyed again in 2015, and scientists determined that the giant kangaroo rats originally in population A are now to be considered as a new species.
Which of the following best explains the mechanism that caused this speciation event in the giant kangaroo rats of population A?
A) The animals in population A were exposed to different predators and had to modify their fur color to be better camouflaged.
B) The animals in population A were reproductively isolated from those in populations B, C, and D.
C) The animals in population A accumulated fewer genetic mutations, adapting to their microclimate.
D) The animals in population A mate at different times of year, causing their gametes to be incompatible with those from animals in populations B, C, and D.
B) The animals in population A were reproductively isolated from those in populations B, C, and D.
Mollusk fossils were excavated and collected from a coastal cliff. Scientists studying the fossils observed patterns of changing shell shape in the mollusks. The scientists identified a period of stability or stasis, followed by rapid change, and then stasis again with regard to shell shape.
Which of the following statements best predicts the result of a comparison between the fossils found before and after the period of rapid change?
A) The same species will be found in both static periods, but they will have different shell shapes.
B) The same species will be found in both static periods, but the species in the second static period will have smaller shells due to the stress of undergoing rapid change.
C) Most of the species found in the first static period will be absent in the second static period.
D) Most of the species found in the second static period will resemble each other more than the species found in the first static period.
C) Most of the species found in the first static period will be absent in the second static period.
after rapid-change period, you’d expect: many original species gone and new species appearing
Because cheetahs, Acinonyx jubatus, experienced a bottleneck event about ten thousand years ago, living cheetahs exhibit very little genetic variation compared to other living species of large cats.
Which of the following principles best justifies a claim that cheetahs, compared to other large cats, have a relatively low resilience to environmental perturbations?
A) A captive population of cheetahs kept in a confined area will have a greater risk of contracting and passing on a virus.
B) When a population is reduced, new niches become available in the environment, which can trigger adaptive radiation.
C) Populations with little genetic diversity are less likely to contain individuals that can withstand different selective pressures.
D) Populations with low genetic diversity are more likely to contain individuals that can withstand different selective pressures.
C) Populations with little genetic diversity are less likely to contain individuals that can withstand different selective pressures.
A team of scientists grew small pieces of coral in controlled tanks. Once these pieces of coral reached sufficient size, they were transferred to natural reefs to replace lost corals in the ocean. A scientist from the team suggested revising the experiment so that the water temperature in all the tanks would be increased to 0.5 degrees C above the normal ocean temperature. The corals pieces that survived the increased temperature in the tank would be separated and allowed to grow into different colonies. When these new colonies grown from those coral pieces grown in warmer water reached sufficient size, they would be transferred to natural reefs.
Which of the following statements predicts the most likely outcome of the revised experiment?
A) The increased temperature will induce corals to create new genes, which will allow the corals to withstand future increases in ocean temperature.
B) Stress from the increased temperature will cause corals to evolve into a new species that can tolerate future increases in ocean temperature.
C) After being transferred to the natural reef, the new colonies of corals will return to their previous heat tolerance level and will not survive future increases in ocean temperature.
D) The new colonies of corals are artificially selected for tolerating an increased temperature, so they will be better adapted to moderate future increases in ocean temperatures.
D) The new colonies of corals are artificially selected for tolerating an increased temperature, so they will be better adapted to moderate future increases in ocean temperatures.
In a particular region, a species of lizard lives in the lowlands. Even though there are numerous mountains in the region, the climate on the mountains is too cold for the lizards to survive. Scientists are concerned that the lowlands will become much warmer by the end of the twenty-first century and will become unsuitable for this lowland lizard species.
Which of the following best predicts the impact on the lizard species if there is a gradual increase in the average temperatures found in both the lowlands and mountains in this region?
A) Some lizards will migrate to new habitats in the mountains and become isolated, leading to allopatric speciation.
B) The species will undergo artificial selection, as the genes will adapt to warmer temperatures.
C) The species will experience a genetic bottleneck, and sympatric speciation will result in the development of several new species.
D) The lizards will hybridize with a different lizard species that is adapted to a warmer environment, leading to increased genetic variation in the species.
A) Some lizards will migrate to new habitats in the mountains and become isolated, leading to allopatric speciation.
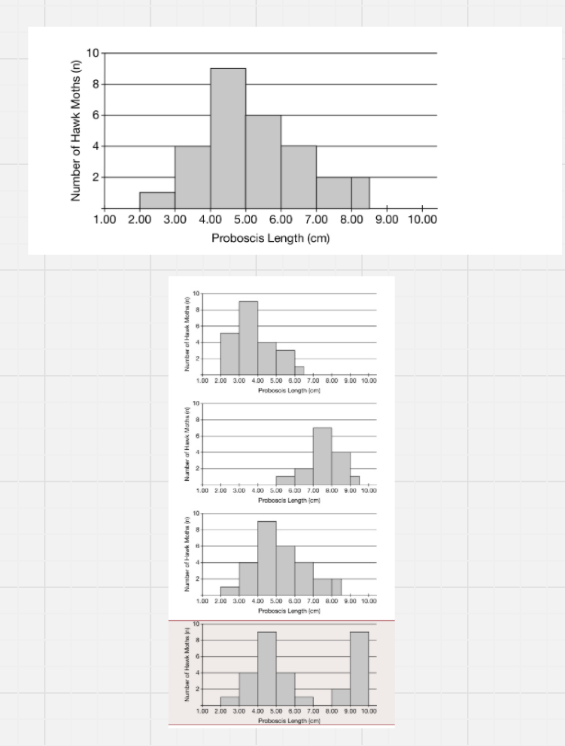
Tobacco hawk moths, Manduca sexta, feed exclusively on sugar-rich nectar produced in the flowers of tobacco plants. To feed, the moth inserts its proboscis (a long, tubular mouthpart) into the flower to reach the nectary, which is usually at the end of a long tube in the flower. Moths will feed on the nectar of the tobacco plant species whose nectaries they can access. A study determined the proboscis sizes in one tobacco hawk moth population. The data are shown in Figure 1. The most abundant tobacco species in the population’s habitat has a nectary tube that is 5cm long.
Over the next year, a virus attacks and rapidly kills almost all plants of the tobacco species. A closely related species of tobacco that is resistant to the virus becomes established during that same year. The nectary tube in the resistant species averages 7.5cm. Scientists monitored the area for the next five years to determine how this change affected the moth population.
Which of the following best describes the expected distribution of proboscis size of the moths at the end of the five‑year study?
B
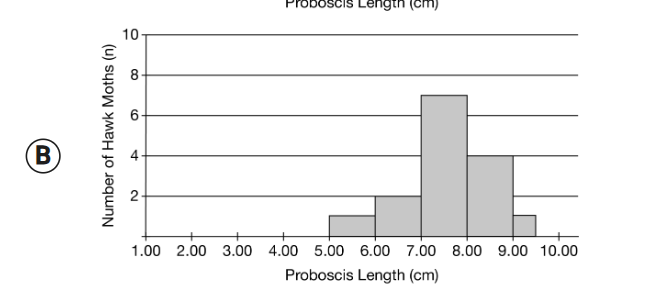
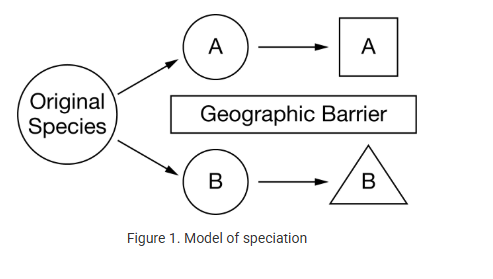
Students created a model showing one possible mechanism for speciation in which a geographic barrier separated one large population into two smaller populations, A and B. Over time, populations A and B developed into two distinct species. The model is shown in Figure 1.
Which of the following best describes what occurred during the periods indicated by the arrows?
A) Natural selection acted on variation that was present in both populations A and B, and the lack of gene flow eventually led to the formation of two new species.
B) Population B was separated for a longer time from the original population than population A was, and population B evolved into a more distinct new species than population A did.
C) Gene flow between populations A and B maintained sufficient variation in both gene pools to facilitate the development of two distinct species.
D) In response to different environments, populations A and B experienced different mutation rates, leading to the emergence of two different gene pools and, over time, new species A and B.
A) Natural selection acted on variation that was present in both populations A and B, and the lack of gene flow eventually led to the formation of two new species.
The peppered moth, Biston betularia was generally white in color with black speckles. Over time a more solid black moth became the more common variety. Which of the following best explains the relationship between wing pigmentation and the coloration of a moth’s surroundings?
A) The frequencies of the different phenotypes in the moth population changed randomly due to genetic drift.
B) If the surroundings of the peppered moth became darker, those backgrounds conferred a selective advantage to a black variety, as described by natural selection.
C) There was a gene flow of the black variety, spreading it throughout the moth’s normal range.
D) The black variety was a nineteenth century mutation, dominant to the peppered variety. The allele for the peppered trait, being recessive, decreased in frequency over time
B) If the surroundings of the peppered moth became darker, those backgrounds conferred a selective advantage to a black variety, as described by natural selection.
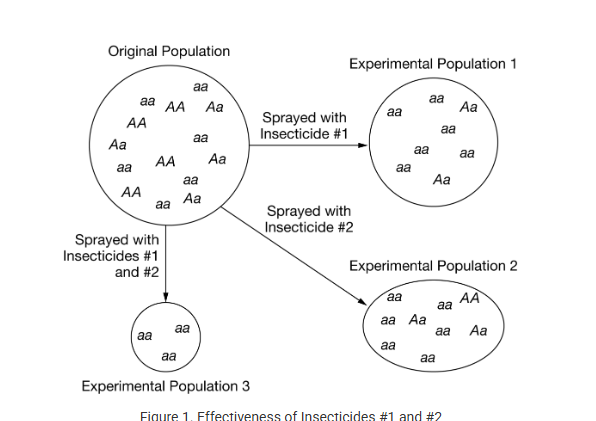
Of the following, which is the best next step for the researchers to best determine the long-term effectiveness of these insecticides with regards to the development of resistance?
A) Continue treating the three insect populations with the same insecticides and determine whether their efficiencies decline significantly after several generations.
B) Add an additional treatment group to the experiment to measure the effectiveness of another insecticide (Insecticide #3) over several generations.
C) Set up a new experiment in which these insects are sprayed with two different insecticides to see if they are more effective than Insecticides #1 and #2.
D) Spray these insecticides on a different species of insect (whose genotypes are also known) to determine its effectiveness on insects that are not pests.
A) Continue treating the three insect populations with the same insecticides and determine whether their efficiencies decline significantly after several generations.
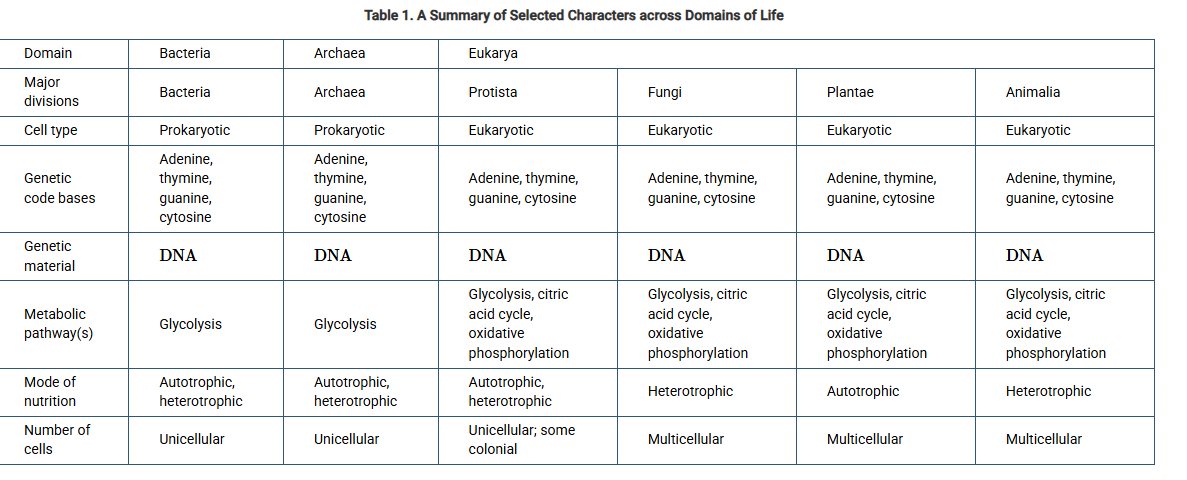
Which of the following sets of data provides evidence that best supports common ancestry for organisms in all three domains?
A) There are autotrophic and heterotrophic organisms found in Bacteria, Archaea, and Eukarya.
B) There is a progression of pathways in organisms found in Bacteria, Archaea, and Eukarya.
C) Organisms in Bacteria, Archaea, and Eukarya each have adenine, thymine, guanine, and cytosine bases forming their DNA.
D) There is a progression of cellular organization in organisms found in Bacteria, Archaea, and Eukarya.
C) Organisms in Bacteria, Archaea, and Eukarya each have adenine, thymine, guanine, and cytosine bases forming their DNA.
The heterotroph hypothesis of the origin of life states that basic organic building blocks formed from inorganic molecules under the primitive conditions present early in Earth’s development. These building blocks combined to form polymers, such as crude proteins. Dr. Sidney Fox wished to add to the heterotroph hypothesis of the origin of life by synthesizing simple proteins from a mixture of amino acids.
Which statement below best states an alternative hypothesis Fox could have used to frame his research?
A) Formation of crude proteins occurs by chance and occurs regardless of atmospheric O2 levels or available free energy.
B) Given aerobic conditions and large amounts of lightning, amino acids will spontaneously form crude proteins.
C) Formation of simple proteins on primitive Earth only occurs spontaneously if the required building blocks were transported to Earth by a celestial event or a meteorite.
D) In the presence of available energy and the absence of a significant quantity of atmospheric O2 simple proteins will form spontaneously from a mixture of amino acids.
D) In the presence of available energy and the absence of a significant quantity of atmospheric O2 simple proteins will form spontaneously from a mixture of amino acids.
Iridium is an element that is rare on Earth but commonly found in meteorites. A scientist believes that the first organic molecules may have come to Earth on meteorites 3.6 billion years ago. Which of these would be an appropriate null hypothesis to test related to whether meteorites hit the Earth 3.6 billion years ago?
A) If sediment layers that are 3.6 billion years old are tested, they will contain relatively high iridium levels, because that is when many meteorites crashed into the Earth.
B) There is no difference in iridium levels in sediments that were deposited on Earth 3.6 billion years old, compared to recent sediments.
C) If a sediment layer that is 3.6 billion years old is tested, it will contain organic material.
D) If recently fallen meteorites and meteoroids collected in space are tested, they will not contain organic molecules.
B) There is no difference in iridium levels in sediments that were deposited on Earth 3.6 billion years old, compared to recent sediments.
null hypothesis: NO difference, NO effect, NO relationship
In addition to the ABO blood groups, humans have an MN blood type system in which the M and N alleles are codominant to one another. These alleles code for glycoproteins that act as antigens on the red blood cells. Scientists determined the frequencies of the M and N alleles in three localized and stable human populations in the Philippines. In Isabela, M and N alleles had frequencies of 0.8 and 0.21, respectively. Butuan had M and N allele frequencies of 0.82 and 0.18, respectively. Metro Manila had M and N allele frequencies of 0.55 and 0.51, respectively.
Which of the following would most affect the allelic frequencies of the populations on Isabela and Butuan?
A) Migration of individuals between the Isabela and Butuan populations
B) Immigration of individuals from Metro Manila into the two populations
C) Random mating within each population
D) Increased population sizes over time in the Isabela population, but no change in the Butuan population
B) Immigration of individuals from Metro Manila into the two populations
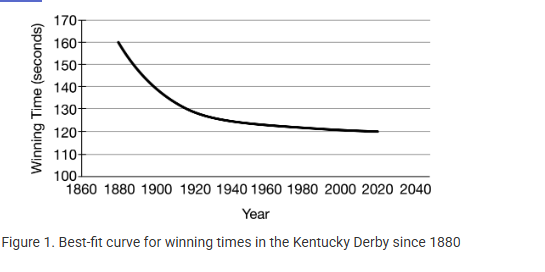
Thoroughbred race horses are subject to intense artificial selection to produce faster-running horses. The results of breeding programs can be seen in the change in winning times of the Kentucky Derby from 1880 to the present, as shown in Figure 1.
Which of the following best explains the trend shown in Figure 1?
A) The distance the horses ran became shorter between 1880 and 1940.
B) All of the selective breeding programs ended in 1940.
C) After 1940, natural selection prevented any additional speed increases.
D) By 1940, most genetic variation for speed had been lost from the gene pool.
D) By 1940, most genetic variation for speed had been lost from the gene pool.
There are two species of elephant seals: northern elephant seals, Mirounga angustirostris, found off the western coast of North America from Baja California to the Gulf of Alaska, and southern elephant seals, M. leonina, found in the southern oceans. Hunting in the nineteenth century has been blamed for a drastic reduction in the northern elephant seal population. Even though the population has rebounded following restrictions on seal hunting, genetic variation is greatly reduced in the northern species compared to that in the southern species.
Which of the following conditions of Hardy-Weinberg equilibrium was most likely not met in the northern elephant seal population following overhunting?
A) Absence of selection
B) No new mutations
C) Random mating
D) Large population size
D) Large population size
small population typically leads to less genetic variation
In a certain small mammal, fur color is controlled by a pair of alleles, with B being dominant over b. The genotypes BB and Bb result in dark-colored fur, the genotype bb results in light-colored fur. A population of the species has the following allele frequencies: B=0.85 and b=0.15. If a fire caused the surface of the ground in the habitat of the species to become darker in color, which of the following claims about the impact on the allele frequencies in this population is most reasonable?
A) The frequency of homozygous recessive individuals will increase because light-colored fur absorbs less heat.
B) The frequency of the B allele will increase because light-colored individuals will be more visible to predators.
C) The frequency of the b allele will increase because there will be more heterozygous individuals.
D) The frequency of both alleles will increase because the population will enter a period of rapid growth.
B) The frequency of the B allele will increase because light-colored individuals will be more visible to predators.
A group of researchers noticed that using a particular drug to treat cancer in mice would reduce the size of the tumor, but some of the tumor cells appeared to be resistant to the drug since some of these cells would increase in number over time. The researchers wish to increase the reliability of their experimental observations before investigating new claims that chemotherapy-resistant tumors are an example of continuing evolution.
Of the following, which is the best next step the researchers might take to increase the reliability of their evidence?
A) Increasing the dose of chemotherapy being administered to the mice
B) Increasing the number of trials and the number of mice in each treatment group
C) Plotting the tumor volume data as a graph rather than as a table
D) Isolating resistant tumor cells and looking for novel mutations in proto-oncogenes
B) Increasing the number of trials and the number of mice in each treatment group
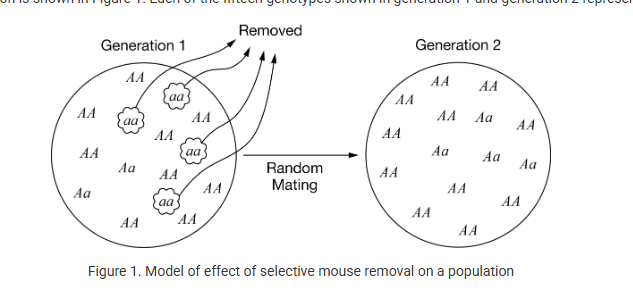
A population geneticist is conducting an investigation on a population of mice. The geneticist determines the genotypes for a particular trait of all of the mice in the population during generation 1 and then removes all of the mice with genotype aa. The remaining members of the population are allowed to randomly mate with one another to produce generation 2 and future generations. A model of the investigation is shown in Figure 1. Each of the fifteen genotypes shown in generation 1 and generation 2 represents 100 mice
Which of the following best illustrates the change in the frequencies of the A and a alleles from generation 1 to generation 2 and to future generations, assuming Hardy-Weinberg equilibrium is present after generation 1?
A)
Future generations will have the same frequencies of the A and a alleles as generation 2. Individuals with the aa genotype could be produced.
Generation 1 | Generation 2 | Generation n | |
|---|---|---|---|
A | 0.67 | 0.87 | 0.87 |
a | 0.33 | 0.13 | 0.13 |
B)
Future generations will eventually completely lose the a allele from the gene pool. There will not be any new individuals with the aa genotype.
Generation 1 | Generation 2 | Generation n | |
|---|---|---|---|
A | 0.67 | 0.87 | 1.0 |
a | 0.33 | 0.13 | 0 |
C)
Future generations will completely lose the a allele from the gene pool. There will no longer be individuals with the aa genotype.
Generation 1 | Generation 2 | Generation n | |
|---|---|---|---|
A | 0.73 | 1.0 | 1.0 |
a | 0.27 | 0 |
D)
Future generations will have fewer a alleles in the gene pool but will not completely lose the allele. There will be a few individuals with the aa genotype.
Generation 1 | Generation 2 | Generation n | |
|---|---|---|---|
A | 0.73 | 0.87 | 0.95 |
a | 0.27 | 0.13 | 0.05 |
A)
Future generations will have the same frequencies of the A and a alleles as generation 2. Individuals with the aa genotype could be produced.
Generation 1 | Generation 2 | Generation n | |
|---|---|---|---|
A | 0.67 | 0.87 | 0.87 |
a | 0.33 | 0.13 | 0.13 |
A scientist is studying the impact of mutagens on genetic variation in mice. In an experiment, the scientist creates two groups of twenty highly inbred mice. Because the mice are highly inbred, they are essentially identical to one another. One group is given food with an added substance that is known to be a mutagen. The second group is fed the same food without the mutagen. After several generations, both groups of mice are given a new type of food that is harder to digest than the previous food. After rearing five additional generations of the mice on this new food, the two groups are assessed for how efficiently this new food is digested.
Which of the following is the most reasonable prediction about the results of the experiment?
A) Neither group of mice will show any change in the ability to digest the food because thousands of years are required to develop such a change.
B) Both groups of mice will show an increase in the ability to digest the new food, because they experienced the same selective pressures.
C) The group of mice fed the mutagen will show a greater ability to digest the food, because the higher genetic variation within the group makes it more likely that some individuals will have a combination of genes better adapted to the new food.
D) The group fed the mutagen will show a decrease in the ability to digest the new food, because the mutagen prevented natural selection from acting on them.
C) The group of mice fed the mutagen will show a greater ability to digest the food, because the higher genetic variation within the group makes it more likely that some individuals will have a combination of genes better adapted to the new food.
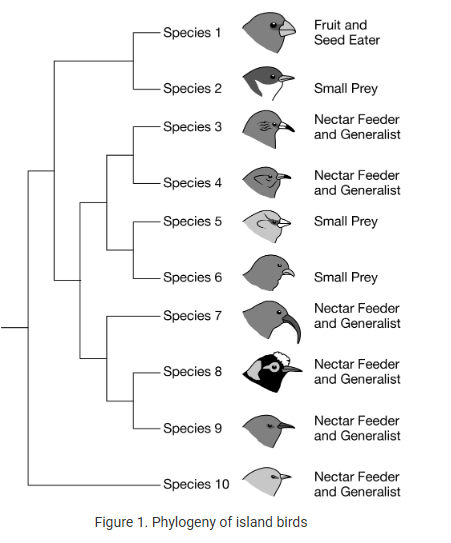
A group of birds is found in an island chain that have all descended from a single ancestral species. Figure 1 shows the phylogeny of the birds.
Which of the following best explains the divergence in morphology in the birds?
A) The original habitat contained mutagens, leading to the rise of new species as a result of accumulated mutations.
B) The original habitat had many available unoccupied ecological niches that were colonized by populations of the original species.
C) The original habitat contained many predators, and the species diversified in order to avoid extinction.
D) The original habitat was tropical, which increased the rate of mutation and led to rapid diversification.
B) The original habitat had many available unoccupied ecological niches that were colonized by populations of the original species.
A group of researchers claim that chance events play an important role in the evolution of populations. To test their claim, they monitored 12 populations of E. coli for 10,000 generations under the same environmental conditions. They found that although all 12 populations were exposed to the same environmental pressures, each population had differentiated from one another genetically after 10,000 generations.
Which of the following statements includes a reasonable refinement that researchers could use in repeating the experiment?
A) Start each population with genetically identical bacterial cells from a single culture to make sure that the initial genetic variation in all of the populations was exactly the same.
B) Start each population with a different species of bacteria to determine whether the same environment has an effect on genetic differentiation.
C) Start each population with bacterial cells that have different genotypes to make sure there is enough genetic variation for selection to occur.
D) Start each population with bacteria that differ from one another by a single mutation to ensure that the initial genetic variation in all populations is known.
A) Start each population with genetically identical bacterial cells from a single culture to make sure that the initial genetic variation in all of the populations was exactly the same.