Exam 3 Study Guide - Ch. 14-18.
1/34
There's no tags or description
Looks like no tags are added yet.
Name | Mastery | Learn | Test | Matching | Spaced | Call with Kai |
|---|
No analytics yet
Send a link to your students to track their progress
35 Terms
Species richness
number of species within a community
Species diversity
measure of community structure that combines
number of species and abundance compared with other species
species eveness
describes commonness (or rarity) of species within a community
community
group of interacting species
functional group
organisms that function in similar ways but
may/may not use similar resources
guild
group of species that use the same resources
facilitation cascade
indirect positive effect of another species on a consumers prey that benefits the consumer
trophic cascade
indirect effects of consumers on resources
keystone species
strong interactors that have large effects on
communities because of their role not abundance or size
hyper-keystone species
species that drive complex interaction chains
by affecting other keystone actors
ecosystem engineer
organisms that directly or indirectly
modulate availability of resources by causing physical state changes in abiotic or biotic materials
foundation species
organisms that have large effects
on communities because of their size and abundance
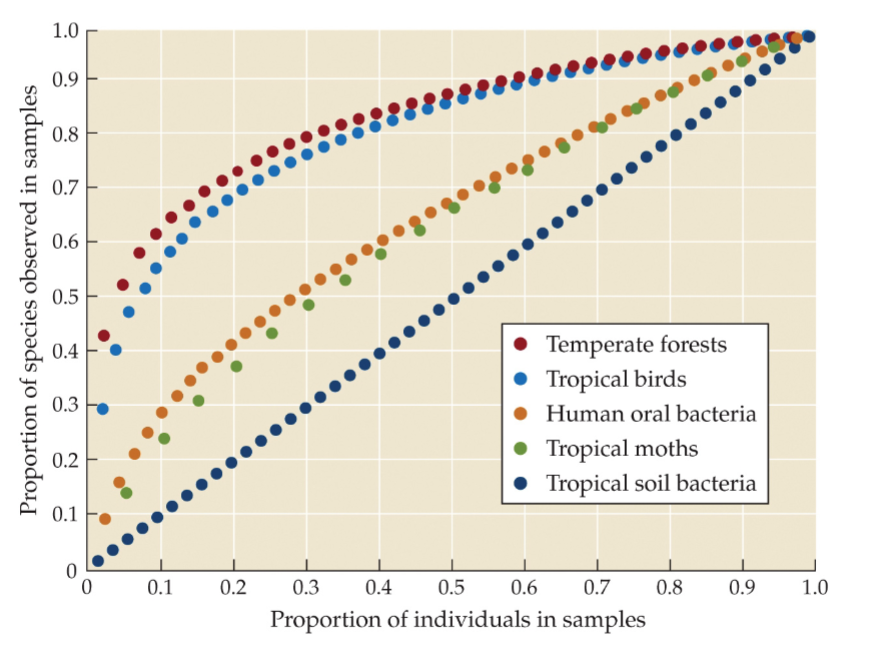
Temperate forests; tropical soil bacteria
Which of the following datasets is most well sampled? Which is least well sampled?
Sequential megafaunal collapse hypothesis
the name of the proposed explanation for this shift in the ecological community of kelps in Alaska
niche partitioning, species interactions, neutral models, intermediate disturbance hypothesis
4 mechanisms that explain coexistence
ecosystem function
broad term encompassing the biological activities that maintain life
ecosystem services
natural processes that sustain human life
high; low; trophic skew
Fill in the blanks. Extinctions are biased towards __________ trophic levels. Invasions are
biased towards ________ trophic levels. Even if overall species richness is constant, these
combined effects can lead to _________.
c. Only some plants take up marine N at spawning creeks
The following table summarizes δ15N measurements from plants at spawning creeks (with salmon) relative to reference creeks (no salmon). What pattern does the data suggest?
a. Plants are taking up marine N at both creeks
b. Plants are taking up marine N at spawning creeks
c. Only some plants take up marine N at spawning creeks
d. Salmon are delicious
d. Movement, transformation
Biogeochemistry is the study of the physical, chemical, and biological factors that
influence _______ and ______ of chemical elements
a. Transfer, conversion
b. Flow, modification
c. Transport, metamorphosis
d. Movement, transformation
plant; anthropogenic; minerals
What are the three main sources of nitrogen-based nutrients and explain how each enters
the ecosystem.
nitrogen fixation
uptake of N2 and conversion to usable form
strong bonds
Why is Nitrogen a limiting nutrient when it is the most abundant component of Earth’s
atmosphere?
autogenic engineer
change environment with their own physical structurea
allogenic engineer
change environment by transforming living or non-living materials
weather
actual state of the atmosphere at a particular time
climate
statistical description of weather over a period of time
They provide a lot of nitrogen and iron
Explain the role whales play in the facilitating the ocean's biological pump
Correlation; Seuss Effect; Declining CO2; Energy budgets
How do we know that climate change is driven by anthropogenic sources?
CO2 is rising; NH has more people and land mass; season variability; Mauna Lona 20% CO2 increase
What are some patterns in the Keeling Curve and Pump handle video?
plants have a higher ratio
How do animals and plants differ (or not) in their C:N ratios
forest sees the signal of salmon - the bears are the conduit for this, foraging activities helping to fertilize the forest.
What is the significance of the following graph from Helfield and Naiman 2001?
if you eat more nitrogen, you will contain more nitrogen in your body
Can you explain the significance of the following graph, which shows the relationship between bear diet delta 15N and bear plasma delta 15N?

Decrease
By burning fossil fuels (plants), what should happen to the atmospheric 13C composition over time?
temperature and precipitation
What are two determinants of NPP on land?