Experimental Design Exam 1
1/86
There's no tags or description
Looks like no tags are added yet.
Name | Mastery | Learn | Test | Matching | Spaced | Call with Kai |
|---|
No analytics yet
Send a link to your students to track their progress
87 Terms
Statistics
are two samples drawn from the same population?
gives info to help explain variation.
Biological differences
how large is the difference and is it important to biological function
Laplace and Gauss (1700s)
Created Normal Distribution and Central limit theorem
Normal Distribution
continuous probability distribution (bell curve)
Mean and median will be the same number
Central limit theorem
in independent and identically distributed samples, the mean tends towards the normal distribution even if original variables are not normally distributed created by Laplace.
Galton and Pearson
Created correlation testing and chi-squared test. the second guy was the first to do formal statistical testing in the 1800s
Correlation
linear correlation between two sets of data, covariance of two variables and the product of their standard deviations (-1 to 1 perfect)
Chi-squared test
applied sets of categorical data to evaluate how likely that any observed difference between sets arose by chance (p value test)
Gosset and Fisher
T-test, ANOVA, Experimental design
T test started with the one who worked at a Guinness factory and published his work under the pseudonym “student”
was known as the “King of Genetics” he published 100s of articles on genetics.
Experimental Units (EU)
Able to retrieve treatments i.e (A tank of water that has mercury added: the mercury is the treatment)
Some type of container (Box, tank, classroom, etc)
Differences in the unit isn’t caused by the treatment.
Measurement Unit (MU)
What is being measured. Units inside the container (Fish in a tank)
Problem with confusing MU for EU
Over optimistic analysis, rejection of H0 , C.I. will be too short
Treatment Effect
What is being changed in an experiment
Degrees of freedom
maximum number of logically independent variables which may vary in a sample
Randomization
A guard against situational errors
requires identification of all the objects that might be selected
Used in selection in the field and setting up the experiment
Can be used when their is a limited sample
produces correct independent error terms
reduces bias in selection
Skew
direction a normal distribution (bell curve) graph leans
Left skew
√b1 < 0
No skew
√b1 = 0
Right skew
√b1 > 0
Kurtosis
The peakedness of the normal distribution graph (bell curve)
Broad v Narrow
Platykurtic - broad
b2 < 3
mesokurtic
b2 = 3
leptokurtic
b2 > 3
Random Selection with Replacement
The Best form of Randomization
tag entire population of interest, so every individual has a unique identifying number
random selection of individuals (cards, dice, random number table)
measure the selected individual
replace the individual back in the population before makin the next selection
the probability of selection remains constant
Fisher has said
“Random assignment of treatments is required”
In a t-test; as N increases
t decreases, and SE (standard error) decreases
Replication
Most important part of experimental design
Most messed up
Experimental Design
Randomization + Replication
Plan Experiment ← Chose stats analysis then
Carry out experiment - data collection (where experimenters typically go wrong)
Run stats on data
Factor
Treatment - Independent variable - x-axis
Variable
Measured - dependent variable - y-axis
Variation
is everywhere in the real world.
Includes Measurement error (ME), Natural inherent variation, variation in individuals, variation in mean values
Means by themselves explains nothing.
Natural Inherent variation
Genetics, biological processes, environmental history
Reduced through Narrow selection, acclimate individuals (set individuals in a lab for a couple of weeks)
How to deal with what’s left: increase sample size, use blocking in analysis
Variation in individuals
Sample standard deviation
Variation in mean values
Sample of means standard deviation, standard error of the mean (SEM)
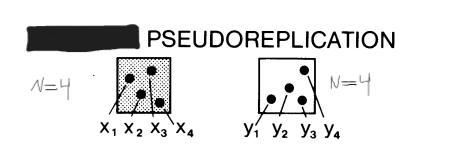
Simple Pseudoreplication
There are single replicates of EU per treatment with nested MU
Shouldn’t run stats - Observation tests only (due to lack of significant difference)
Happens with large scale experiments
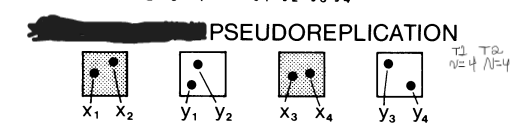
Sacrificial Pseudoreplication
true replication of treatments but data for replicates are pooled for statistical analysis (sacrifices independence by using individuals as EU not MU) confuses MU for EU which gives a larger n value leading to a wrong df → wrong df error term → wrong MS Error term → wrong F term → incorrect P value which would create an incorrect interpretation and assumptions.
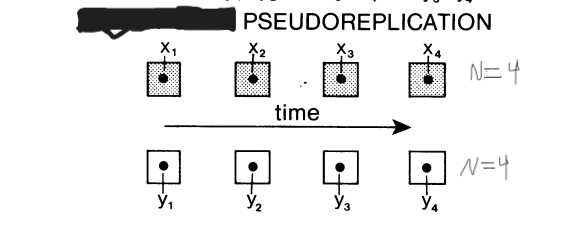
Temporal Pseudoreplication
multiple samples from each EU (one per treatment) are not taken simultaneously but instead over several dates
Treats each measurement as a separate EU.
Don’t treat successive dates as independent replicates of a treatment
no longer independent - same sample multiple times
need multiple EU over time
Implicit Pseudoreplication
When Standard Error and Confidence Interval is reported along with their means and discuss the effects of the treatments, but there is no application of any direct tests of significance. It is psuedoreplication when the experimenter does not give a specific disclaimer acknowledging that their data is inadequate for assessing treatment effects.
If only standard deviation is presented than it isn’t psuedoreplication.
SE of a sample
is an estimate of the variation of means
Difference between Treatment
EU - variation regardless of treatments
MU - variation among MU regardless of treatment
TE - variation caused by treatment effect
Difference within treatment
EU - variation among EU
MU - variation among MU
Independent Error Terms
Is all based on design
HOV (draw table)
Variances of treatments are similar for test of means to be accurate
MS (mean square) - variance within treatments
one number to tell if treatments are different
Uses pooled variance in calculation
is an assumption because all variances have to all be the same for it to be accurate if one number is off the resulting calculations could all be off i.e. if the F-value is off the P-value is off.
ANOVA table
Top row - between treatments
Bottom row - within treatments (error)
Represents the variation of means among treatments.
Change in the variance is an indication in the change the biologist made
Change in the mean might not happen
Variance carries biological information from the outcome.
P values
Value less than alpha reject H0 if larger don’t reject H0
Represents the probability of getting a more extreme result than what the data set says.
Area under the curve outside of the data set.
Used when you design an experiment on purpose the value can be used for interpretation.
Change when there is a change in sample size
Type 1 error
alpha: reject H0 is wrong (usually happens if p value is very large
to lower increase n
Type 2 error
Beta - fail to reject H0 is wrong
Random Selection without Replacement
tag entire population of interest, so every individual has a unique identifying number
random selection of individuals (cards, dice, random number table)
measure the selected individual
do not replace the individual back in the population before making the next selection
the probability of selection changes, but in a predictable way
Haphazard Selection
do not tag entire population, or any of the population of interest
no random selection, pick up whatever you find, or buy things from supply houses
measure individual
replacement is irrelevant, but usually does not happen
there is no probability of selection
J
bias correction factor
used to adjust for sample size
One-Sample t-Test
Tests a single factor at only one treatment level/sample against a null test mean μ: mean of Column A1 = null test mean μ
Ex: A factory is measuring if the average box of cereal contains 24oz cereal compared to the hypothesized value of 24 oz.
√s2/ n
level of variation
Effect size
The replacement for p for non-strict science journals
Larger number more effect there is
opposite direction of p-value
< 0.2 : small, around 0.5 in the middle, > 0.8 : large, and >2.0 : very large
Does not change with sample size
S2
Variation within
Further variance gets less accurate
One-factor Completely Randomized ANOVA
One Factor with multiple treatment levels
How you randomize defines the design
How you design defines how you analyze
Step 1: Randomly assign treatments to EU matching one list of treatment numbers with one list of EU numbers in random order → design
Step 2: Randomly assign MUs to EUs matching one list of MU numbers with one list of EU numbers in random order → helps remove bias
H0: mean of each column is the same as the other.
Normality and HOV are dependent of the data and can be tested for and adjusted after completion of the experiment
One-factor Completely Randomized ANOVA Assumptions
Assumptions: The data points within each column (treatment group) are from randomly drawn individuals, and are normally distributed
The data points are independent of one another within and between columns (treatment groups) (the within relates to independent replication of EU within each treatment; the between relates to the completely randomized design across all treatments).
The variances of the columns (treatment groups) are similar
One-Sample t-test Assumption
Assumptions: The data points are from randomly drawn individuals, normally distributed, and independent of one another
SS
sum of squares of a column
start of calculations for variation
ω2 (omega)
the effect size given is a biased-corrected estimate of effect size compared to η2
η2 (eta)
effect size estimate for effect or factor of interest
gives the percent amount of how much a Factor is a part of the variation in SS in the ANOVA
The more of the variation in the ANOVA table that a factor explains the more important
Two-Sample (Independent) t-Test
Used when there is only two treatment groups for one factor
The design and set up is identical to the One-Factor Completely Randomized ANOVA.
Effect size is calculated differently.
H0: mean of Column A1 = mean of Column A2
Welch t-test
Used when there are only two treatment groups for one factor.
t-value uses separate variance instead of the pooled variance.
H0: mean of Column A1 = mean of Column A2
Welch t-test assumption
Same as One-Factor Completely Randomized ANOVA except homogeneity of variance is not required.
Two-Sample (Independent) t-Test
Same as One-Factor Completely Randomized ANOVA
Cohen’s d*s
effect size estimate based on the average variance
Hedges g*
Cohen’s d*s bias correction factor
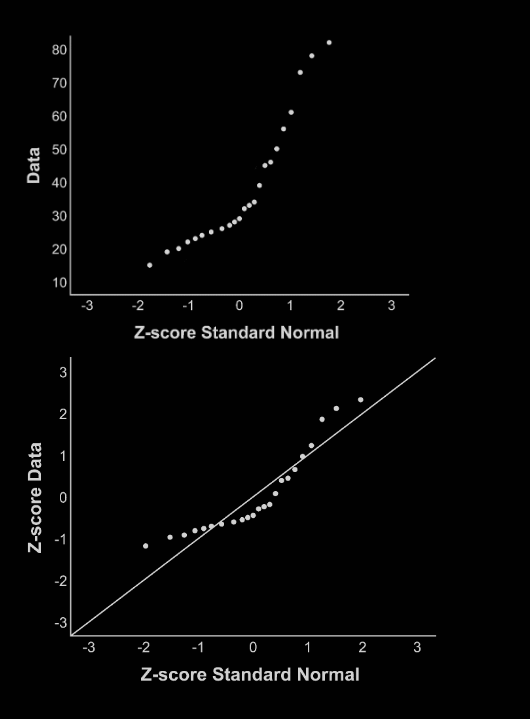
Normal probability plots
If all dots line up in a straight line you have normal data
Population
The total number individuals or items in which a sample is drawn from.
Sample
A subset of the population of which you can gain mean values and other data from.
C.I.
As n increases the range becomes more narrow
The percentage is determined by the chances of being wrong and the consequences
EX: 95% means 95 will hit out of 100
Is determined from the standard error and the t-value
Standard Error
Generated from the SD
Is how variable mean values can be if you sample multiple times
df group
related to the number of columns (treatment groups) in an experiment.
k-1
Used to find MS group
Continuous
There is no gap in measurement
Ex: lengths and widths
Discrete
There are gaps
Whole numbers no decimals
Ex: spines on an insect
Accuracy
How close to the truth (mean)
Precision
How close multiple measurements are to each other (variance)
Resolution
How small of a difference can be recorded (decilmals)
Measurement Error
Reduced by practice, instrument calibration, stable environment
Variation due to limitation of people, instruments, conditions; i.e. what are the conditions of the time you are taking measurements
How to deal with what’s left: Ignore it, take multiple measurements → average, multiple measures - nesting analysis
Standard Deviation
Represents the variation in the sample (measure of how variable numbers are in a sample)
Sample of means
When multiple samples are drawn from the same population and means are given for each sample.
The mean of these values is the most accurate representation of the population.
df error
relates to the the number of independently replicated EUs
N-k
Helps give MS error
MS error
SS error/ df error
MS group
SS group / df group
df total
N -1
Total number of EUs
F-statistic
MS column/ MS error
TE+ EU + MU/ EU + MU
Everything cancels out to just leave TE
If others don’t cancel, wrong analysis of treatment effect and generates wrong F term (typically caused by improper replication)
Follows an approximately normal distribution.
MS (mean square)
is the variation within and between treatments.
Serves as common variance term in an ANOVA test.