Psychoanalysis Midterm
1/81
There's no tags or description
Looks like no tags are added yet.
Name | Mastery | Learn | Test | Matching | Spaced |
|---|
No study sessions yet.
82 Terms
psychological tests
measure latent variables and hypothetical constructs
Hypothetical Construct
explanatory variable that we hypothesize is responsible for the behaviors we observe but cannot be directly observed
examiner
person who administers a test
examinee
person who takes a test
item
questions or content being measured on a test
scale
method to measure psychological variables
measure
tools and techniques used to gather data about psychological constructs
battery
collection of tests and assessments
individual test
a test that is administered to only one person at a time
group test
a test that is administered to multiple people at the same time
reliability
the consistency of test results across different administrations and contexts.
validity
the extent to which a test measures what it intends to measure.
experimental psychology
Sensation, perception (Locke Herbart, Weber, Fechner), Higher Mental Functions (Wundt and Ebbinghause), Operational Definitions (Watson and Stevens)
Individual Differences
Evolution/Intelligence (Darwin, Galton), Cognitive ability (Binet), Cognitive Ability (Terman and others)
Primary Qualities
Absolute, objective, immutable, and capable of mathematical description
Secondary qualities
experiences they elicit from the individual
Kallikak Study
Traced family lineage of a man to find the effects of genetics on intelligence. Heavily contributed to the eugenics movement.
Buck V Bell
Allowed the constitutionality of Virginia’s law allowing state enforced sterilizations
Popularity of testing and WW1
To assess the mental capacity of recruits and identify those with mental health issues
What lead to a decrease popularity of testing?
Nazi Germany, Civil Rights Movement
Historical view of testing
Tests are perfect, tests are essential tools, All psychological qualities can be measured, a test score represents all there is to know about a human being
Modern View
Tests are imperfect, tests are tools to be used in conjunction with other tools, measuring psychological qualities is possible but challenging, a test score is one piece of information about a human being
What is Scaling?
Determining the rules of correspondence between the elements in the real world (physical or psychological) and the elements of the real number system
What is Transforming a score?
Changing the scale of a score
Nominal
Data categorized into groups without ranking
Ordinal
ranking and order of data
interval
a type of quantitative measurement where the order of values is meaningful and the difference between any two values on the scale is consistent and equal
Ratio
a type of quantitative measurement where the order of values is meaningful and the difference between any two values on the scale is consistent and equal
Continuous Data
measurements that can take any value within a specific range, meaning there are infinitely many possible values.
Categorical Data
variables represent types of data which may be divided into groups.
Dichotomous Data
Data with 2 items/questions
Norm-referenced Tests
Scores based on performance relative to others
Criterion-referenced Tests
Scores based on number of objectives or knowledge achieved
Factor analysis
works with observed variables to discover latent variables
Reliability
Degree to which the observed score approximates the true score
Classical test theory
mean of distribution of observed scores is the true score, measurement error is an unsystematic or random, deviated of an examinee’s score from a theoretically expected true score
Generalizability Theory
Recognize that there are multiple sources of variance that account for the differences between true scores and observed scores. The use of ANOVA allows us to tease out the relative contribution of multiple sources of variance.
Item Response Theory
Through complex item analysis we can determine the relationship between an examinee’s characteristic and the probability of a correct response to an item
Test-Retest Reliability
Administer the test (Time 1) Score the test After the interval, administer the same test to the same students (time 2) Score the test Correlate the two sets of scores
Alternate forms reliability
Administer Form 1 of the Test Administer Form 2 of the Test Score both Forms 1 and 2 Correlate the two sets of scores
Formula for standard error of measurement

Item Variance
variance due to random measurement error
Construct Variance
Variance due to differences in the construct being measured
Total Variance
Variance due to random measurement error and differences in the construct being measured
Reliability estimate
construct variance/Total Variance
Split halves method
Determine how the test is to be divided (e.g. even items vs. odd items Add up all the total score for the odd items for
each examinee and then the total score of the
even items for each examinee. Correlate the “odd-item score” with the “even-
item score” Apply Spearman-Brown formula to correct the
split-half reliability estimate thus obtaining the
reliability estimate of the whole test
Spearman-Brown
2r/(1+R)
KR20
Find the proportion of examinees responding
correctly to the item for each item (This is “p”)
• Calculate 1-p to get “q” or calculate the proportion
of examinees responding incorrectly to each item.
• Multiply the two for each item (pq)
• Sum up those products
• Find the variance of the examinee test scores
• Plug numbers into the KR20 formula
Cronbach’s Alpha
statistical measure used to assess the internal consistency reliability of a set of items or questions that are designed to measure the same concept. In simpler terms, it tells us how well the different items within a scale or survey measure the same underlying construct
Cohens Kappa
statistical measure used to evaluate the level of agreement between two or more raters who classify items into categories
Interrater reliability
measures the consistency of ratings or judgments made by different raters or observers when evaluating the same phenomenon
How to increase reliability
Consistency in Scoring
• Group variability
• Managing difficulty levels
• Number of items
• Quality of items
• Factor analysis (unidimensionality)
• Correction for Attenuation
Validity
The test actually measures what it says it does
Content Validity
Construction/Review of Items, Represents the target domain adequately
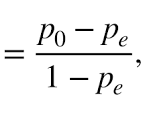
Criterion-related Validity
Correlation between predictor and criterion. Performance on the criterion
Construct Validity
Multiple methods, Degree of construct possessed by examinee
Face Validity
The test looks professional and valid
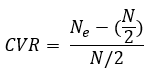
Lawshe’s Content Validity Ratio (CVR)
Where ne equals the number of SME's rating an item as essential and N equals the total number of SME’s providing ratings.
Content Validation Steps
1. Describe and specify the domain of behaviors (knowledge) being measured.
2. Analyze the domain and subcategorize into more specific topics.
3. Draw up a set of test specification that show not only the content areas but
the emphasis placed on each area.
4. Determine how many items should be included to represent coverage of the
area
5. Create or match items to content areas
Content Validity Ratio Steps
1. Identify a group of subject matter experts (SME) to review the items
on the GAD. (Example: 40 clinicians who specialize in treating
depression).
2. Have your SME’s rate each item as essential, useful, or not important
to the content or construct.
3. Calculate the CVR
4. Review the ratings for each item.
Criterion-Related Validation Steps
1. Identify suitable criterion behavior and a way to measure it.
2. Identify an appropriate sample of examinees representative of those
for whom the test will be used.
3. Administer the test to sample and record scores.
4. When appropriate, obtain a measure of performance on the
criterion for the sample.
5. Determine the strength of the relationship between test scores and
criterion performance. (Use Pearson’s R to generate a validity
coefficient)
Predictive Validity
how well a test or measurement predicts future outcomes or behaviors
Concurrent Validity
how well a new test or assessment compares to an established, validated measure when both are taken at the same time
Steps of Construct Validation
Formulate a hypothesis about how those who differ on the
construct should differ in other respects (behavior, scores on other
tests, etc.)
2. Select or develop a measurement instrument which consists of
items representing manifestations of this construct.
3. Gather empirical evidence that will test this.
4. Determine if the data are consistent with the hypothesis. Consider
alternative explanations.
Types of Evidence of Construct Validity
Developmental Changes
Intervention Changes
Group Differentiation
Convergent Evidence
Discriminant Evidence
Factor Analysis
What Reduces Validity?
Characteristics of the test itself
Errors in test administration and scoring
Variables affecting examinee responses
Factor Analysis Steps
Start with your correlation matrix
◦ Is it appropriate to compute correlations?
◦ Are relationships linear? Are item responses continuous? Are correlations
sizeable?
Extract factors
◦ Among other things, the extraction method gives rise to factor
eigenvalues, used in the next step
Decide how many factors to retain
Rotate factor pattern matrix to obtain an interpretable
solution
Interpret rotated factor pattern & structure matrix
Criteria for a good Criterion
Relevant, Valid, Uncontaminated
Steps to make a test
Defining a Test, Constructing the items, assemble the test, test the test, revise the test, publish the test
Objective tests
dichotomous. polytomous, matching
Subjective tests
short answers, fill in the blank, essay
BRUSO
Brief, Relevant, Unambiguous, Specific, Objective
Likert Format
typically presents respondents with a statement or question and a range of response options, often numbered from 1 to 5 or 1 to 7, to indicate their level of agreement or disagreement.
Category Format
a rating-scale format that usually uses the categories 1 to 10
Calculating Item Difficulty
Count the number of examinees who got the item right then divide by the total number of examinees
Rapport and test scores
establishing a good rapport can improve accuracy, elicit more information, and ease anxiety, potentially leading to better scores
Impact of race of tester on test performance
Studies suggest that Black individuals may perform worse when tested by a White examiner
Stereotype Threat and its remedies
Stereotype threat, the risk of confirming negative stereotypes about one's group, can be reduced through various individual and systemic strategies. Individuals can mitigate the impact by practicing self-affirmation, mindfulness, and cognitive reframing, while educators can promote inclusive classrooms by celebrating diversity, providing positive role models, and promoting a growth mindset
Training of Test Administrators
Properly trained test administrators can significantly impact test scores by ensuring fair and consistent test administration, which in turn enhances the validity and reliability of the results
Expectancy Effects (Rosenthal Effects)
describe how an observer's expectations about a person's performance can influence the person's behavior and actual outcome
Effects of reinforcing responses
strengthens the likelihood of a specific behavior being repeated
Test anxiety
a type of performance anxiety characterized by intense worry and distress before or during exams