Market research
1/121
There's no tags or description
Looks like no tags are added yet.
Name | Mastery | Learn | Test | Matching | Spaced |
|---|
No study sessions yet.
122 Terms
What is market research?
Process of systematically collecting, analyzing and interpreting information about people / companies, market, product, or service
Why is market research important?
To understand customers, target market, industry, competitors
To make better decisions on strategy, operations, customer, products and services
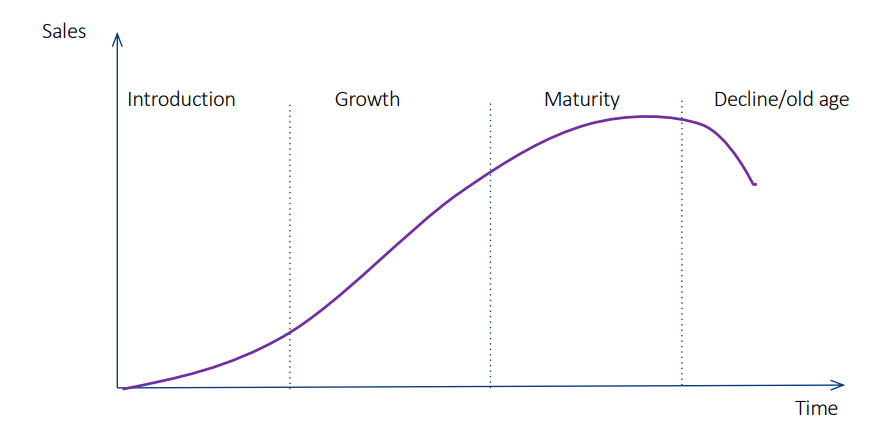
Product life cycle
INTRODUCTION • market potential assessment • needs analysis • price evaluation • competition analysis
GROWTH • distribution analysis • promotion research • customer satisfaction assessment • analysis of use and attitudes
MATURITY • brand positioning • market segmentation • market potential assessment • market monitoring
OLD AGE • Rejuvenate product • New markets • New features • Repositioning
Common types of market research
Market segmentation
Brand position
Customer satisfaction and loyalty
Optimum pricing
New market
New product
Advertising effectiveness
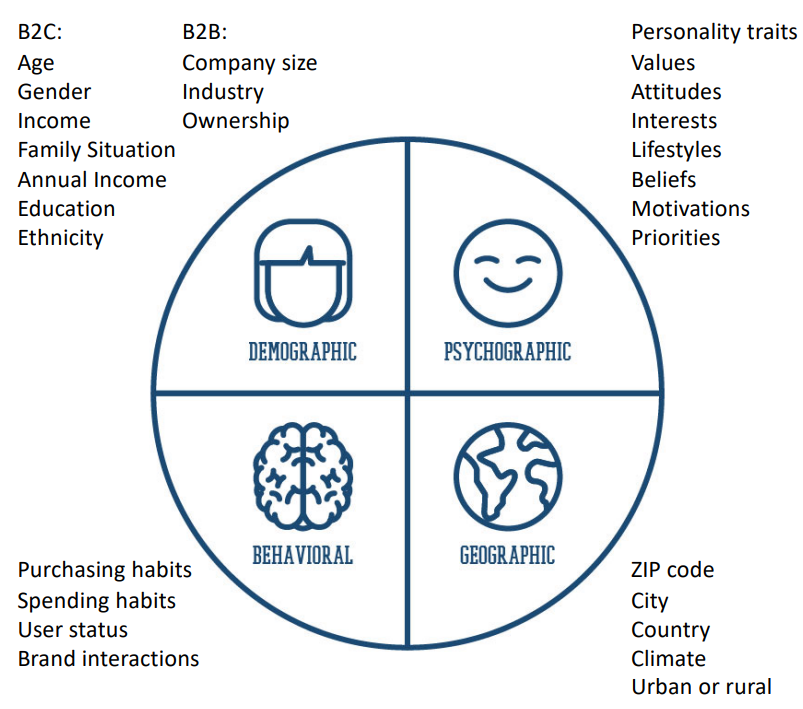
Market segmentation
helps to efficiently target marketing resources and messaging at specific groups of consumers
Segmentation bases: 4 primary categories
Demographic, psychographic, behavioral, geographic
Quant method
Rely on large samples
Representative sample important
Typically: conduct qual or exploratory research before designing main questionnaire
Multivariate techniques (cluster and factor analysis)
Purchasing data analytics
other kinds of web-based data, incl. social media
Survey questionnaire
• Contains as many descriptive/profiling questions as possible
• Question types well suited for cluster and factor analysis
Market segmentation tips
Clear objective – “how will the client be able to use this information?”. Make sure segments are easy to understand
• Good segments are distinct, recognizable, durable, sizeable, actionable, optimally sized and numbered.
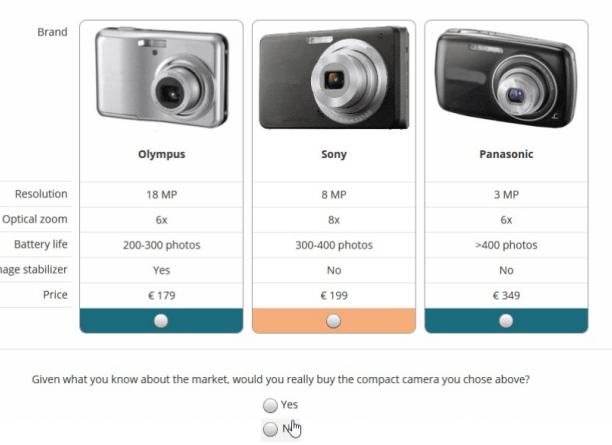
Monadic testing
each respondent offered one design and asked for feedback (for brand positioning)
Brand health monitoring
Awareness • Unaided: top-of-mind awareness, unprompted, spontaneous • Aided: prompted, provide the respondent a list of choices • Brand recall: ability to remember the brand
Familiarity (of those aware)
Consideration (of those familiar)
Use/purchase • As main brand • As another, secondary brand used
Advocacy / loyalty • Net promoter score (NPS): ”On a scale of 0-10, how likely are you to recommend [brand] to your family and friends?”
![<p><strong>Awareness</strong> • Unaided: top-of-mind awareness, unprompted, spontaneous • Aided: prompted, provide the respondent a list of choices • Brand recall: ability to remember the brand </p><p><strong>Familiarity</strong> (of those aware)</p><p><strong>Consideration</strong> (of those familiar) </p><p><strong>Use/purchase</strong> • As main brand • As another, secondary brand used </p><p><strong>Advocacy / loyalty</strong> • Net promoter score (NPS): ”On a scale of 0-10, how likely are you to recommend [brand] to your family and friends?”</p>](https://knowt-user-attachments.s3.amazonaws.com/80b06df2-bd36-46a7-945e-795d79c2e271.jpeg)
Methods to study satisfaction and loyalty
• Sales volumes
• Customer complaints
• Anecdotal feedback
• Reviews
• Social media and blogs
• Quant survey
• Robust samples
• Target audience (all customers incl. unsatisfied, lost, potential)
Net Promoter Score (NPS)
“How likely is it that you would recommend [Organization X/Product Y/Service Z] to a friend or colleague?
Customer Satisfaction (CSAT)
“How would you rate your overall satisfaction with the [goods/service] you received?”; only responses of 4 (satisfied) and 5 (very satisfied) are included in the calculation of CSAT
![<p>“How would you rate your overall satisfaction with the [goods/service] you received?”; only responses of 4 (satisfied) and 5 (very satisfied) are included in the calculation of CSAT</p>](https://knowt-user-attachments.s3.amazonaws.com/9525924b-f221-41d3-b549-dbc0784caff2.jpeg)
Why study demand side optimum price?
Understand the market’s willingness to purchase
Capture the highest return on the investment
Understand the psychologically optimal price
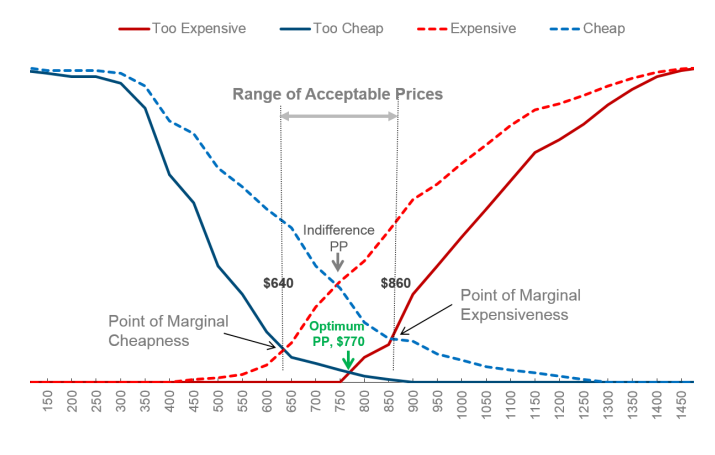
Van Westendorp’s Price Sensitivity Meter
Direct pricing research that constructs a range of acceptable prices for a given product.
Done by asking 4 questions about price
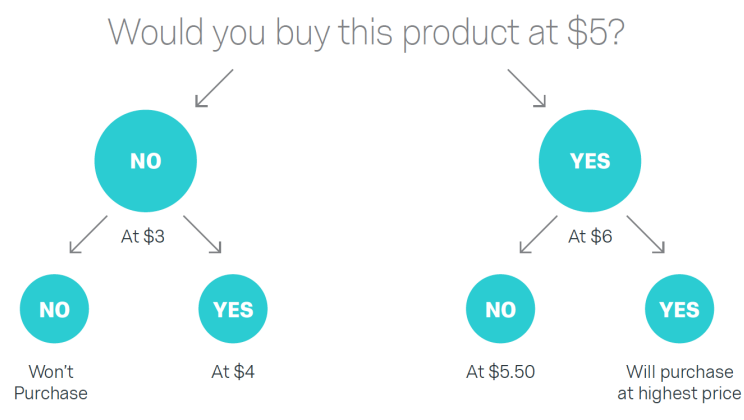
Gabor-Granger Direct Pricing Technique
Type of direct pricing that asks respondents if they would purchase a product or service at a specific price.
Conjoint Analysis
Measuring the value that consumers place on features of a product or service
Gives respondents a choice of two to five product configurations and asks them to choose one of the configurations
New market
Establish opportunities in new market and provide insights for successful entering
Information to be obtained:
• Size and nature of the opportunity
• total available market-segment/target market size
• Market threats, growth and trends
• Competitive landscape
• Structure of supply chain
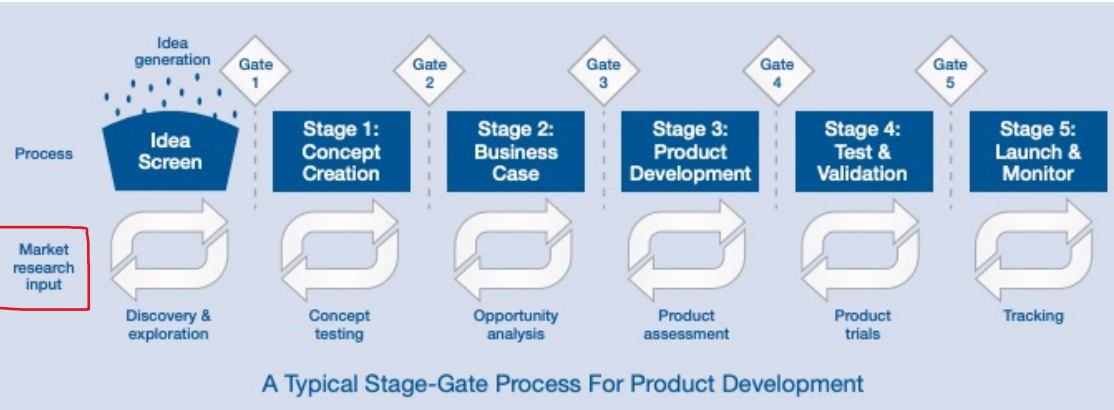
Stage-gate process idea-to-launch
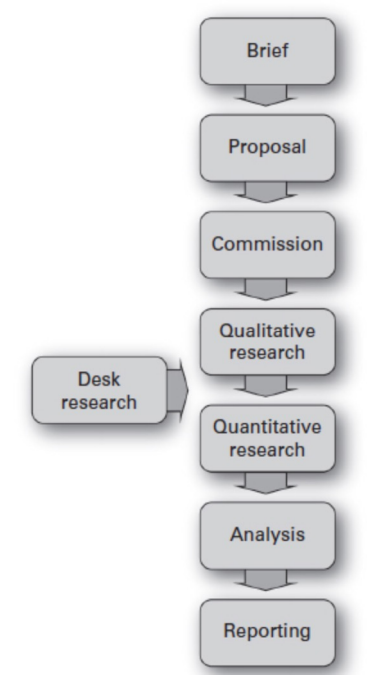
Market research process
GDPR: General Data Protection Regulation
Personal data / personally identifiable information: information that relates to a person and allows him/her to be identified.
Case of email addresses
What is qualitative research?
• Group of scientific methods
• Gather non- numerical (== qualitative) data
• Differs by discipline, purpose
• Often used to exploratory research
Qualitative research to explore:
• The what, why and how
• Experience, meaning and perspective
• Beyond numbers
• How and why of behavior and thinking • Groups and individuals

Models: qualitative methods (6)
Phenomenological
Ethnographic
Grounded Theory
Case Study
Historical
Narrative
Phenomenological (qualitative method)
how any one participant experiences a specific event

Ethnographic (qualitative method)
immersion in culture/ group (testing products personally or in beta groups before release)

Grounded Theory (qualitative method)
why a course of action evolved the way it did (satisfaction surveys)
Case Study (qualitative method)
in-depth look at test subject (marketing to new clients)
Historical (qualitative method)
describes past events in order to understand present patterns and anticipate future choice (previous ad campaigns to find most effective campaign)
Narrative (qualitative method)
compiles information over extended periods of time ( define buyer personas to identify innovations that appeal to target market)

Card sorting
AIM: Gain insights into how potential consumers perceive, categorize, and prioritize
What: asking users to organise information into logical groups
Why: trends, categories How users understand it
Example: sorting coursemates, who are holding signs with animal names
Priming
Exposure to stimulus influences response
Often without participant noticing
Can be by design
Perceptual, semantic, conceptual
Positive and negative

Objectivity in research
There is no such thing as a neutral question
Question influences answer
Interviewer influences answer
People think !== people do
Answer is then interpreted
IMPARTIALITY IS THE AIM

Semantic (related to priming)
relating to meaning in language or logic
Cat → Tiger
Associative (related to priming)
Cat → Dog
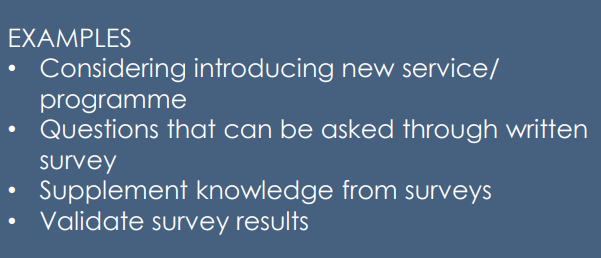
When to use interviews?
Learn about group/ community
Validate results
Explore topics
Semi-structured interviews
Interview == script + toolkit
Your script = introduction + questions
Steps of interview
Steps 0 and 1: thinking and research (know what you want, see what was done before)
Step 2: preparation
Step 3: Recruit participants (Sampling, Information, Ethics)
Step 2: preparation of interview
Know what you want : your script
Have a plan: • Who will you interview? • Why interview? • How much time you spend on an interview? • Where will interviews take place?
Sampling
Quantitative: the aim is to generalize
Qualitative: provide in-depth understanding, target: group, type of individual, event, process
Quota sampling
Participant quotas before sampling
Meet certain characteristics (age, sex, class, marital status, health condition)
non-probability sampling technique
sample has the same proportions of individuals and the population ( traits, researched phenomenon)
USE TO: • observe relationships between subgroups • sample a subgroup that is of interest to the research
Quota sampling step-by-step
1. Divide population into exclusive groups
2. Identify proportion of subgroups in population (then apply in sampling process)
3. Select subjects from subgroups taking proportions above into consideration
4. Ensure sample is representative
Snowball sampling
• Referrals
• Recruit participants that are otherwise hard to reach
• Rare or limited
• Small subgroup of population

Purposeful sampling
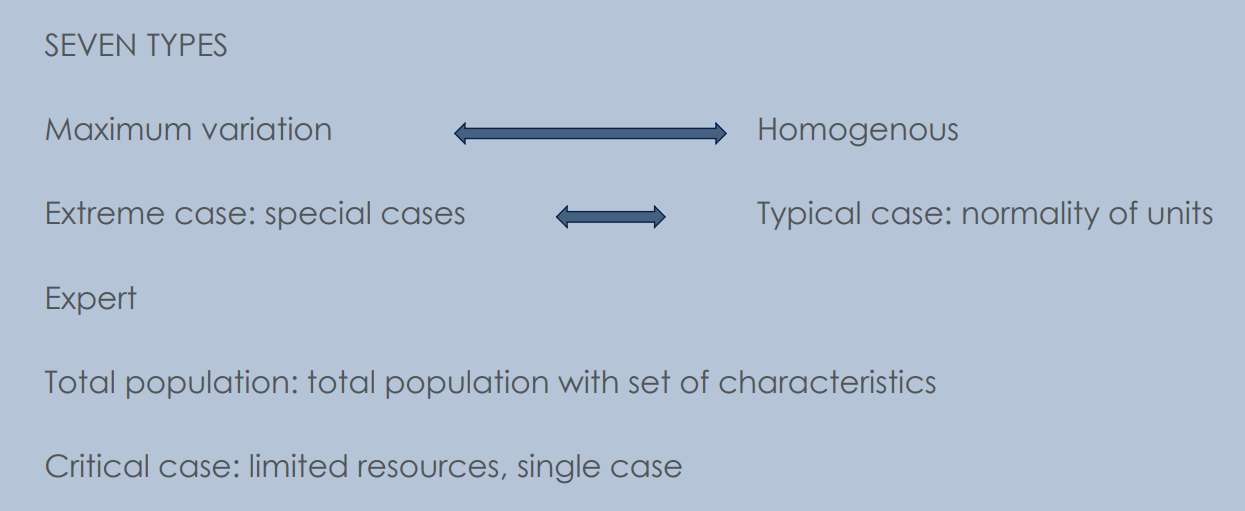
Expert sampling
Particular expertise
Exploratory phase of research: highlight new areas what you did not think of
Used when lack of empirical evidence, uncertainty
Research findings will take a long time
Maximum variation
Heterogeneous
Capture wide range of perspectives related to your topic
Looking for : variation in opinions/ views/ perspectives/ understandings
Capture typical and extreme
Capture conditions == people, cases, companies, events
Looking at: experiences, qualities, situations, behaviors, incidents
Introducing your research
- Introduce yourself
- About research/ project
- How the interview will go (structure, questions, length)
- What your expectations are
- Why this is important
- How you will treat their data
Tips for interview questions
Open ended: you want as long an answer as possible
Don’t ask them to analyze, that is your job
Focus on their views, not views of other people they may know
Be aware of boundaries: personal – professional
Don’t ask to predict the future
Don’t use abbreviations/ jargon
Do be prepared to challenge what was said
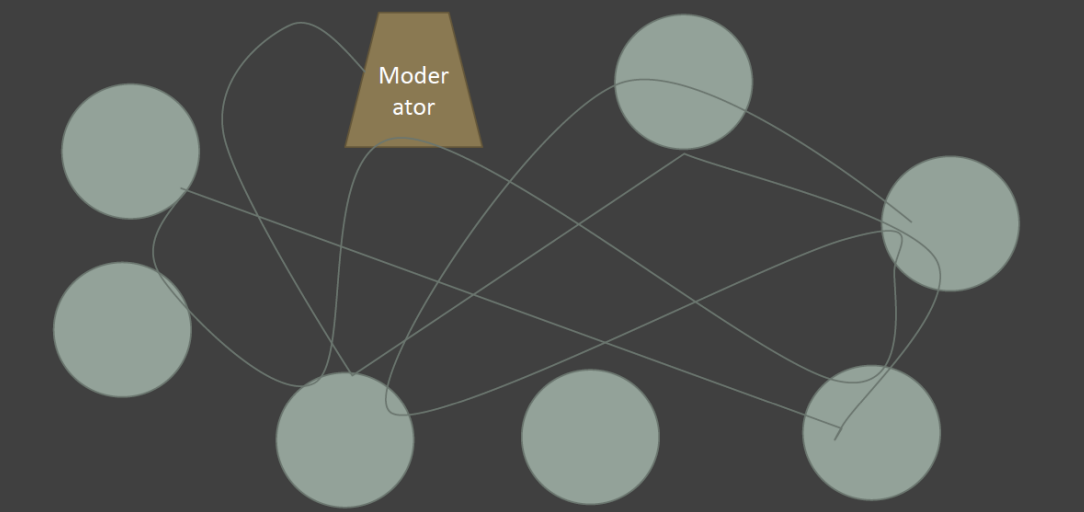
Focus groups
Group; focused on one topic
Facilitator/ moderator (moderating methods: Standard, Dual, Fencing, Respondent)
Discussions are planned
Allows different perspective
Be aware of group dynamics
Interaction between participants; participant - interviewer
Size of focus group: 6-12
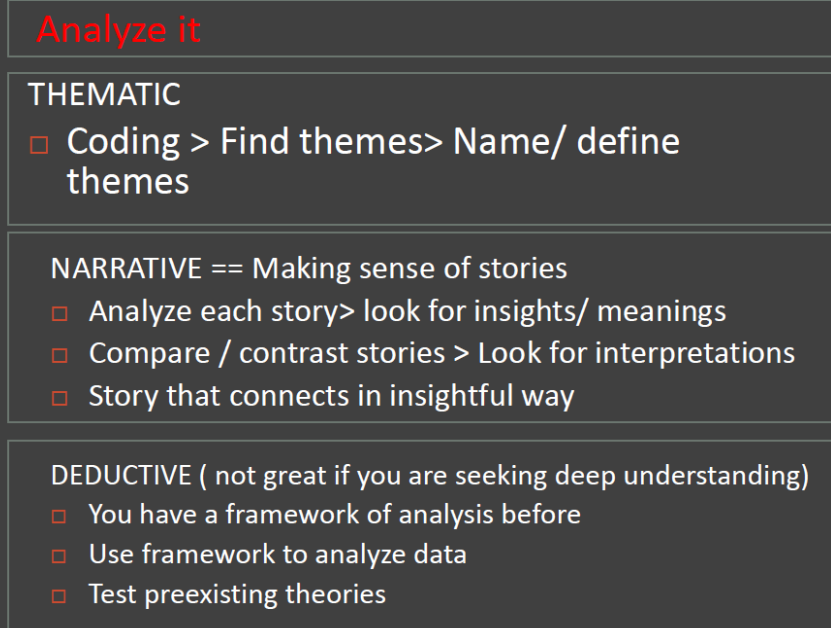
What to do with data?
The key elements of experiments
Goals
Systematic learning
Measurability
Scalability
Limited time-frame
Goals (The key elements of experiments)
clear goal with regard to:
i) the concrete learning outcome of the specific experiment and
ii) the broader societal challenges that the experiment is intended to contribute to solving
Systematic learning (The key elements of experiments)
Clear plan on:
i) how knowledge is gathered during the experiment
ii) where, to whom this knowledge is communicated.
Learning is also dependent on pre-determined evaluation criteria that enables one to draw conclusions on the basis of the experiment. If the experiment does not go as planned, the hypothesis is proven to be wrong, the experiment has not failed, since it has enabled learning.
Measurability (The key elements of experiments)
To enable systematic learning, experiments should be assessed on the basis of clear and specific evaluation criteria, remaining open to failure.
Scalability (The key elements of experiments)
While experiments should be implemented on a selected sample before scaling, there should be a clear and realistic plan on how an experiment, if proven successful, will be scaled - how the policy that has been tested in the experiment will be scaled in practice
Limited time-frame (The key elements of experiments)
An experiment should be limited to a specific period of time and have a predetermined end date.
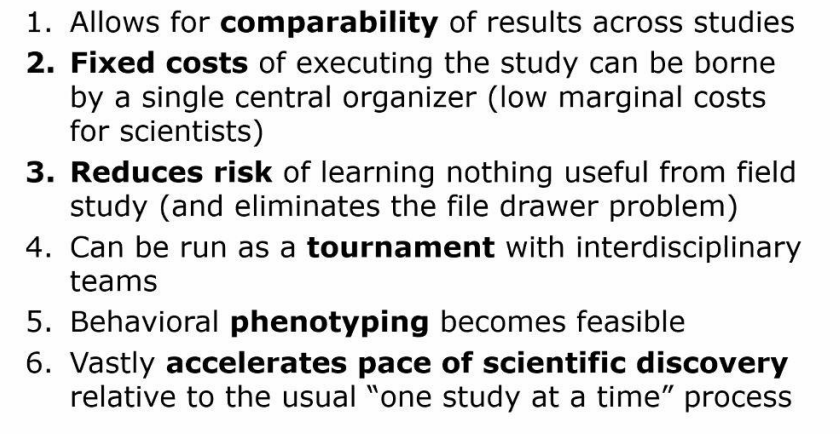
Mega study
a massive field experiment in which many different treatments are tested synchronously in one large sample using a common, objectively measured outcome
Benefits of megastudy approach
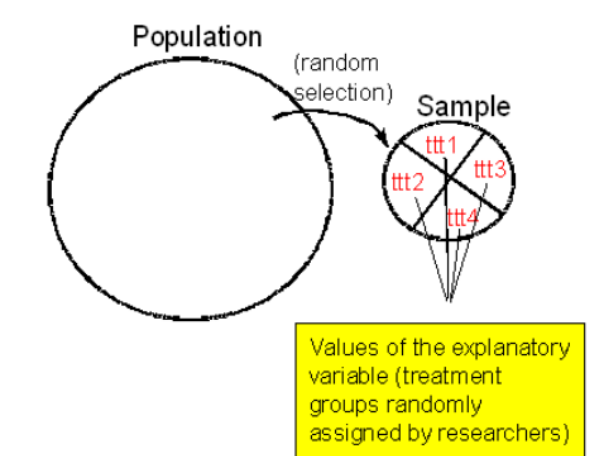
RANDOMIZATION
As a method of experimental control has been extensively used in human clinical trials and other biological experiments.
It prevents the selection bias and insures against the accidental bias.
It produces the comparable groups and eliminates the source of bias in treatment assignments.
Finally, it permits the use of probability theory to express the likelihood of chance as a source for the difference of end outcome
Randomized controlled trial
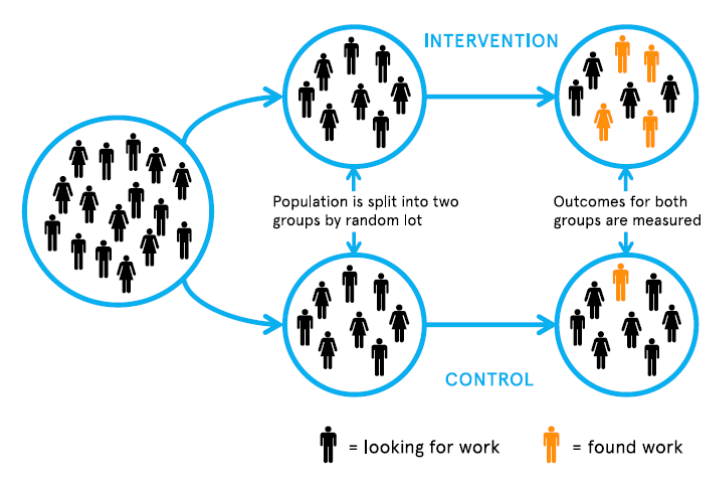
Technicalities to keep in mind when running experiments
Is random random? No selection bias? No differences in sociodemographic background?
Sample size, the bigger the better (identifying small vs large effects!)
What caused the effect? Have you controlled for other variables? Use regressions instead of comparing mean values.
If RCT not possible, compare the “before” (control/benchmark) and “after” (test) but make sure other factors are not influencing the results (seasons, holidays, trends, inflation etc.)
Incrementality (marketing)
Refers to additional sales caused by media exposure
A/B (or multi-variate) testing
great for isolating incremental sales / brand lift for individual digital campaigns
hard to aggregate or to use for non-digital channels
Econometric / regression / marketing mix modelling
great for aggregating incremental sales across all channels
can only be used with sufficient scale, not fast/granular enough for in-flight optimizations and relies on longer historic periods
Regular / direct / last click based attribution results
instantly available at no cost, most granular / frequent
can be highly inaccurate, so should be taken with a pinch of salt
Frequency =
Impressions / Reach
(expressed as total or weekly frequency for longer campaigns)
CPM =
(Cost per Mille)
how much does it cost to serve 1,000 impressions?
Cost / Impressions * 1,000
CTR =
(Click-through rate)
how often do impressions lead to link clicks?
Clicks / Impressions
CPC =
(Cost per Click)
how much does it cost to deliver one link click
Cost / Clicks
CVR =
(Conversion rate from click)
how often do link clicks lead to conversion?
Conversions / Clicks (Link clicks only)
CPA =
(Cost per Acquisition)
Cost / Conversions
best used when you don’t have conversion value
ROAS=
(Return on Advertising spend)
Conversion value / Spend
Surveying
data collection from a predefined group of respondents to collect quantitative information
Cross sectional surveying
observation of individuals at one specific point in time
Longitudinal surveying
the same survey run repeatedly in specific time intervals
Panels (repeated surveying)
observing the same individuals over a study period
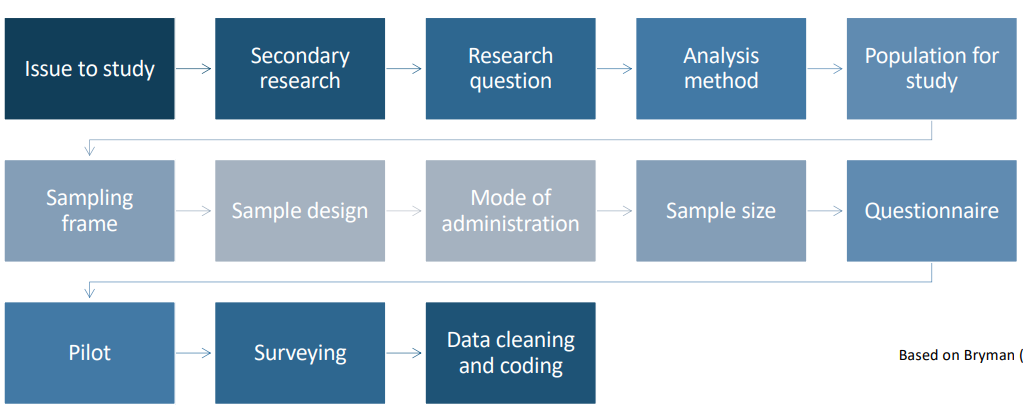
Steps in conducting a survey
Census vs sample survey
Census: obtains data from every member of a population but cost and/or time required
Sample survey: obtains data from a subset of a population
Probability sampling (sampling strategy)
each population element has an equal and known (non-zero) chance of being chosen for the sample
Random chance for everyone of the target population to be included
Best chance to create a sample that is truly representative of the population
Can conduct if you have full list of units – individuals, companies, households, employees, clients, etc
Non-probability sampling (sampling strategy)
we do not know the probability with which each population element will be chosen, and/or we cannot be sure that each population element has a non- zero chance of being chosen
Used if you have no resources (list or access) to conduct probability sampling
Selection of individuals into the sample happens by choice, not by random chance
Main disadvantage : does not allow you to estimate the extent to which sample statistics are likely to differ from population parameters
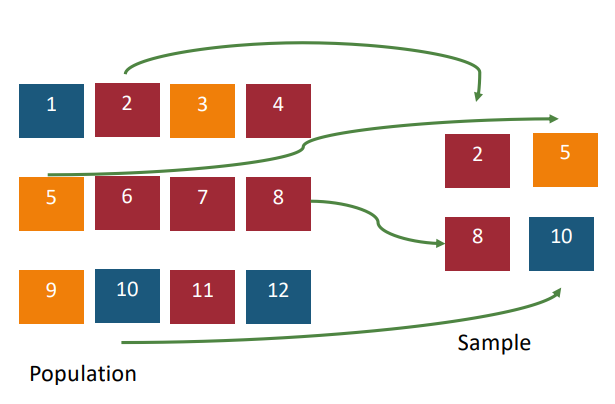
Simple random sampling
Key: every sample is equally likely
Strategy: choose/generate random numbers; draw from a hat etc.
Example: lottery
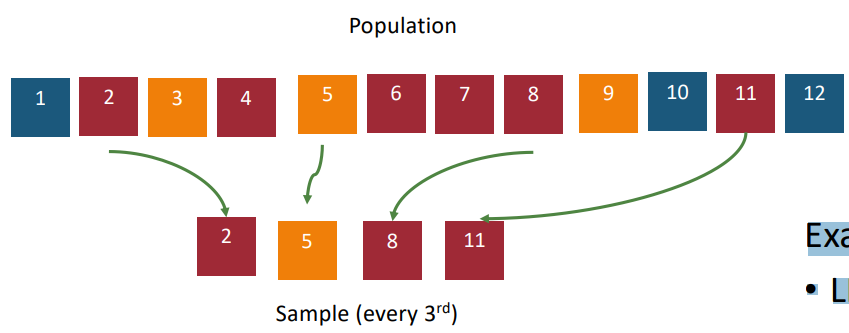
Systematic random sampling
Key: population is conveniently ordered
Strategy: calculate k=N/n, then choose every kth starting at random point between 1 and k
Example: • LFS • EU-Silc
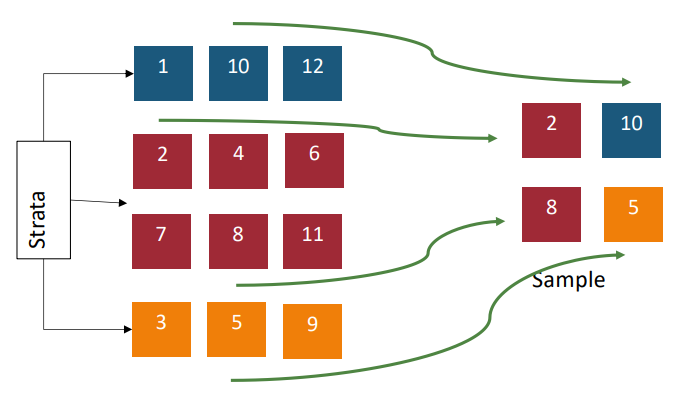
Stratified sampling
Key: sample needs to be chosen according to some characteristic
Strategy: sort population according to the characteristic, then randomly choose a proportional number from each category
Example: • Stratification by gender, nationality, company size
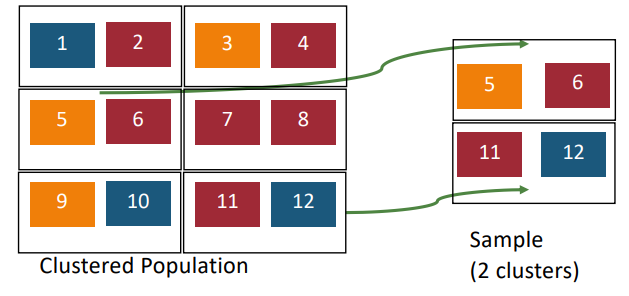
Cluster sampling
Key: population is grouped into clusters which each represent the population
Strategy: randomly choose an appropriate number of clusters
Example: • Health literacy research
Types of non probability samples
Voluntary sample-made up of people who self-select into the survey
Convenience sample-made up of people who are easy to reach
Snowball sample-a kind of convenience sample, when researcher makes initial contact with small group of people and then use these to establish contact with others
Quota sampling-produces a sample that reflects population in terms of certain characteristics (gender, age, nationality etc.)
How to ‘verify’ a non-prob sample?
1. Analyse descriptives & compare to target population
2. Think through and account for potential sources of bias with regards to your RQ • Do you have reasons to suspect that the bias will affect results in a specific way?
3. Martin & Bateson (1986) method for checking adequacy of sample: the split half-half analyis for consistency- Randomly divide sample in halves and analyse them separately. If conslusions from two sets are consistent, the samples are good, if conclusions differ – need more data / different sample
How small a sample is big enough?
Build up from sub-groups of your interest- Smallest sub-group should be 30-50
400-500 is typically large enough sample for a customer survey-produces results within 95% confidence level
Precision / reliability of estimates increase rather steadily up to 150- 200 observations increasing sample size
1000 is a standard offered by market research companies
Most important biases in survey research
1. Researcher bias
2. Poor match of the sample to the population
3. Lack of randomness/response bias
4. Cognitive biases (questionnaire)
Behavioral questionnaire
Observed by researchers
Watch customers / users do things
The most precise account of behaviour
A/B tests = experiments, Observations
Attitudinal questionnaire
Self-reported by users
Ask customers / users questions
What people think
When behaviour is impossible to observe, needed for buiding buyer personas
Surveys, Interviews, Focus groups
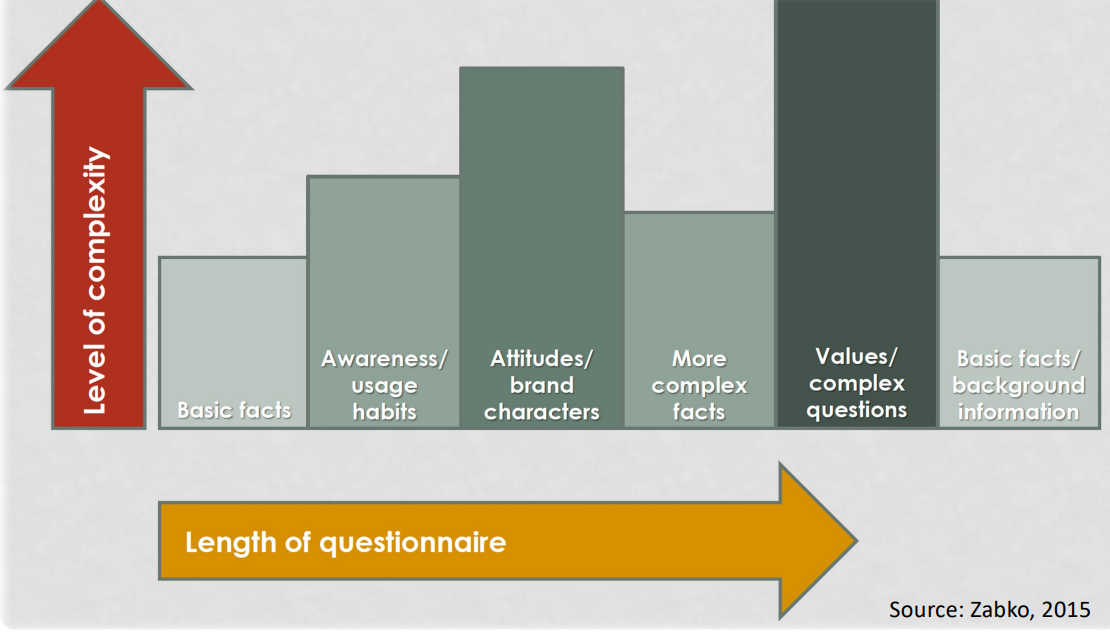
Sequencing questions
Principles of question design: Measurement rules
As accurate scale as possible- you always have a possibility to make more detailed scale to less accurate one, but never – vice versa. Eg. Age in full years vs age brackets
List of responses (scale) has to be-mutually exclusive, collectively exhaustive (all potential answers are listed)
Measurement scale asks too much effort to respond?- “Total number of employees vs brackets of number of employees”
Sensitive questions strategies
• Provide context, guarantee anonymity
• Positioning of questions
• Careful wording (but don’t be abstract and don’t leave space for interpretation)
• Question loading (normalise any behaviour)
• Ask about the neighbour (indirect inquiry)
"non-attitudes" or "pseudo-opinions" mitigation solutions
Knowledge Questions
Include a "Don't Know" Option (+/-)
Filter Questions
Vignettes
Probe for Certainty
Post-Survey Weighting
Social Desirability & Conformity bias
Tendency to modify behavior or opinions to fit societal norms or expectations.
Influenced by desire for social acceptance and fear of rejection.
Yea Saying and Acquiescing bias
Tendency to agree or comply without questioning or opposing.
Telescoping bias
The tendency to remember events as more recent than they actually were, leading to an inaccurate perception of time sequence.
Order Effects bias
The tendency for the order of presentation to influence decision-making or judgment