NSE 212 Statistical Test Formulas
1/46
There's no tags or description
Looks like no tags are added yet.
Name | Mastery | Learn | Test | Matching | Spaced |
|---|
No study sessions yet.
47 Terms
Independent t test
- 2 groups, measure once
- Experimental & control group
- IV LoM: N
- DV LoM: I/R
t test
Parametric
Independent t test: df
(n1 - 1) + (n2 - 1)
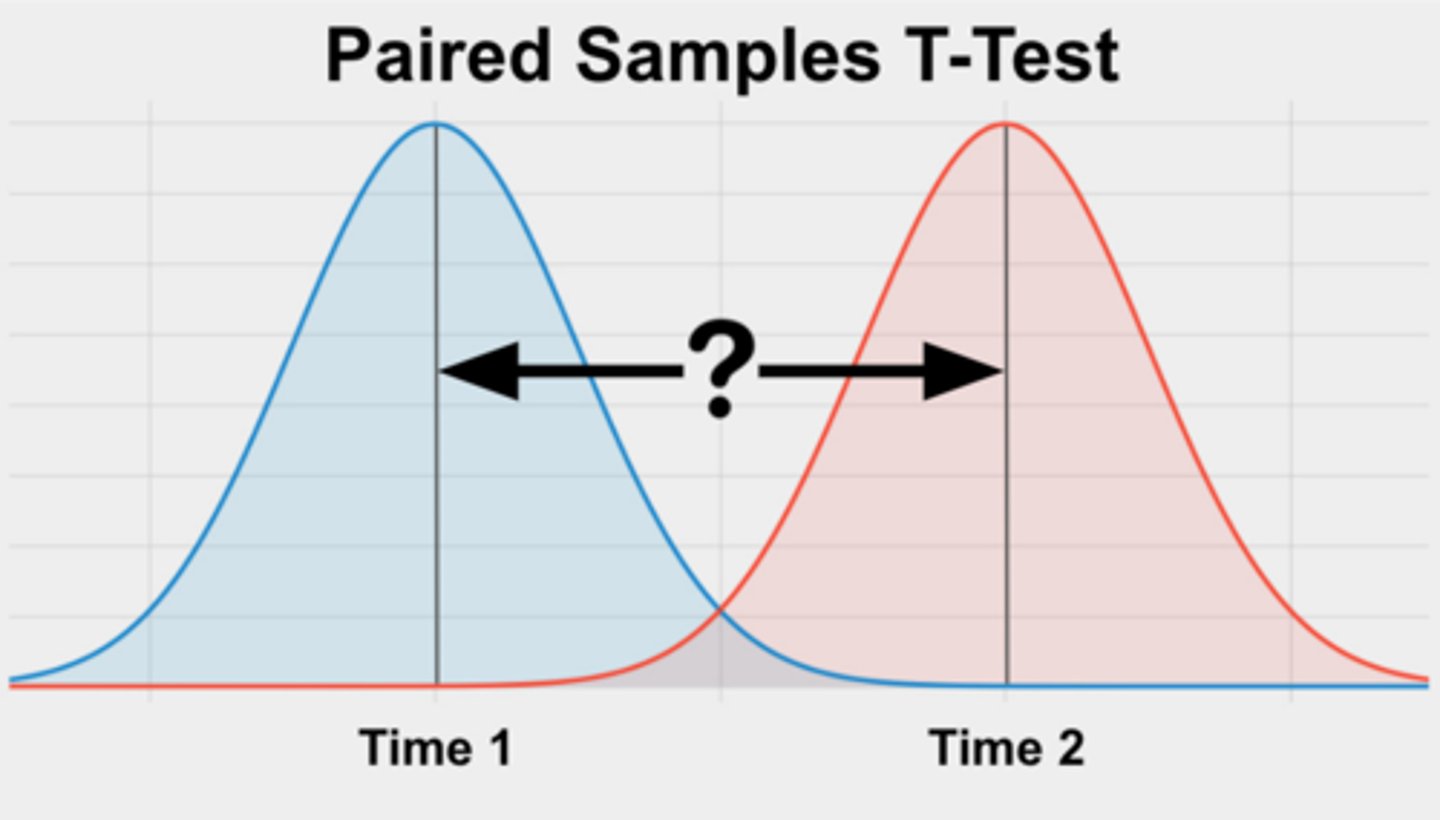
Dependent (paired) t test
- Same group, measure twice
- pre/post
- IV LoM: N
- DV LoM: I/R
Dependent t test: df
n - 1
One way ANOVA
- Simple
- 2+ groups
- Measure once
- IV LoM: N
- DV LoM: I/R
Two way ANOVA
- Multifactors
- 2+ groups
- Measure once
- IV LoM: N
- DV Lom: I/R
Repeated Measures ANOVA
A one-way or two way ANOVA that involves correlated groups of participants (T1, T2, T3)
Factorial Analysis of Variance
used when an experiment involves more than one independent variable; can separate the effects of different levels of different variables
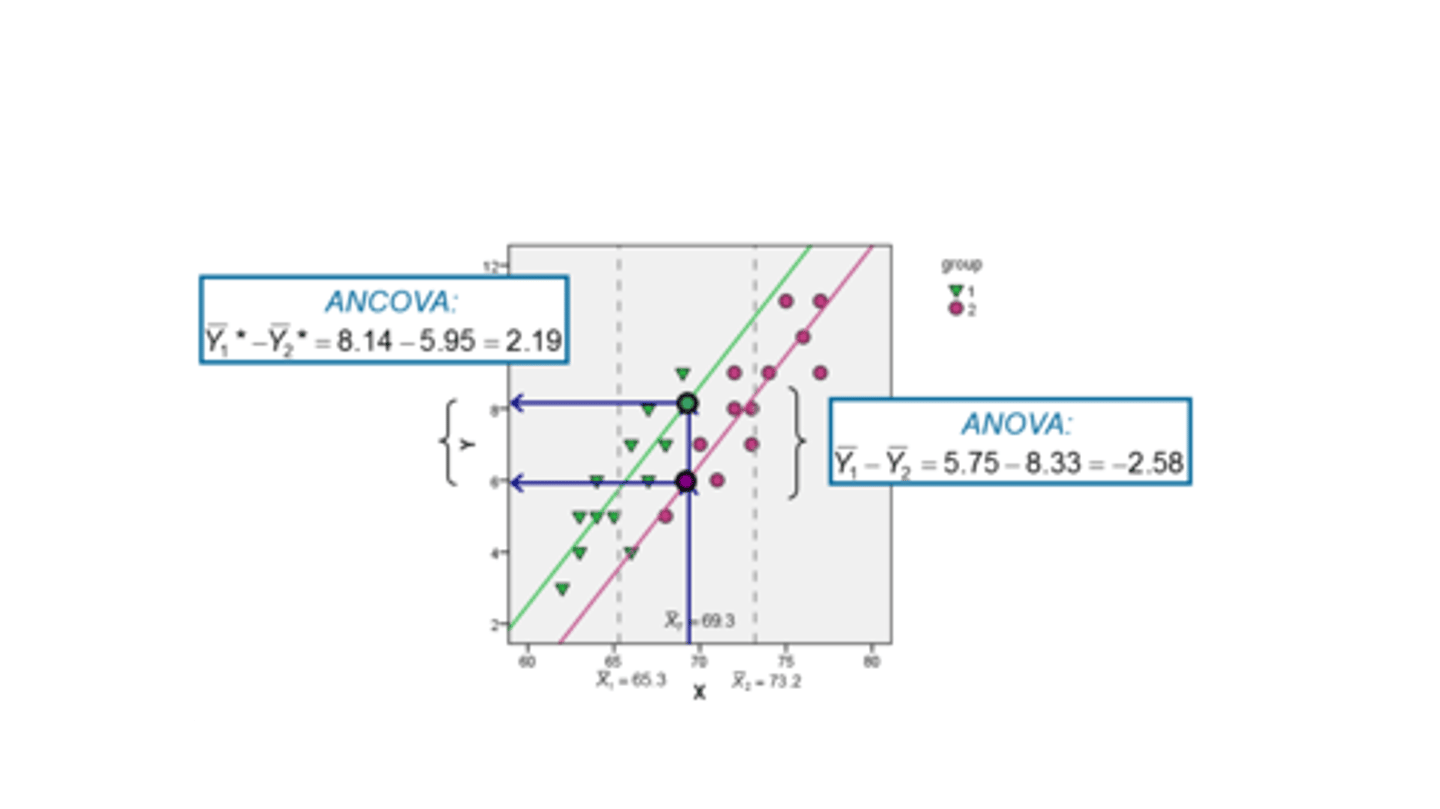
ANCOVA
- Analysis of Covariance
- Combination of ANOVA & multiple regression
- Multivariate statistical test done (test of DIFFERENCES)
ANOVA/ANCOVA: df
numerator (between groups) = # of groups - 1
denominator (within groups) = N (total sample) - # of groups
F test
Parametric
- Difference between > difference within
- Post hoc test to find source of difference
Chi-Square
- Comparison of what is observed and what is expected by chance
- IV LoM: N
- DV LoM: N
One sample Chi-Square
- Goodness of fit
Two sample Chi-Square
- Test of independence
One sample Chi-Square: df
# of rows - 1
Two sample Chi-Square: df
(# of rows - 1)(# of columns - 1)
χ2
Non Parametric
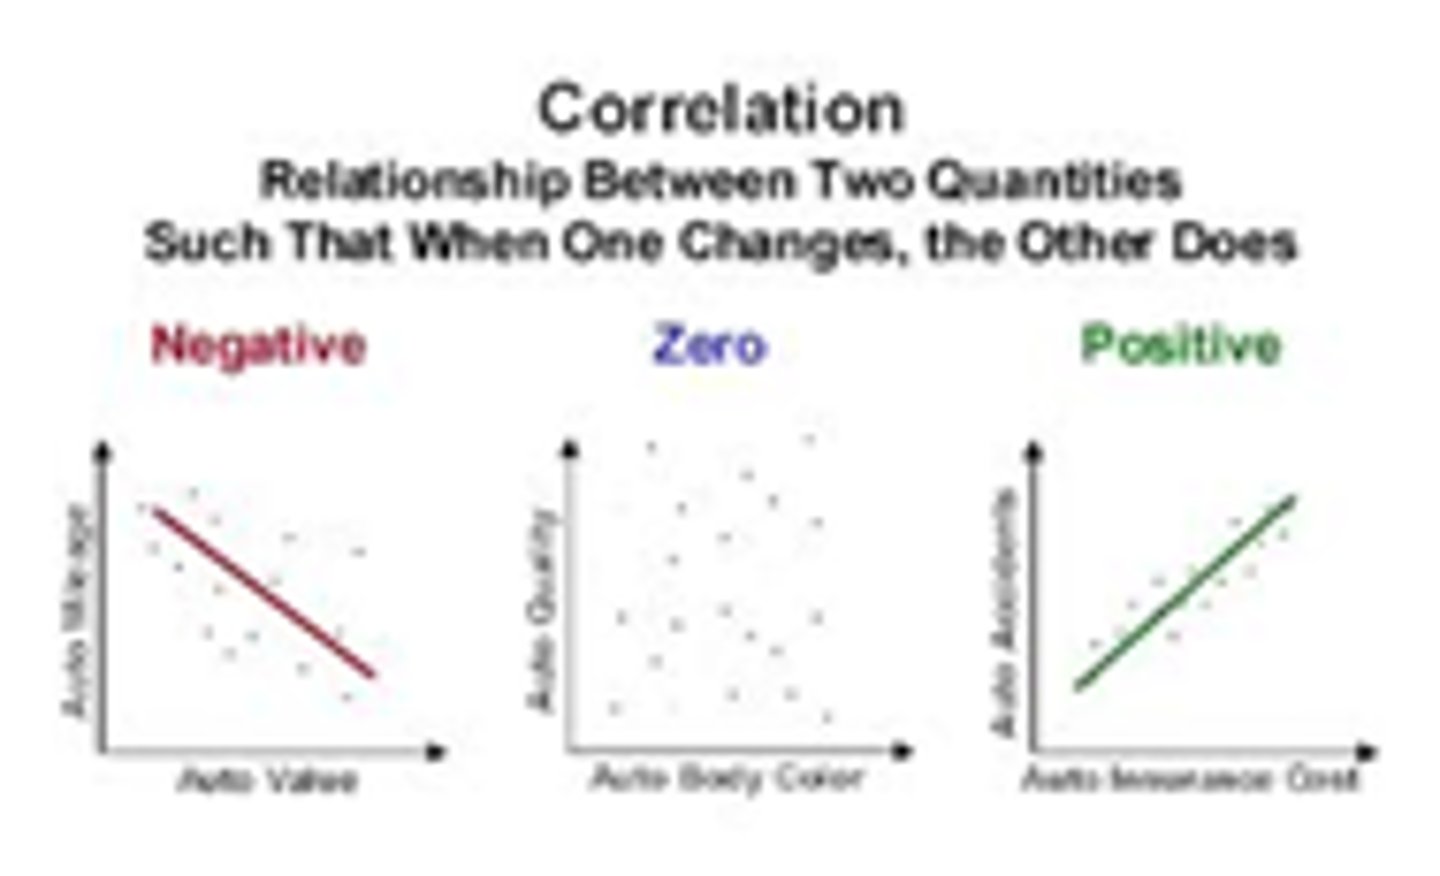
Pearson's R
- Pearson correlation coefficient
- Relationship between 2 continuous variables
- 2 groups
- IV LoM: I/R
- DV LoM: I/R
Multivariate Statistical Analysis
- Multiple Regression Analysis
- Testing RELATIONSHIPS when there are 1+ IV
- IV LoM: N/I/R
- DV LoM: I/R
Pearson's R: df
N - 2
r test
Parametric
χ2 =
(O-E)^2 / E
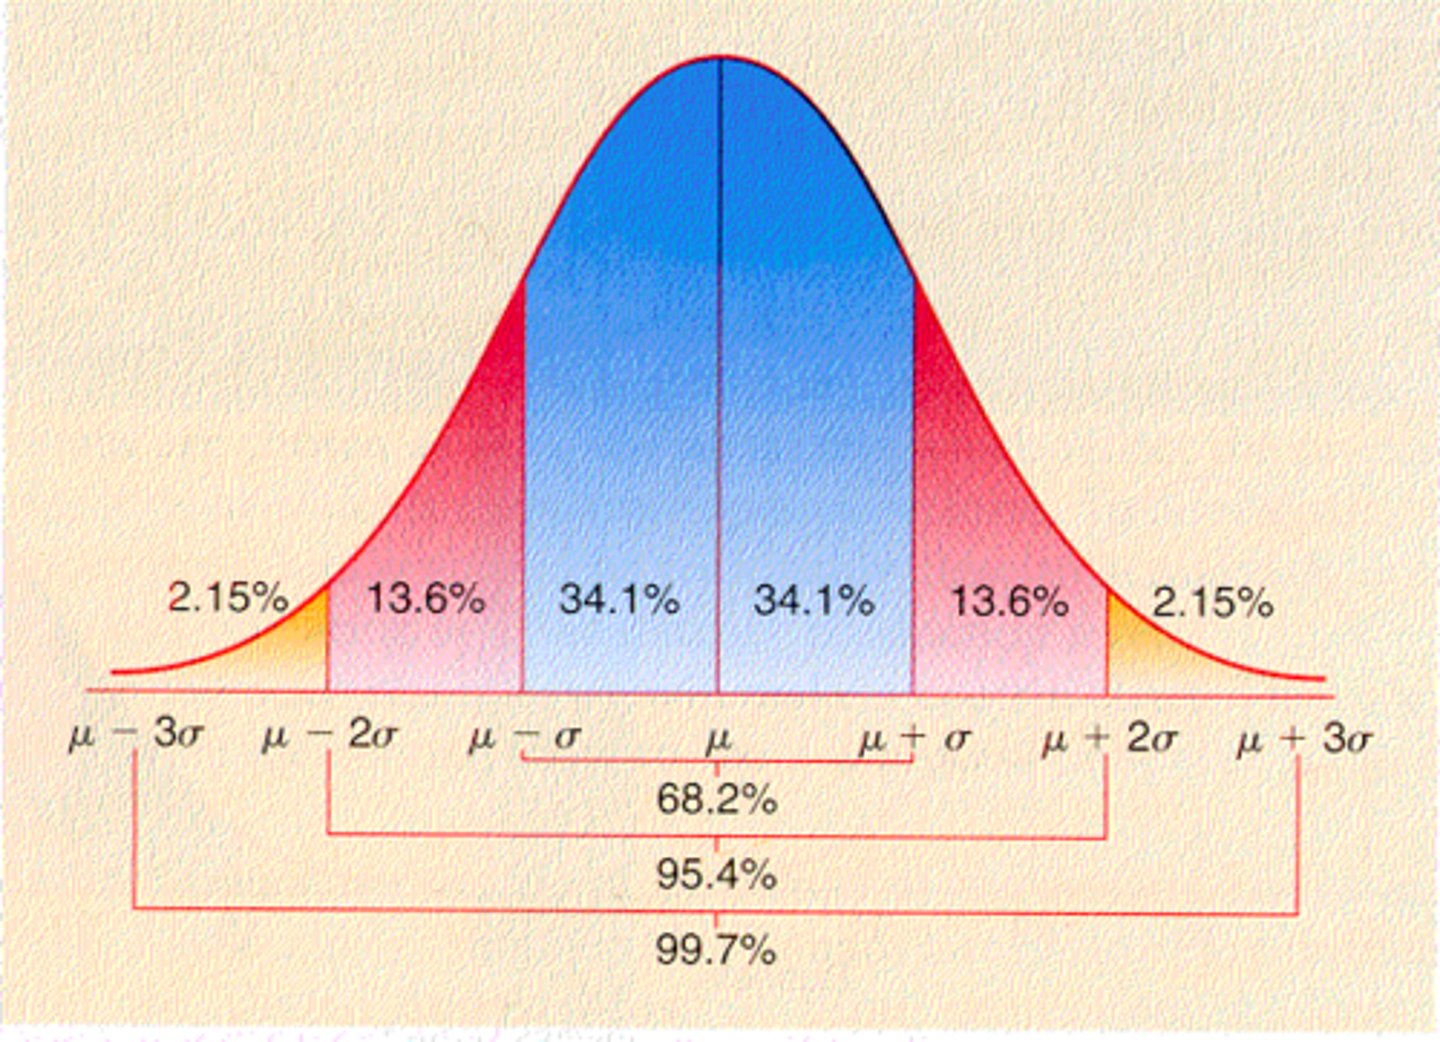
Normal Distribution Standard Deviation
68% = 1
95% = 2
99.7% = 3
Z score
(X-X̄)/SD
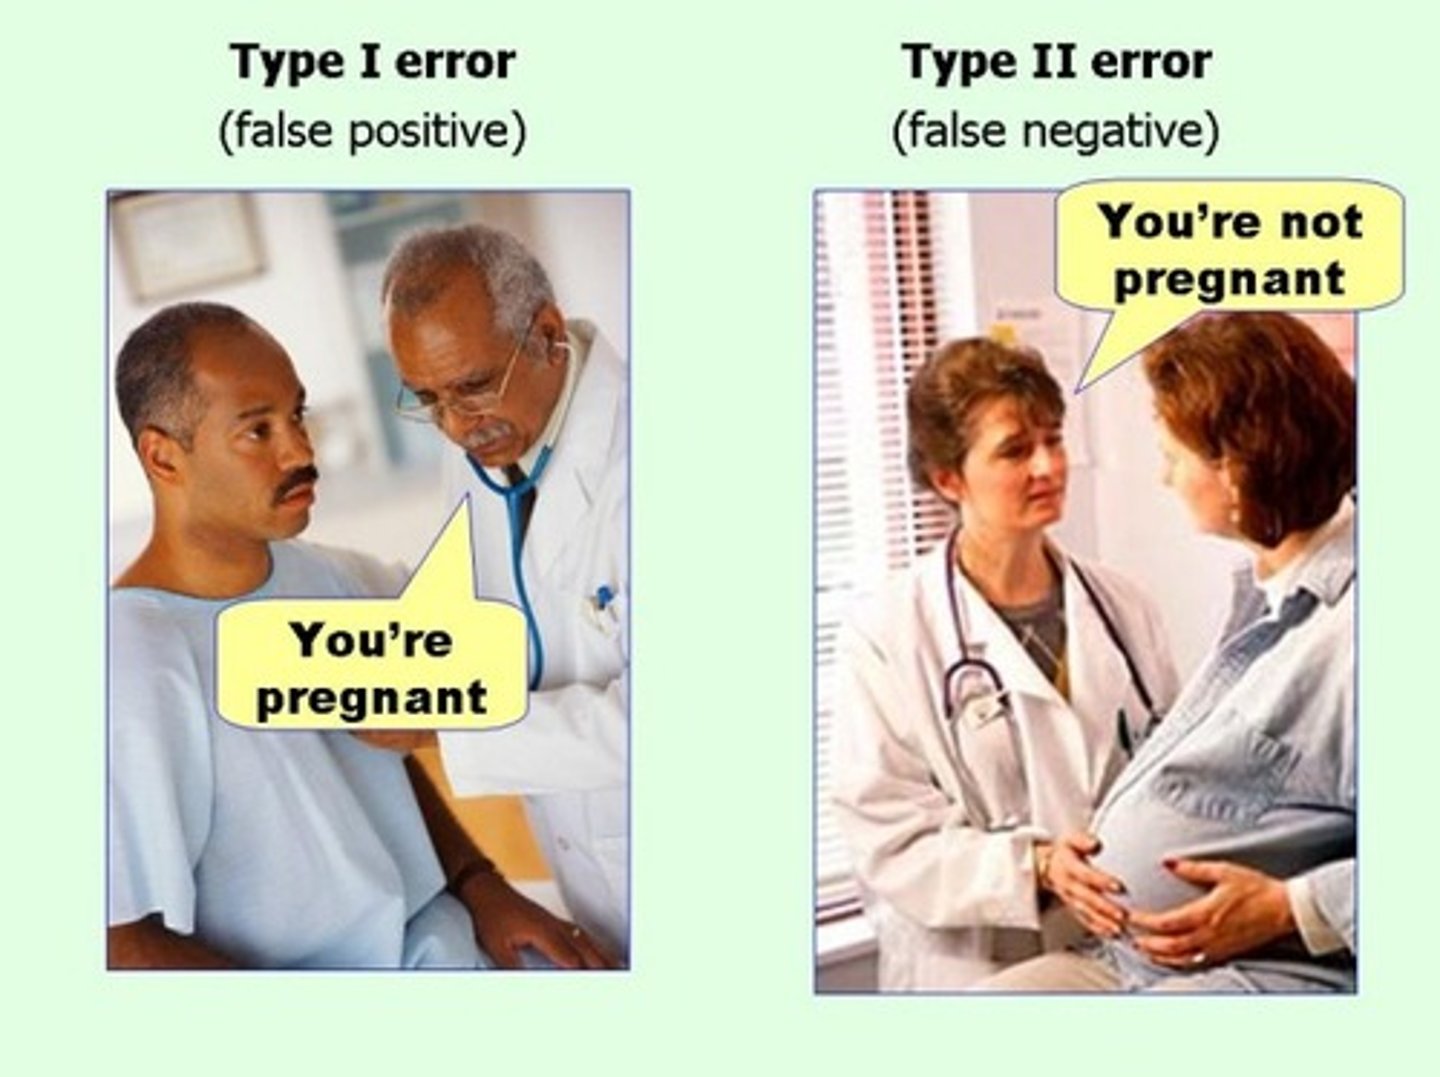
Type 1 error (alpha)
- Rejecting the null hypothesis when it is in fact true
- False positive
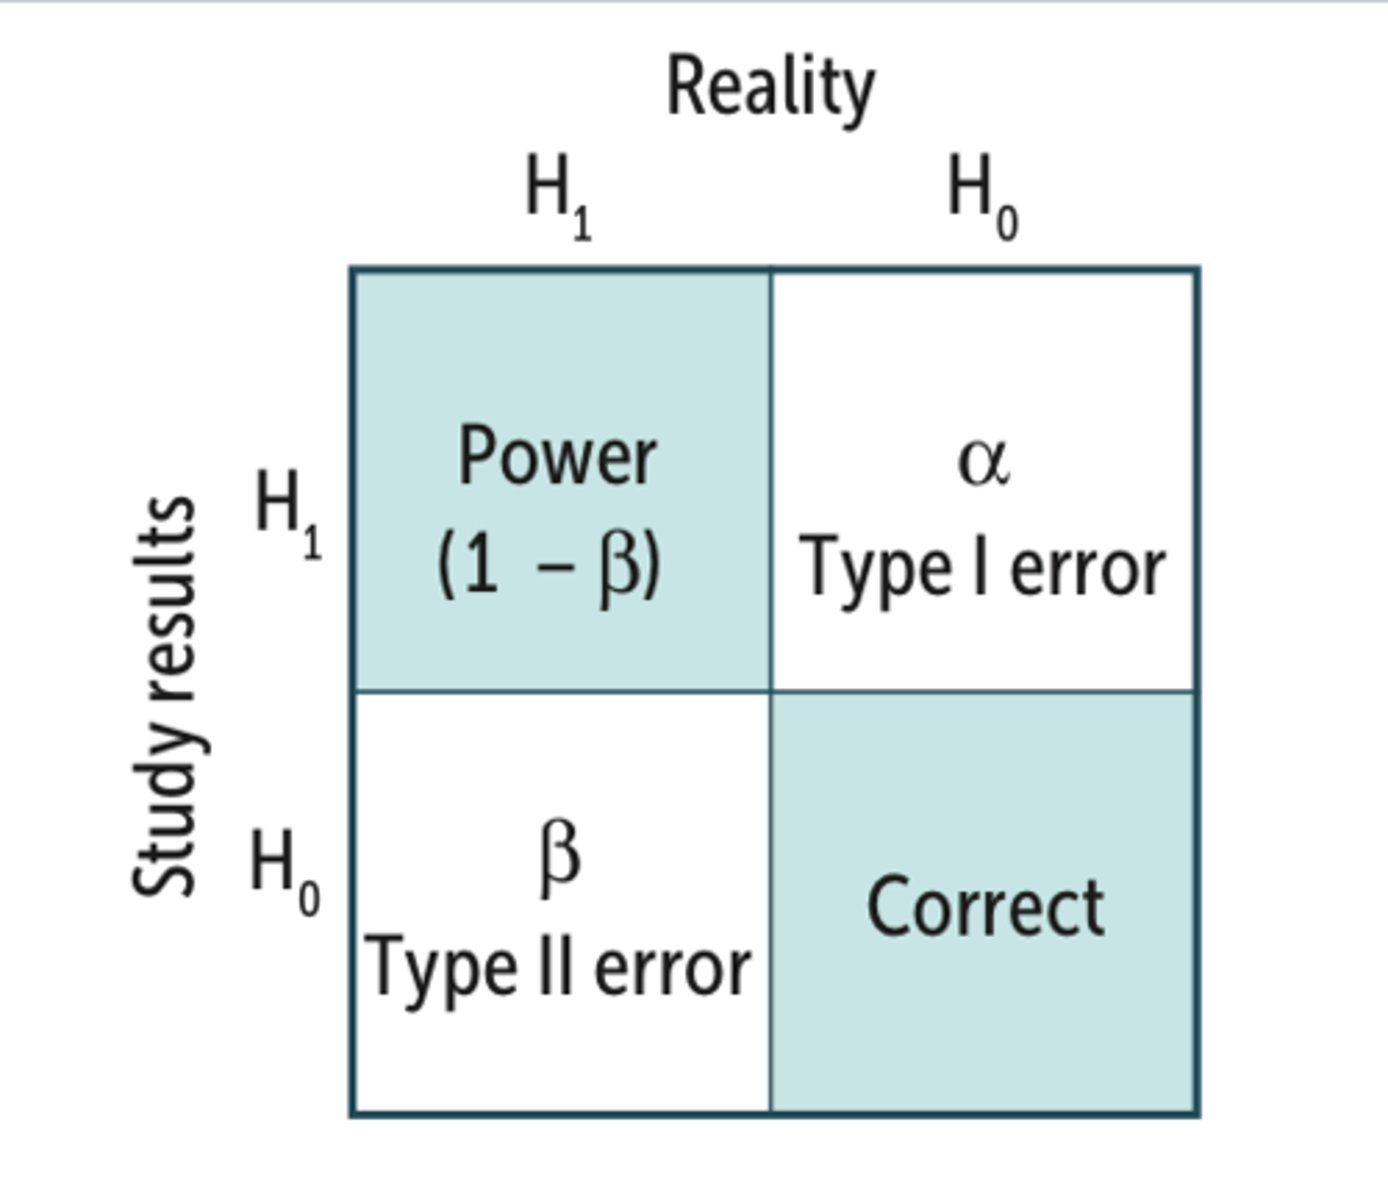
Type 2 error (beta)
- Accepting the null hypothesis when it is false
- False negative
alpha (α)
- Level of significance
- risk associated with not being 100% positive that what occurred in the experiment is a result of the treatment or intervention
- Commonly set at 0.05 (5%) or 0.01 (1%)
Lowering the risk of a ___ increases the risk of a ___. Why?
Type 1 error, Type 2 error
►The stricter the criterion for rejecting a H0, the greater the probability of accepting a null hypothesis when it is false (Type II error)
Null is true, Reject the null
Type 1 error
Null is false, Accept the null
Type 2 error
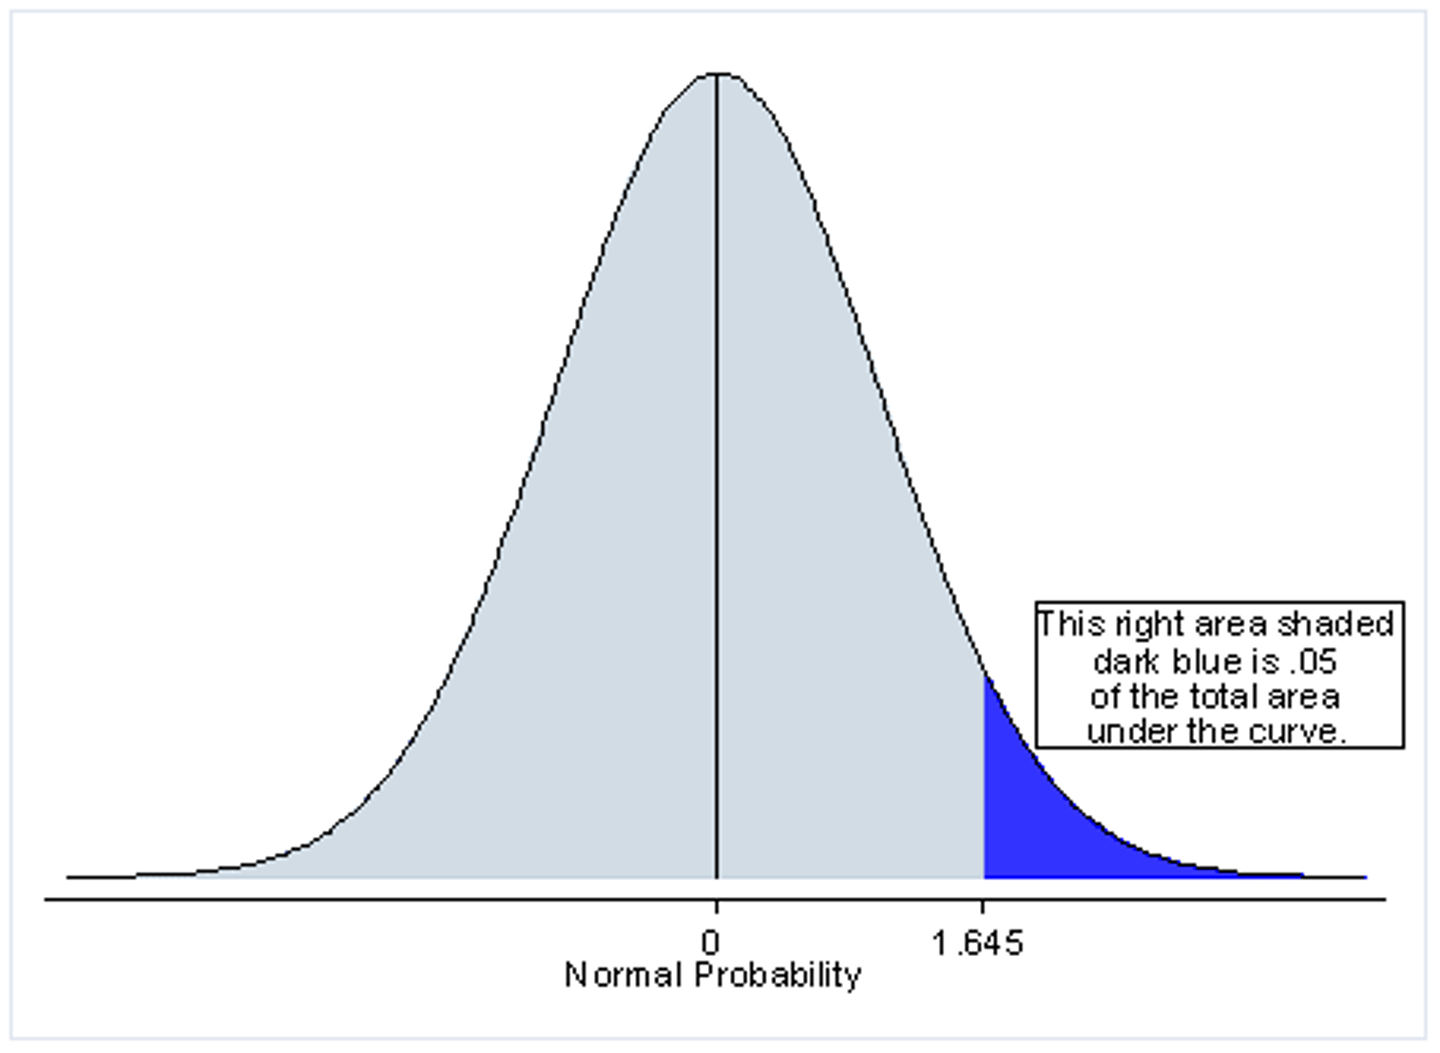
p ≤ α (0.05)
Reject null hypothesis, results are statistically significant
Two tailed test
Non directional hypothesis
One tailed test
Directional hypothesis
Exclusive range
h - l
Inclusive range
h - l + 1
Standard Deviation formula
SD = √ ∑ (X-X̄)^2 / n - 1
Variance formula
- Standard deviation squared
- SD^2
Pearson Product-Moment Correlation
rxy
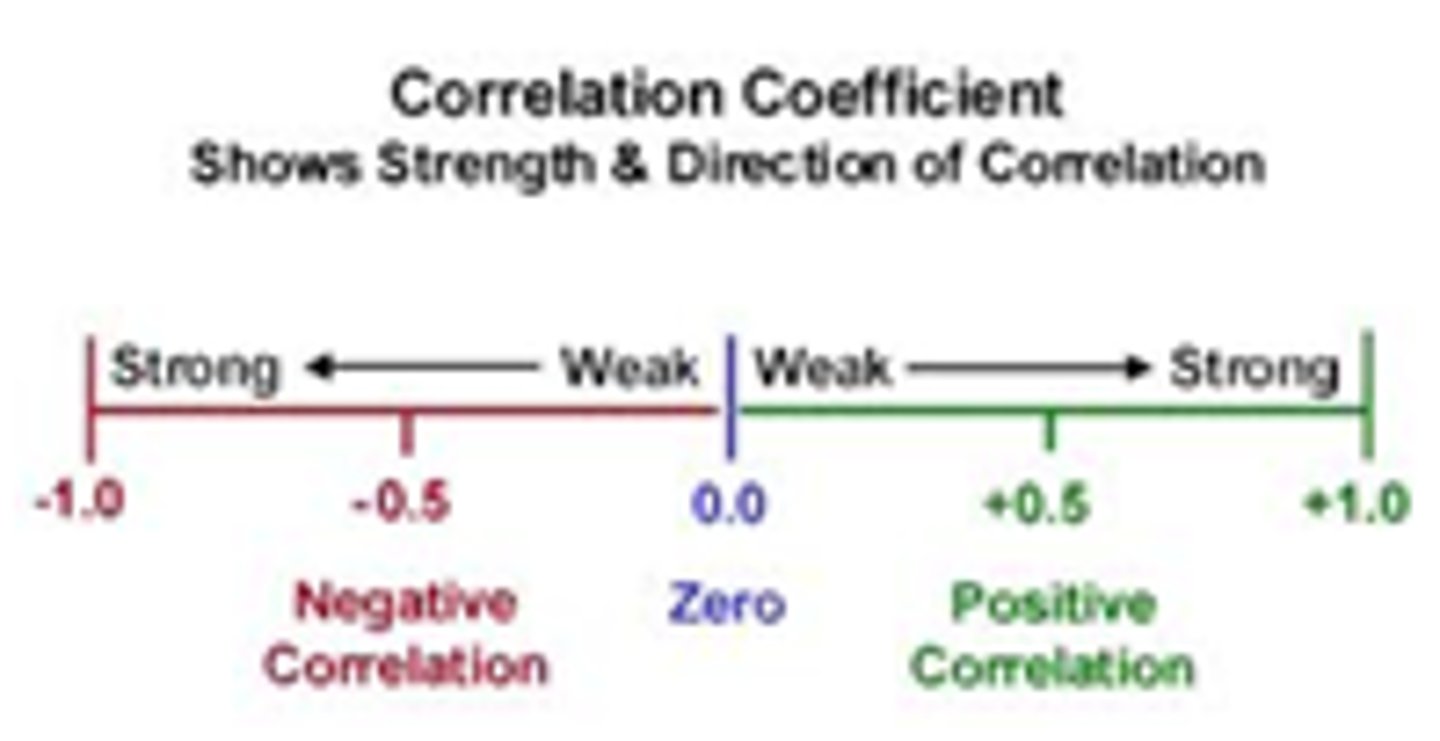
Correlation Coefficient: 0 to 0.1
weak or no relationship
Correlation Coefficient: 0.2
weak to moderate relationship
Correlation Coefficient: 0.3
moderate relationship
Correlation Coefficient: 0.4
moderate to strong relationship
Correlation Coefficient: 0.5 to 1.0
strong relationship
Reliability Coefficient
- Cronbach's alpha
> 0.7 = considered acceptable
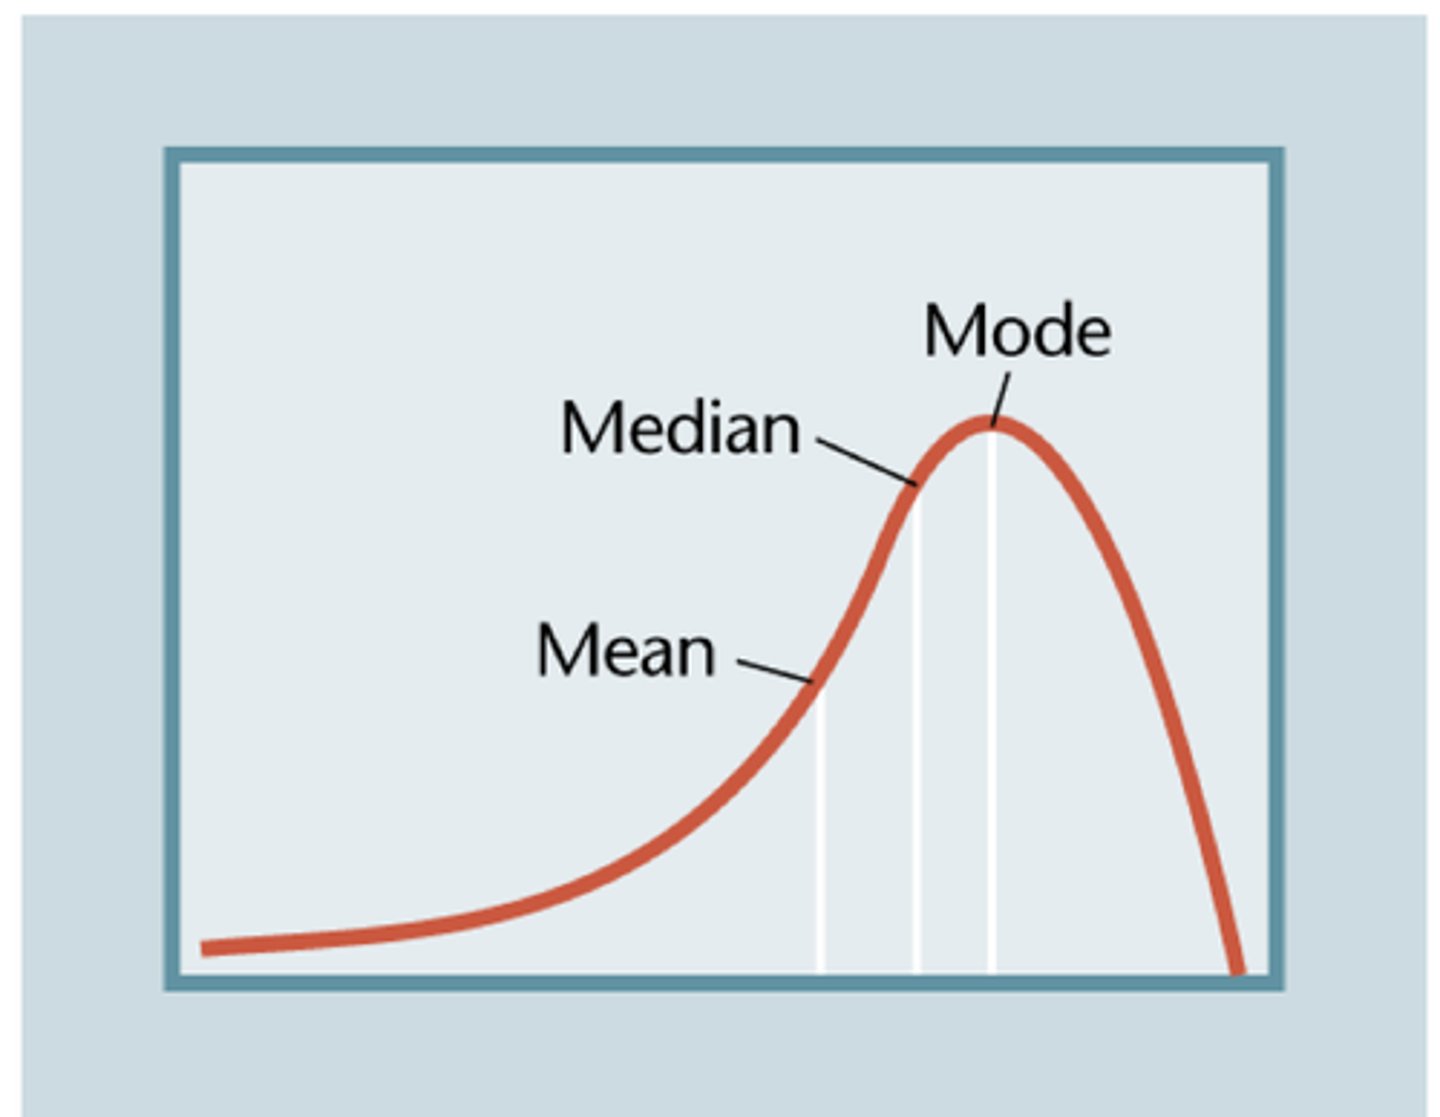
Positively Skewed Distribution
A distribution in which scores pile up at the low end of the scale
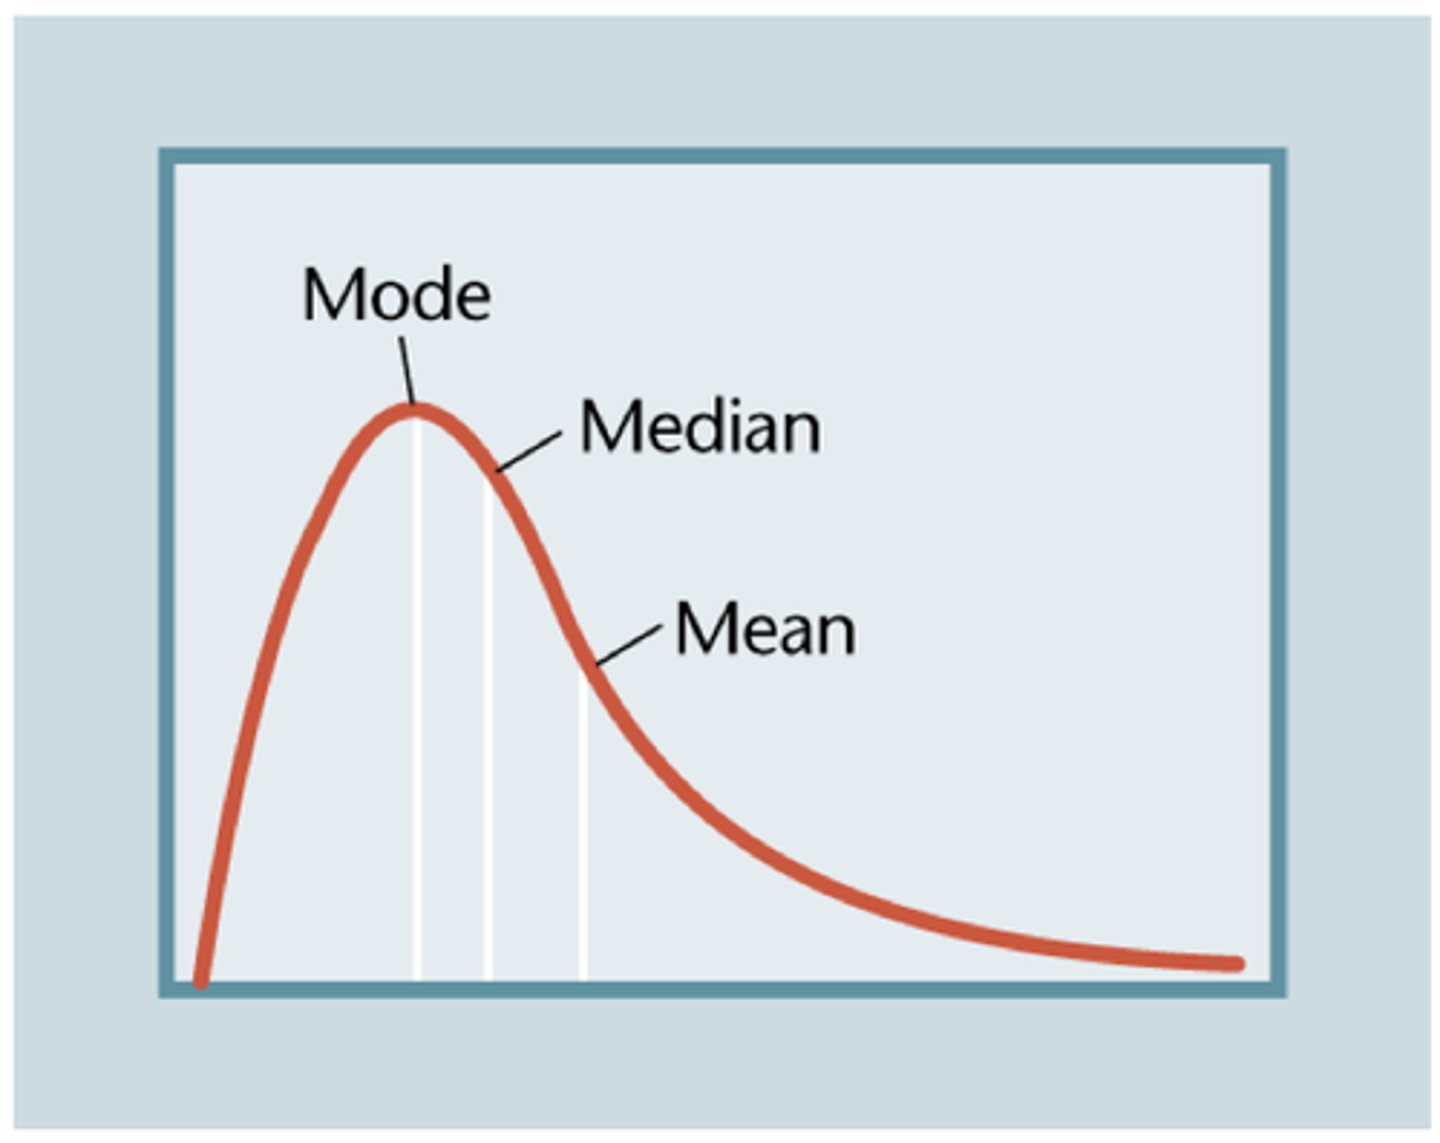
Negatively Skewed Distribution
A distribution in which most scores pile up at the high end of the scale.