descriptive statistics
1/41
There's no tags or description
Looks like no tags are added yet.
Name | Mastery | Learn | Test | Matching | Spaced |
|---|
No study sessions yet.
42 Terms
data
Facts and statistics collected together for reference or analysis
data set
all the data collected in a particular study
Types of Measurement Scales
1. Nominal
2. Ordinal
3. Interval
4. Ratio
nominal
no 'favourite' option (better than), No ordering
nominal variable type
Discrete (i.e., categorical)
nominal examples
university you attend, favourite colour
Ordinal
Non-consistent ordering, doesnt require consistency between each scale points (1st and 2nd place may be decided by a minute, 15th and 16th maybe 3 seconds)
ordinal variable type
Discrete or Continuous
ordinal example
rank in army, race position, school grade (C+)
Interval
Consistent ordering, no true zero
interval variable type
Discrete or Continuous
interval example
degrees Celsius, time of day, ATAR
Ratio
Consistent ordering, true zero
ratio variable type
Discrete or Continuous
ratio example
degrees Kelvin, height, reaction time (ms)
statistics
Numerical statements about data from a sample, and the scientific discipline associated with making and understanding those statements; used to communicate important information about our data
descriptive statistics
statistics that describe the characteristics of our sample
measures of central tendency
mean, median, mode; describe the "typical" score / data-point from our sample
mode
the most frequently occurring score(s) in a distribution
median
the middle score in a distribution; half the scores are above it and half are below it
how to calculate the median
Put all the numbers in numerical order.
If there is an odd number of results, the median is the middle number.
If there is an even number of results, the median will be the mean of the two central numbers.
mean
average
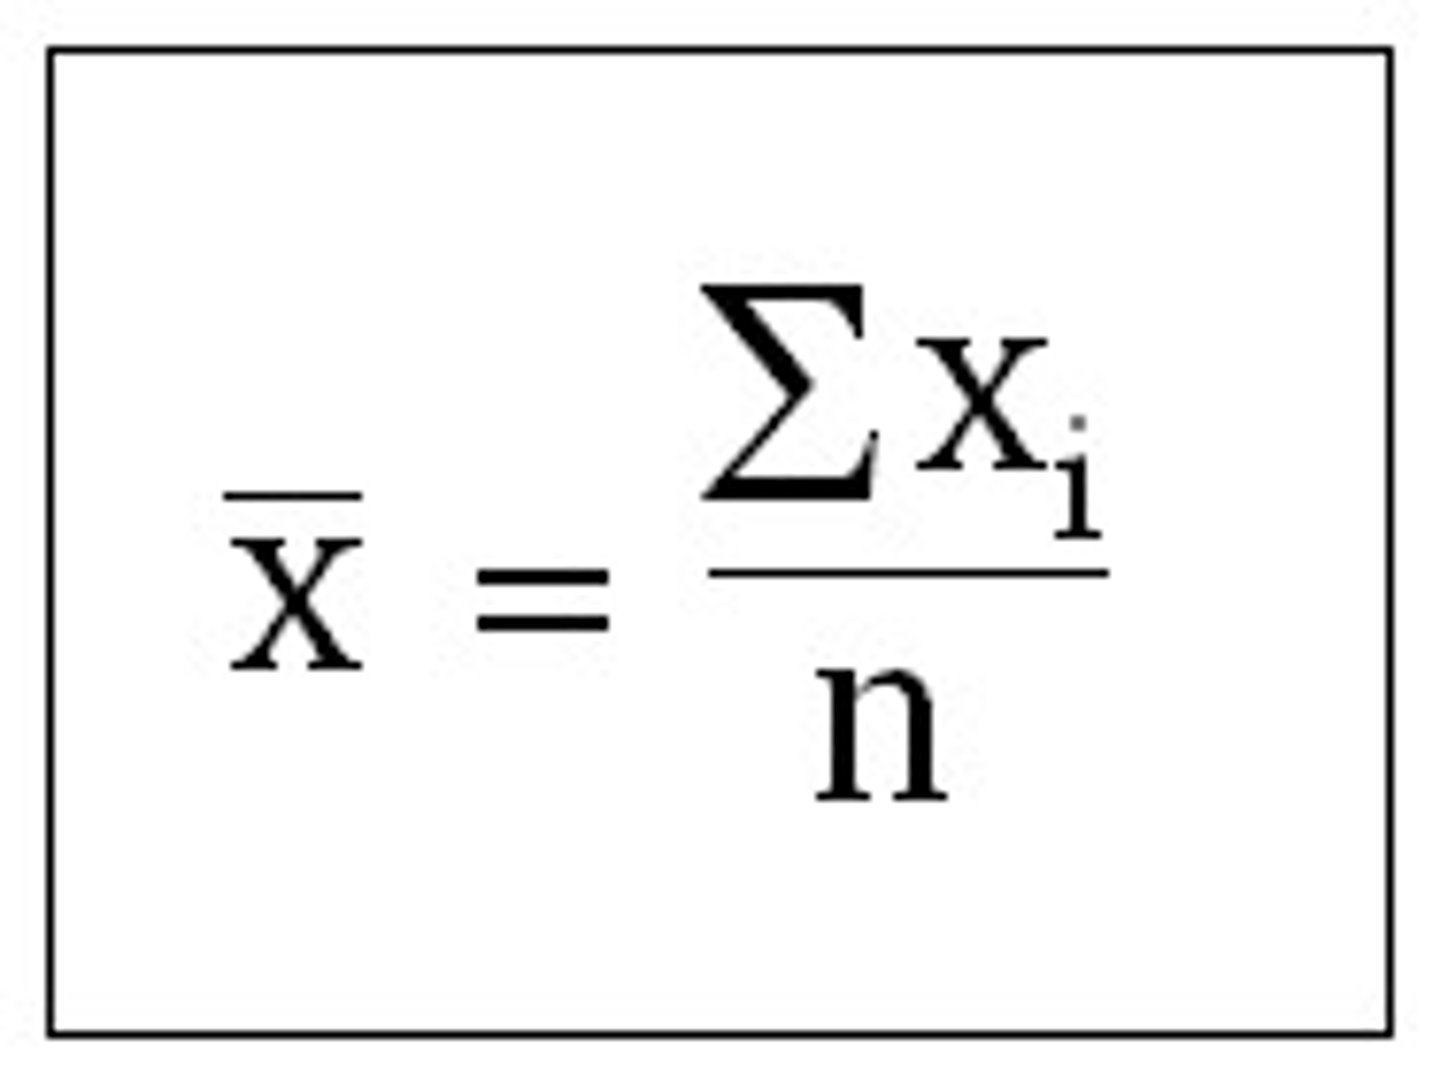
how to calculate the mean
add up all the numbers, divide by how many you added
shape distributions
symmetric or skewed
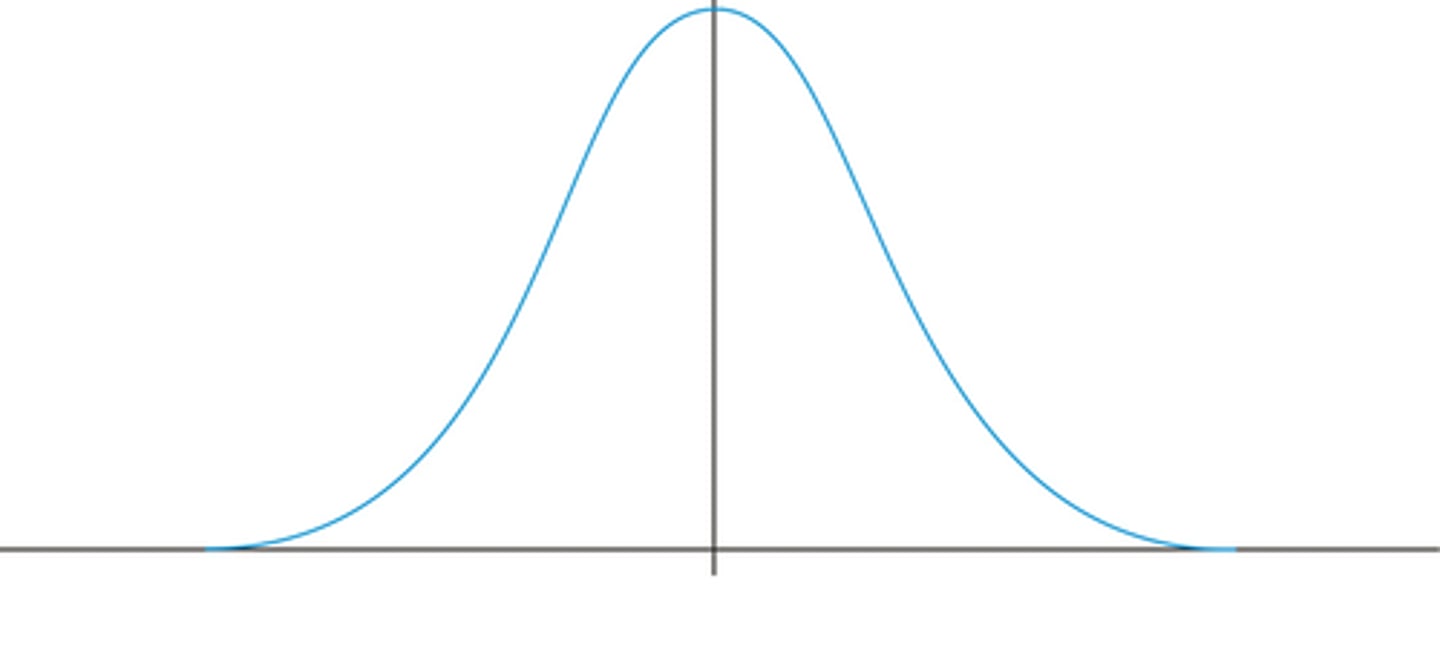
symmetric shape
Right and left side are symmetric; Mean, Median and Mode will be equal (rare)
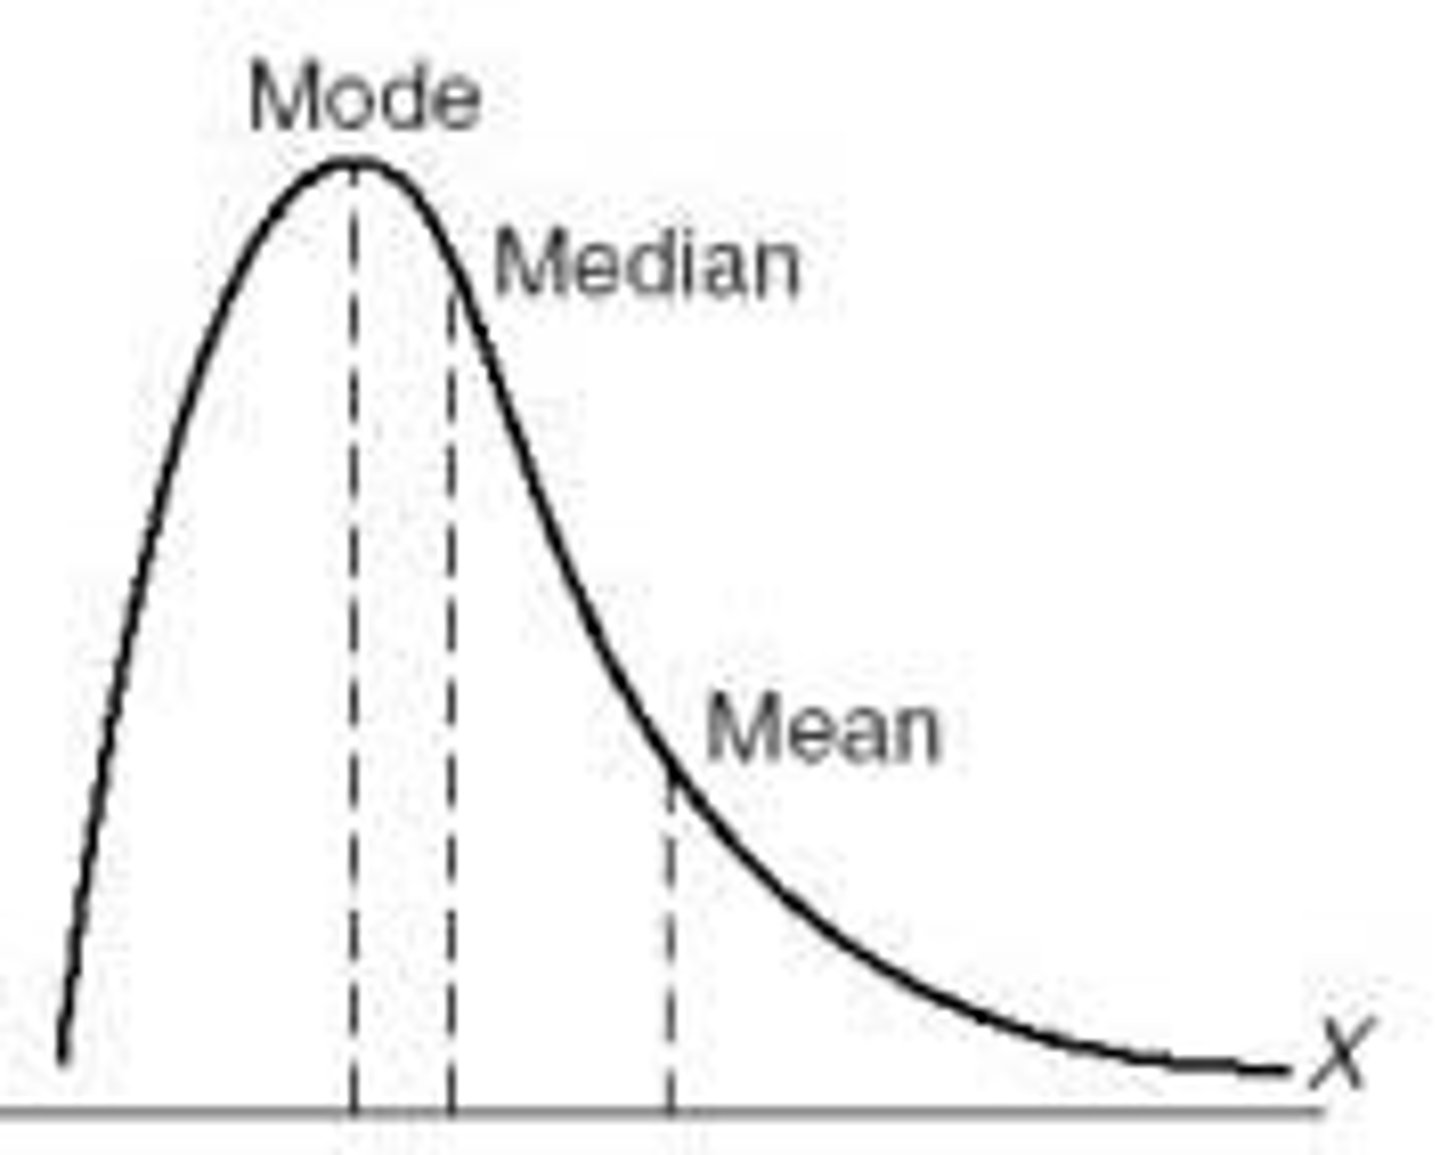
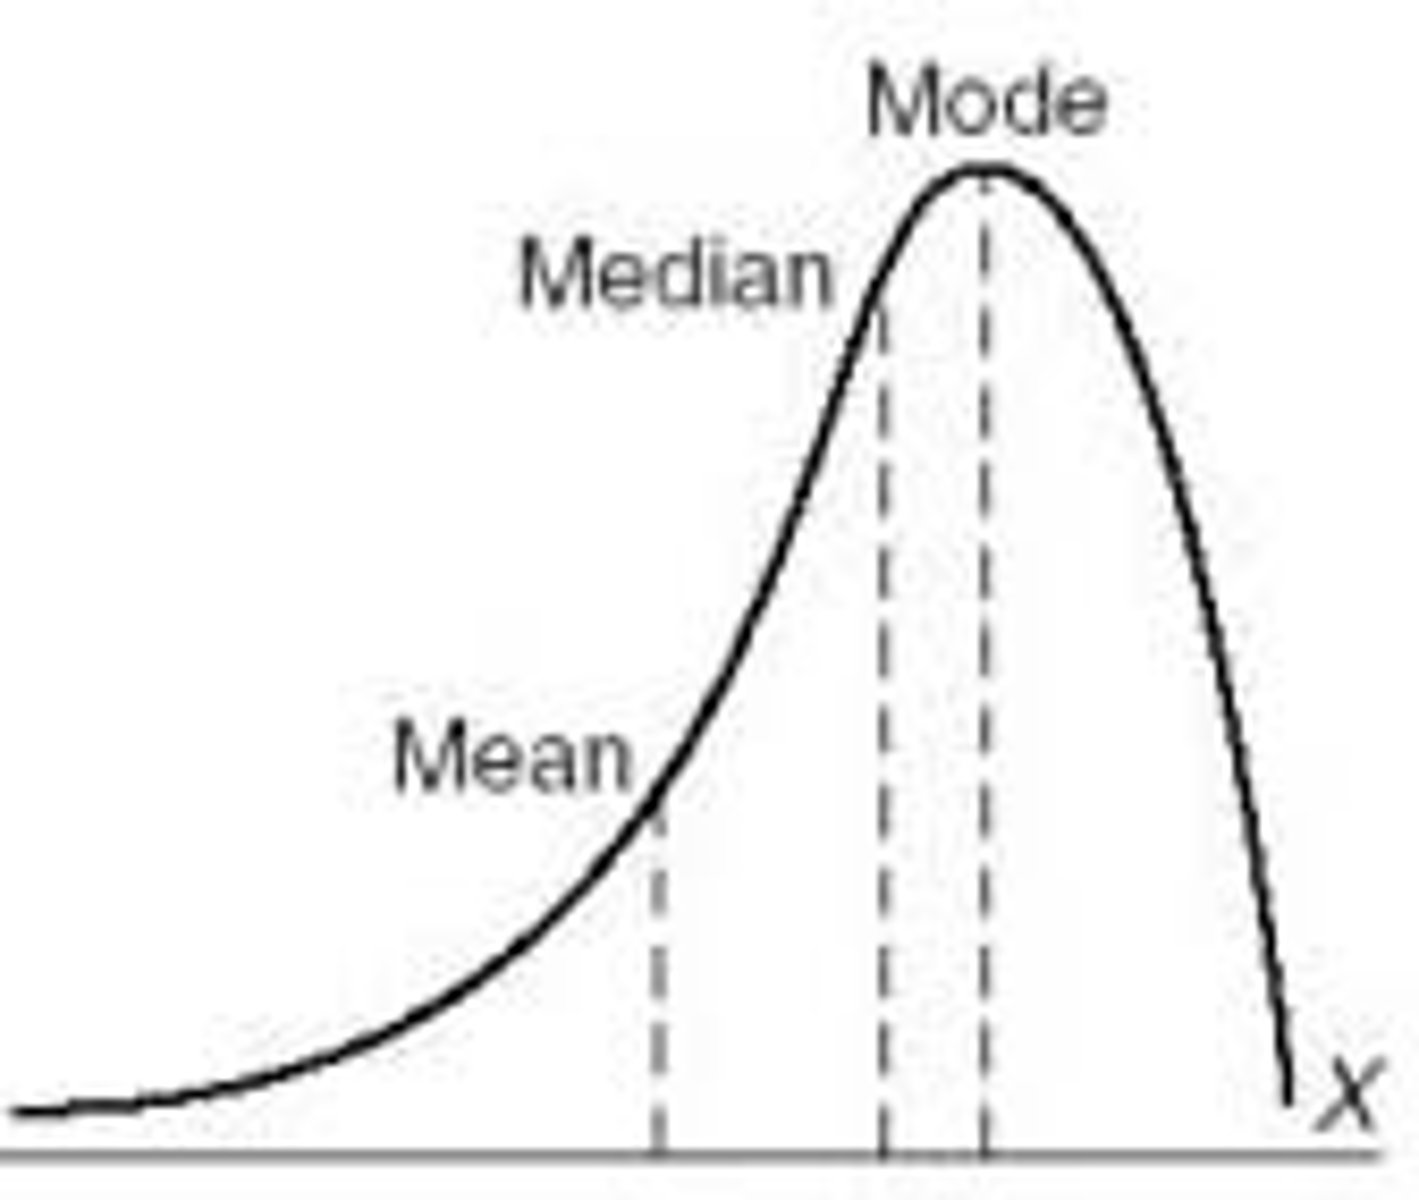
skewed shape
If a distribution is squished to one side (skewed), then the mean, median and mode will not be the same; Like a mouse, a distribution has a body and a tail; The mean gets dragged towards the "tail", The median also is slightly dragged, The mode stays pretty resilient:
negatively skewed data
distribution's tail extends to the left, in a negative direction
positively skewed data
distribution's tail extends to the right, in a positive direction

measures of dispersion
Range, Variance, and Standard Deviation; describe the "spread" of scores / data-points from our sample
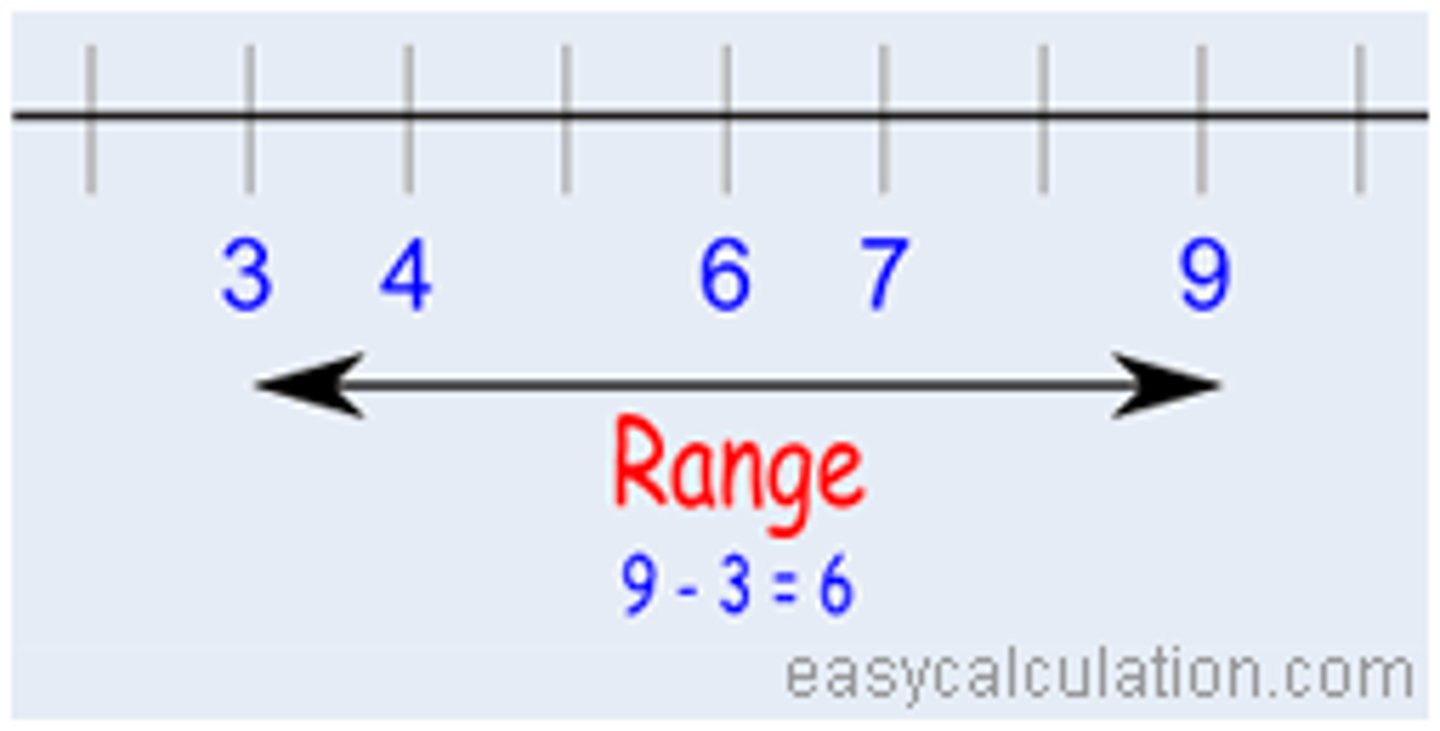
range
the difference between the highest and lowest scores in a distribution
variance
"average" of the squared distances between each score and the mean
(score - mean)^2
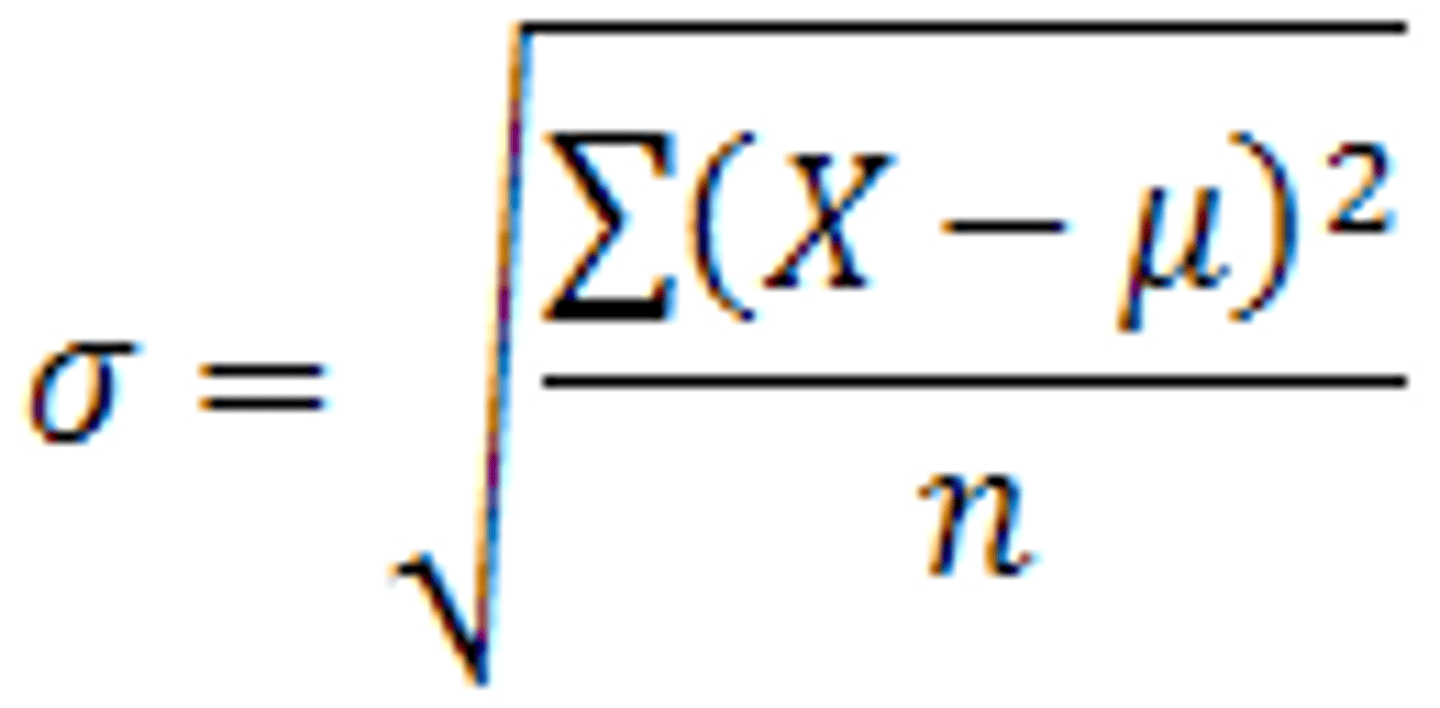
standard deviation
a measure of variability that describes an average distance of every score from the mean; Variance of the dataset, but in the context of the original measurement scale.
types of stats summary
-Descriptive Stats → Describe your SAMPLE
-Inferential Stats → Use your sample to describe the POPULATION
-Statistical inference → Making statements about the population, from what the sample tells us.
statistical inference
The process of using data obtained from a sample to make estimates or test hypotheses about the characteristics of a population.
bell curve
distribution of scores in which the bulk of the scores fall toward the middle, with progressively fewer scores toward the "tails" or extremes
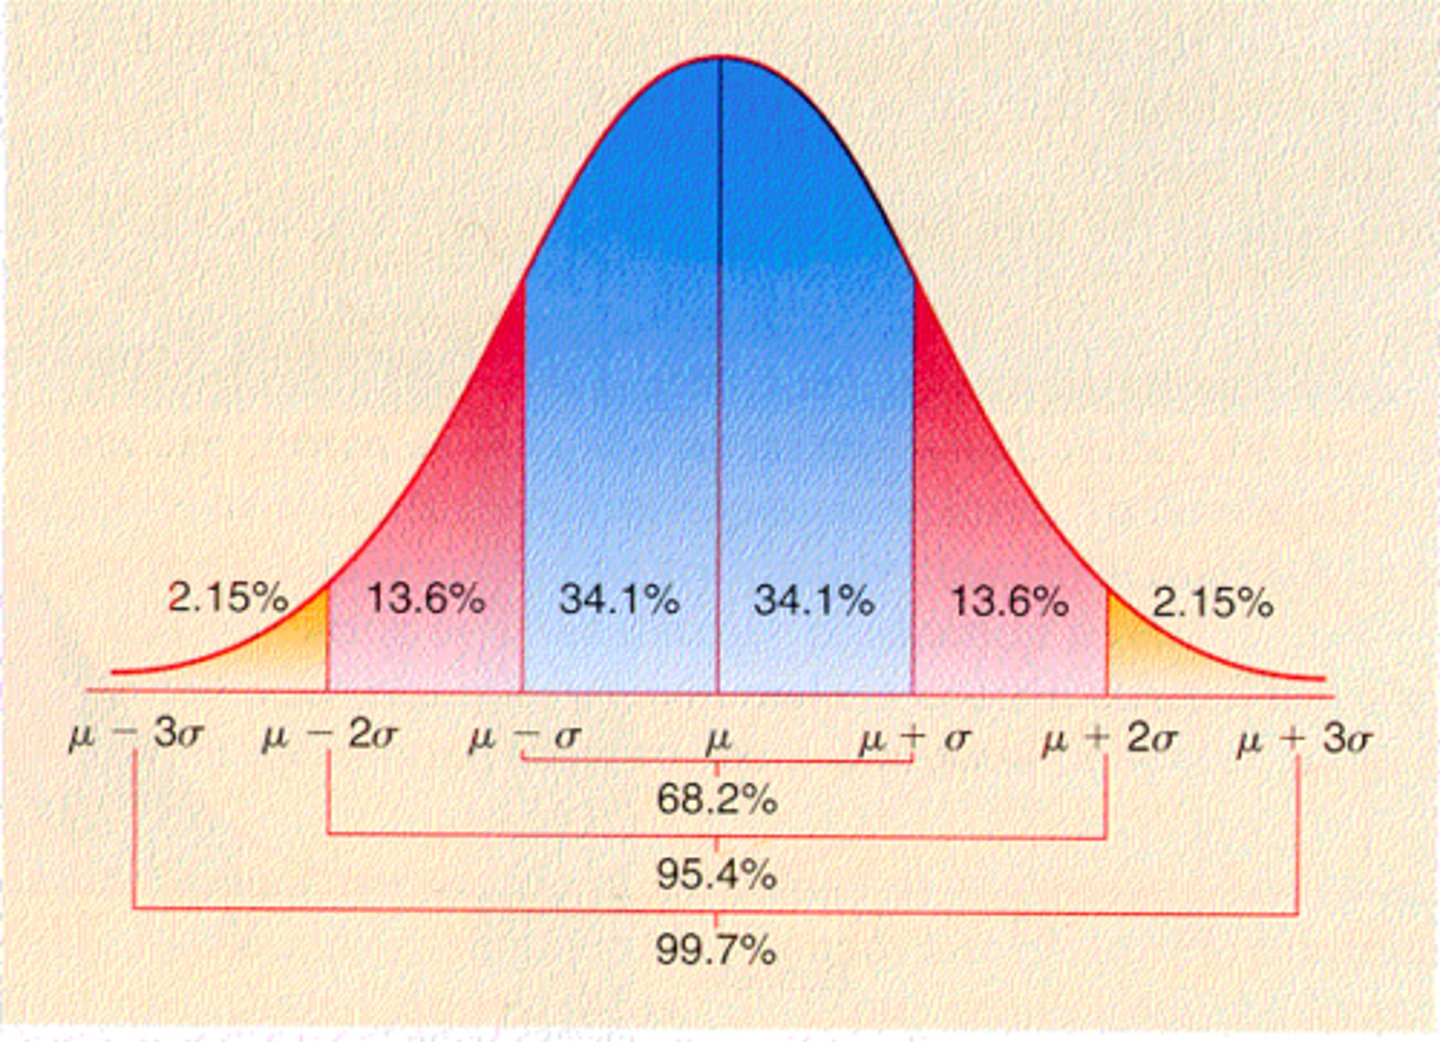
normal distribution
A function that represents the distribution of variables as a symmetrical bell-shaped graph.
population standard deviation symbol
σ
population mean symbol
μ
sample mean symbol
x̅
sample standard deviation symbol
SD or Sx
how to bias-correct stats
n-1 in denominator
descriptive vs. inferential statistics
-Descriptive statistics use numbers to describe data collected from your sample
-Inferential statistics estimate what the “population” is like, using your sample data.