AP Stat Unit 1 Vocab (copy)
1/27
Earn XP
Name | Mastery | Learn | Test | Matching | Spaced | Call with Kai | Chat |
|---|
No analytics yet
Send a link to your students to track their progress
28 Terms
individual
an object described in a set of data; can be people, animals, or things
categorical variable
assigns labels that place each individual into a particular group
quantitive variable
takes number values that are counts or measures
discrete variable
a quantitative variable that takes a fixed set of possible values with gaps in between them (whole numbers)
continuous variable
a quantitative variable that can take any value in an interval on the number line
marginal relative frequency
percent or proportion of individuals that have a specific value for one categorical variable
joint relative frequency
percent or proportion of individuals that have a specific value for one categorical variable and a specific value for another categorical variable
conditional relative frequency
percent or proportion of individuals that have a specific value for one categorical variable among individuals who share the same value of another categorical variable
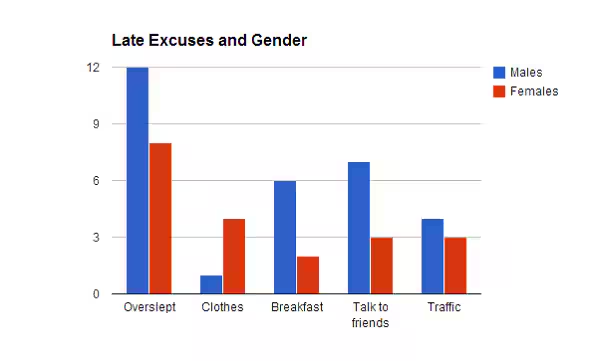
side-by-side bar graph (definition)
displays the distribution of a categorical variable for each value of another categorical variable; the bars are grouped together based on the values of one of the categorical values placed side by side
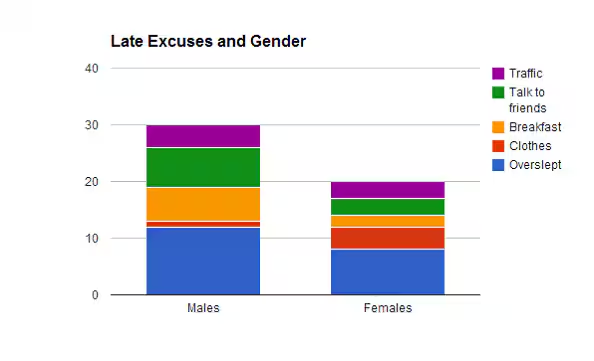
segmented bar graph (definition)
displays the distribution of a categorical variable as segments of a rectangle, with the area of each segment proportional to the percent of individuals in the corresponding category
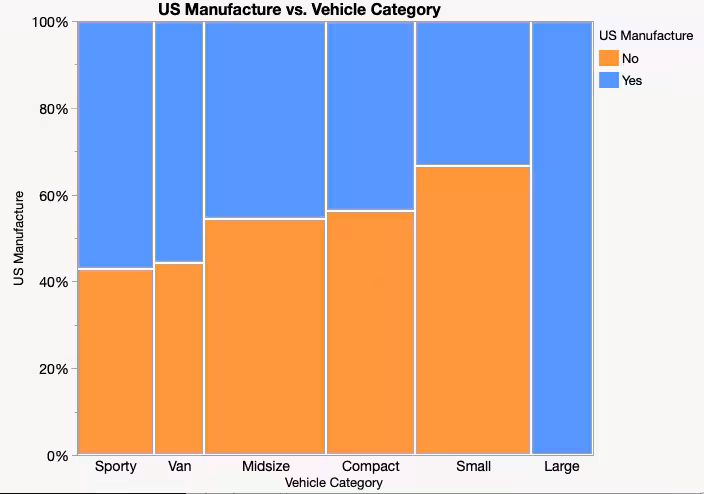
mosaic plot (definition)
a modified segmented bar graph in which the width of each rectangle is proportional to the number of individuals in the corresponding category
association
if knowing the value of one variable helps us predict the value of the other
outlier
individual value that falls outside the overall pattern of a distribution
statistic
number that describes some characteristic of a sample
parameter
number that describes some characteristic of a population
resistant
if a statistical measure is not sensitive to extreme values
standard deviation
measures the typical distance of the values in a distribution from the mean
quartiles
divide the ordered data set into four groups having roughly the same number of values
interquartile range
the distance between the first and third quartiles of a distribution
percentile
the value with p% of observations less than or equal to it
cumulative relative frequency graph
plots a point corresponding to the percentile of a given value in a distribution of quantitative data
standardized score (z-score)
tells how many standard deviations from the mean an observation falls, and in what direction
Normal distribution
described by a symmetric, single-peaked, bell-shaped density curve called a Normal curve
empirical rule
in a Normal distribution with mean μ and a standard deviation σ: approx. 68% of observations fall within σ or the mean μ; approx. 95% of observations fall within 2σ of the mean μ; approx. 99.7% of the observations fall within 3σ of the mean μ
standard Normal distribution
the Normal distribution with mean 0 and standard deviation 1
side-by-side bar graph (image)
segmented bar graph (image)
mosaic plot (image)