Algebra 2 Honors Unit test Unit 2-Mathematical Modeling
1/155
Earn XP
Description and Tags
Includes: Linear VS Exponential Growth Comparing Characteristics of Functions Transformations of Functions Modeling Functions Modeling Ftions using Finite Differences Regression Models Piecewise Defined Functions
Name | Mastery | Learn | Test | Matching | Spaced |
|---|
No study sessions yet.
156 Terms
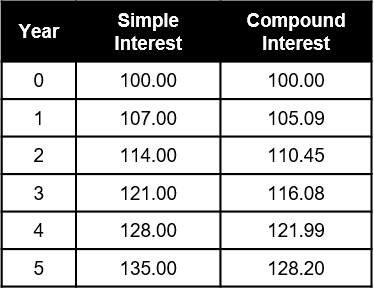
Beth has $100 to invest. She can invest this into a 7% simple interest account or into an account with 5% interest compounded quarterly. The table shows the amount that would be in each account over the first five years.
Which of the following statements are true about the growth shown in the table?
(A) The simple interest shows linear growth because it is adding a constant amount.
What means the same as 6 × 5?
6 + 6 + 6 + 6 + 6
What means the same as 65?
6 • 6 • 6 • 6 • 6
What means the same as 3 + 3 + 3 + 3?
3 × 4
What means the same as 2 • 2 • 2 • 2 • 2?
25
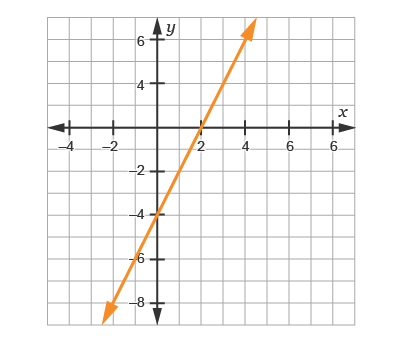
Identify the type of function graphed to the right.
For an increase of 1 in the x-value, what is the increase in the y-value
linear
2
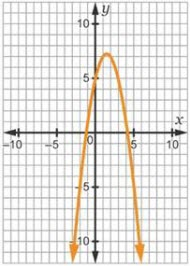
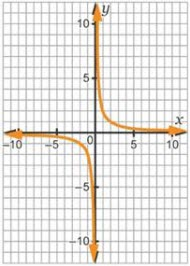
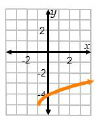
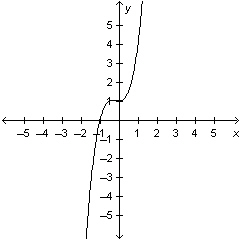
 Identify the type of function graphed to the right.
As x increases by 1 unit, what is the exponential growth factor?
Exponential
3

What is the missing number in the table?
Some of the graph is shown. The graph shows
If the pattern continued, what value of y would be associated with x = 6?
16
Linear Growth
y=24
Which of the following situations represent linear growth? Check all of the boxes that apply.
Martin’s savings account increases because he deposits $25 each week.
Each week, an athlete getting into shape loses 2 pounds.
Mei-Lin earns $9 an hour at her job.
Which of the following situations describe exponential growth? Check all of the boxes that apply.
The number of butterflies in an area increases by 10% per year.
Kristy bought a collector’s coin for $2.15 and its value increases at a rate of 3% per year.
The number of people who have heard a rumor increases because every person tells 2 other people.

Which growth pattern is represented in the table?
Linear

Which growth pattern is represented in the table?
Exponential
Elisa puts $1,000 into each of 2 bank accounts.
Account A: 3% interest rate, compounded annually, which is
Account B: $40 bonus added to the account each year, which is
Exponential
Linear
How much money will be in Account A at the end of 3 years?
How much money will be in Account B at the end of 3 years?
1092.73
1120
If Elisa keeps the money in both accounts for 3 years, which account will yield more?
Account B
If Elisa keeps the money in both accounts for 30 years, which account will yield more?
Account A
The graphs of y = 4x and y = 4x are shown below.
In general, how does the growth of y = 4x compare to the growth of y = 4x?
The function y = 4x is growing faster than y = 4x.
What kind of growth model (pattern) is shown in the table?
x | y |
1 | 5 |
2 | 25 |
3 | 125 |
4 | 625 |
5 | 3,125 |
exponential
Which of the following best describes how the y values are changing over each interval?
x | y |
1 | 4 |
2 | 8 |
3 | 12 |
4 | 16 |
5 | 20 |
They are increasing by 4 each time.
Margo is given the graph below.
What type of graph is shown, and what is the growth factor?
exponential function; growth factor of 4
The graph below shows two different deer populations over the same ten year period.
Deer Population
Which of the following answers is the best description for the deer population with the greatest growth rate:
The red line demonstrates an exponential growth rate, because the growth rate for the deer population is itself continuously increasing.
Which of the following best describes how the y values are changing over each interval?
x | y |
1 | 20 |
2 | 40 |
3 | 80 |
4 | 160 |
5 | 320 |
They are being multiplied by 2 each time.
Barry’s Bagel Emporium sells a dozen bagels for $5.00. This price is no longer high enough to create a profit. The owner decides to raise the price. He does not want to alarm his customers with too large of an increase. He is considering four different plans.
Plan A: Raise the price by $0.05 each week until the price reaches $8.00.
Plan B: Raise the price by 10 percent each week until the price reaches $8.00.
Plan C: Raise the price by the same amount each week for 6 weeks, so that in the sixth week the price is $8.00.
Plan D: Raise the price by $0.25 each week until the price reaches $8.00.
Which plan will result in the price of the bagels reaching $8.00 fastest?
Plan B
The table below represents a function.
x | 1 | 2 | 3 | 4 | 5 |
y | 6 | 12 | 18 | 24 | 30 |
Which statement would best describe the graph of the function?
The graph is a straight line that has a slope of 6.
Chen is given the graph below.
What type of graph is shown, and what is the growth factor?
linear function; growth factor of 4
Mary creates a table of values for a function and plots the points. She finds that the difference in the y values is the same. What kind of function did she graph?
linear
Linear

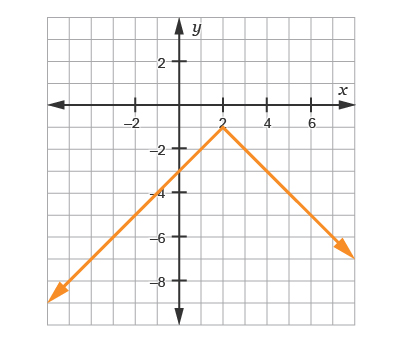
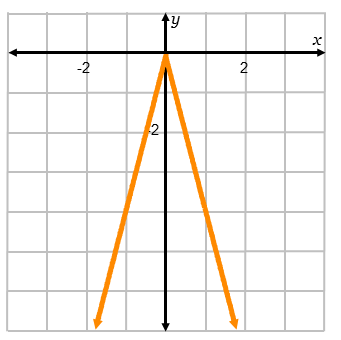
Compare the function given in the graph, f(x), with g(x) = |x| + 3. Which statements comparing the functions are true? Check all that apply.
f(x) has two x-intercepts while g(x) has none.
The domain of each function is all real numbers.
f(x) has the smallest minimum.
Which functions have a maximum value greater than the maximum of the function g(x) = –(x + 3)2 – 4? Check all that apply.
f(x) = –(x + 1)2 – 2
![]()
f(x) = –|2x| + 3
Which function has the smallest x-intercept value, if it exists?
![]()

Which statements comparing the functions are true? Check all that apply.
f(x) and h(x) have x-intercepts.
f(x), g(x), and h(x) have y-intercepts.
g(x) has the greatest maximum.
Which function has the greatest y-intercept?


Three functions are shown in the table on the left. Complete the sentences comparing the three functions.
f(x) g(x) ✔ h(x) has the greatest maximum.
X f(x)X g(x)✔ h(x) has the lowest minimum.
h(x) f(x) and g(x) ✔ f(x), g(x), and h(x) has/have both x- and y-intercepts.
Which function has the same minimum value as ![]() ?
?
f(x) = |x| + 3
Which graph shows a function whose domain and range exclude exactly one value?


The tables show linear functions representing the cost per hour to rent a bicycle and the cost per hour to rent in-line skates.
Bicycle per Hour

In-Line Skates per Hour

Which function has the greater slope and what does it represent?
The bicycle function has the greater slope, which shows that the cost per hour is greater than that of the in-line skates.
The table shows three unique functions.

Which statements can be used to compare the characteristics of the functions? Select two options.
g(x) has the greatest maximum value.
h(x) has a range of all negative numbers.
Which function has a domain and range that includes all real values?


![]()

The tables show functions representing the growth of two types of bacteria on certain days within an experiment that lasted a total of 10 days.

How do the functions in the table compare?
Since y-intercepts indicate the amount of each bacteria at the start of the experiment, there was more of bacteria B than bacteria A at the start.
Which function has the greatest x-intercept?
h(x) = 2x – 16
Which functions have a y-intercept that is greater than the y-intercept of the function g(x) = |x + 3| + 4? Check three options.
h(x) = –5 |x| + 10
![]()
![]()
The table shows three unique functions.

Which statements comparing the functions are true? Select three options.
Only f(x) and h(x) have x-intercepts.
The minimum of h(x) is less than the other minimums.
The maximum of g(x) is greater than the other maximums.
Two different functions are shown.
Function A:

Function B:

How do the x-intercepts of the two functions compare?
The distance between the x-intercepts in function A is twice the distance between the x-intercepts of function B.
Which function has a range limited to only negative numbers?


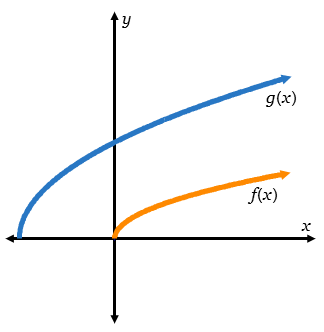
The graphs of three functions are shown.

Which statements accurately compare the functions on the graph? Select two options.
The square root and quadratic function share a y-intercept.
The range of the square root and absolute value function are the same.
The graphs of two functions are shown.

Which characteristics do the functions have in common? Select three options.
range
range
maximum
y-intercept
Look at the graph of the functions. Given the original function, ![]() , what is a possible equation for the translated function, g(x)?
, what is a possible equation for the translated function, g(x)?
![]()
Determine the parent function.
Identify the equation of the function.
![]()
![]()
How do you translate the graph of f(x) = x3 left 4 units and down 2 units? Identify the equation of the graph.
Identify the graph.
y = (x – 4)³ – 2✔
Describe the transformation f(x) = √x + 1 − 5 in words.
Identify the graph.
he parent function f(x) = √x has been shifted left 1 unit and down 5 units.
Given that f(x) is the original function, what is true about the transformation, g(x)?

g(x) is reflected about the x-axis.
What transformation(s) have been applied to function f(x) to get g(x)? Check all that apply.

translation
reflection
dilation
Which of the following is a vertical stretch of the parent function ![]() ?
?
![]()
Which of the following is a horizontal stretch of the same parent function?

Given the parent function ![]() , which of the following is true about this graph?
, which of the following is true about this graph?
The parent function was reflected.
The parent function was dilated.
Which graph is an example of a function whose parent function is ![]() ?
?
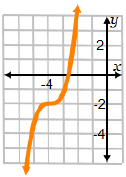
The graph below belongs to which function family?
absolute value
Which of the following is the graph of ![]() ?
?
Based on the family the graph below belongs to, which equation could represent the graph?
![]()
Which equation represents the transformed function below?
![]()
How is the graph of the parent quadratic function transformed to produce the graph of ![]() ?
?
The graph is compressed horizontally by a factor of 2, shifted left 3 units, reflected over the x-axis, and translated up 3 units.
To which family does the function ![]() belong?
belong?
square root
To which family does the function ![]() belong?
belong?
exponential
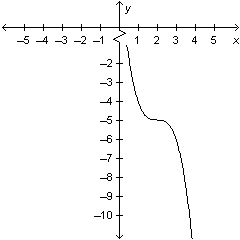
Which graph is an example of a cubic function?


The graph of ![]() is transformed as shown in the graph below. Which equation represents the transformed function?
is transformed as shown in the graph below. Which equation represents the transformed function?


Each place in a decimal number can be one of the digits 0 to 9. Each place in a binary number can only be 0 or 1. The table shows the number of digits needed to represent several decimal numbers as binary numbers. |
|
Which type of function best models the data in the table? |
Logarithmic

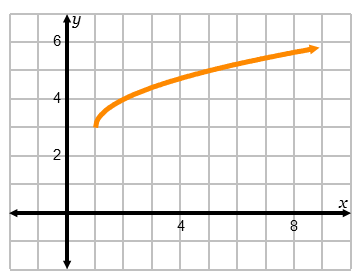
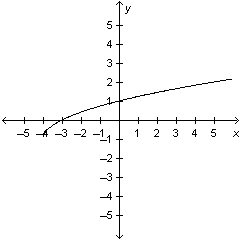
The graph shows the relationship between the length, x, in meters, of a pendulum and its period, y, in seconds. The period is the amount of time it takes the pendulum to swing forward and back. |
|
Which type of function best models the data in the graph? |
Square Root

A bottle of water is placed in a freezer. The table shows how the approximate temperature of the bottle changes over time. What type of function best models the data in the graph?
Which exponential equation best models the data in the graph?
Exponential
|

What type of function best models the data in the graph?
Which quadratic equation best models the data in the graph?
Quadratic
y = 0.433x2

Which function best models the data in the table?
Use the function to predict the minimum target heart rate for a person 20 years old.
![]() 120BPM
120BPM

Which function best models the data in the graph?
The fulcrum of a lever is the point on which it turns. Based on the function, how many pounds of force are needed to lift the rock if the distance from the fulcrum is 6 feet?
Which function best models the data in the graph?
![]() 10 pounds of force
10 pounds of force
em

Which function best models the data in the graph?
The horizontal reach of a fire hose is the distance the hose can spray water horizontally. Based on the function, about what is the minimum water pressure the fire hose needs to have a horizontal reach of 100 feet?
|
96 lb/in

Which function best models the data in the graph?
y = 10.1x + 101

Kirk made the graph to show his prediction of a population of bacteria over time. Which function best models the data in the graph?
![]()
Tasha invests $5,000 at 6% annual interest and an additional $5,000 at 8% annual interest. Thomas invests $10,000 at 7% annual interest. Which statement accurately compares Tasha’s and Thomas’s investments if interest is compounded annually?
Compound interest formula: 
t = years since initial deposit
n = number of times compounded per year
r = annual interest rate (as a decimal)
P = initial (principal) investment
V(t) = value of investment after t years
Tasha’s investment will yield more over many years because the amount invested at 8% causes the overall total to increase faster.
The distance it takes a car to come to a complete stop after the brakes are applied is related to the speed that the car is traveling. The stopping distances and speeds are shown in the table below.
Stopping Distance of a Car vs. Speed | |
Stopping Distance, d (in feet) | Speed, s (in miles per hour) |
20 | 17.89 |
40 | 25.30 |
60 | 30.98 |
80 | 35.78 |
100 | 40.00 |
Which equation best represents the data in the table?
![]()
anis was offered two different jobs when she graduated from college. She made the graph and table to show how much she would earn over time at each job.
Earnings over Time for Job 1 | Earnings over Time for Job 2 |
|
|


When will Janis’s salary be the same for job 1 and job 2, and how much will she be earning at that point?
The salaries will be the same in year 20, and she will be earning $80,000.
The height of an object after it is released can be modeled by the function ![]() , where t is the number of seconds after the object is released, v is the upward speed in feet per second at release, and s is the starting height in feet. If a quarterback throws a ball from his hand 6 feet in the air at an upward speed of 25 feet per second, how much time does his teammate have to catch the ball?
, where t is the number of seconds after the object is released, v is the upward speed in feet per second at release, and s is the starting height in feet. If a quarterback throws a ball from his hand 6 feet in the air at an upward speed of 25 feet per second, how much time does his teammate have to catch the ball?
about 1.77 seconds
The amount of water pressure exerted on a scuba diver varies with depth. The graph below shows the relationship between pressure, p, in atmospheres, and depth, d, in ft.
Depth of Water and Water Pressure
Based on the information in the graph, what is the water pressure at sea level?
1 atm
The graph below represents the path of a grasshopper as it jumps.
Which type of function models the data on the graph?
Quadratic
A science teacher wrote the table of values below.
Amount of Hydrogen vs. pH
Amount of Hydrogen, x | pH, f(x) |
| 1 |
| 2 |
| 3 |
| 4 |
| 5 |
Which function models the data in the table?
![]() ,
, ![]()
Kareem wants to write an equation for the data in the table below.
x | y |
–3 |
|
–2 |
|
|
|
0 | 1 |
What is the general form of the equation Kareem can use to represent the data?
![]()
A new car sells for $25,000. The value of the car decreases by 15% each year. What is the approximate value of the car 5 years after it is purchased?
 , or approximately $11,093
A rectangle with constant area has possible lengths and widths as shown in the table below.
Width vs. Length of a Rectangle
Width (w) | Length (l) |
2 | 37.5 |
4 | 18.75 |
6 | 12.5 |
8 | 9.375 |
Which equation can be used to find any corresponding length and width that fit the pattern in this table?
![]() , where l is the length, w is the width, and k is a constant (
, where l is the length, w is the width, and k is a constant (![]() )
)
The table shows the circumference of a tree in centimeters, y, for x years.

Which descriptions are true of the function shown in the table? Check all that apply.
Linear
y = 3.2x
What type of function is represented in the table?

Quadratic
The table shows the height in feet, y, of a pebble dropped from a tall bridge after x seconds.
 Which descriptions are true of the function shown in the table? Check all that apply.
Quadratic
y = –16x2 + 150
What type of function is represented in the table?

Linear
The table shows the cost in dollars, y, of renting a bicycle at a park for x hours.

Which descriptions are true of the function shown in the table? Check all that apply.
Linear
y = 5x + 10
The table shows some of the values of a function of the form y = ax2 + bx + c. Which is the value of c, the constant, for the function?

8

Look at the hexagonal numbers. Use finite differences to determine which function represents the pattern.
f(x) = 2x2 – x
Choose the function that represents the data in the table.

f(x) = 200x – 7
Sofia throws a rock straight up. The table shows the height of the rock in meters, y, at x seconds.

What type of function is represented?
quadratic
What type of function is represented in the table?

Quadratic
John is standing on a bridge when he accidentally drops his toy over the railing. The table shows the height in feet, f(t), of the toy at t seconds.
![]()
Choose the function that represents the data.
f(x) = −16x2 + 200
Jeremy’s family wants to rent bicycles. The table shows the cost in dollars, y, of renting a bicycle for x hours.

What type of function is represented?
Linear
What type of function is represented in the table?

Linear
Look at this image.

What type of function is represented in a pentagonal number pattern?
quadratic
The table shows some values of a function of the form y = ax2 + bx + c.
The value of c, the constant of the function, is
5
What type of function is represented in the table?

Linear
What type of function is represented in the table?

Linear