Savings, Capital Formation and Financial Markets
1/74
There's no tags or description
Looks like no tags are added yet.
Name | Mastery | Learn | Test | Matching | Spaced | Call with Kai |
|---|
No analytics yet
Send a link to your students to track their progress
75 Terms
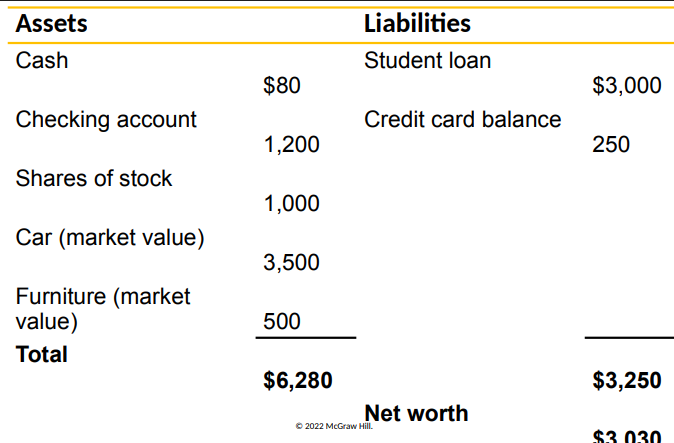
Balance Sheet
a list of an economic unit’s assets and liabilities
Specific date
Economic unit (business, household, etc.)
Saving Formula
current income - spending on current needs
Saving Rate
saving / income
Wealth
value of assets - liabilities
Assets
anything of value that one owns
Liabilities
the debts one owes
Flow Values
Defined per unit of time
Dynamic movement of goods, services, or money over time and measured as a rate
Income
Spending
Saving
Wage
Help to explain changes in the economy over time
What does the Flow of Savings do?
Causes the stock of wealth to change
Stock Value
Defined at a specific point in time and is static
Wealth
Debt
Investment / Saving Flow
Provide a snapshot of the current state of the economy
Capital Gains
increase the value of existing assets
Higher value for stock
Higher housing values
Selling price higher than purchase price
taxed at a lower rate than ordinary income to incentivize investment and stimulate economic growth
Capital Losses
decrease the value of existing assets
e.g. selling an asset at a price that is lower than its purchase price
Change in Wealth Formula
saving + capital gains - capital losses
Reasons for Household Saving
Life-Cycle Saving
Precautionary Saving
Bequest Saving
Wealth Accumulation:
Consumption Smoothing
Life-Cycle Saving
to meet long term objectives - expenditures
e.g. retirement, home purchase, children’s college, healthcare costs
Precautionary Saving
for protections against setbacks and income fluctuations
e.g. loss of job, medical emergency
Bequest Saving
to leave an inheritance
mainly for higher income groups
Wealth Accumulation
Wealth can be used to purchase assets, such as a home or a business, that generate income or appreciate in value over time
Consumption Smoothing
People save to smooth out their consumption over their lifetime. By saving during periods of high income and consuming during periods of low income, individuals can maintain a relatively stable standard of living throughout their lifetime
Why do People Save when they are Younger?
they have relatively low incomes and then are able to consume when they are older and have higher incomes
Savings
Often take the form of financial assets that pay a return
Examples of Savings
Interest-bearing checking
Bonds
Savings
Mutual funds
Stocks
Real Interest Rate Formula
r = i - π
RIR = nominal interest rate - rate of inflation
What is the Real Interest Rate?
the increase in purchasing power from a financial asset
marginal benefit of the extra saving
Explaining US Household Savings Rate
May be depressed by
Social Security, Medicare, and other government programs for the elderly
Mortgages with small or no down payment
Confidence in a prosperous future
Increasing value of stocks and growing home values
Readily available home equity loans
Demonstration effects and status goods
Low interest rates
Formula for Aggregate Income/Expenditures
Y = C + I + G + NX
Y = aggregate income or expenditures
C = consumption expenditure
G = government purchases of goods and services
I = investment spending
NX = net exports
Calculating National Savings
Assume NX = 0 for simplicity
National savings (S) is current income less spending on current needs
Current income is GDP or Y
Spending on current needs
Exclude all investment spending (I)
Most consumption (C) and government spending (G) is for current needs
For simplicity, we assume all of C and all of G are for current needs
S = Y - C - G
Net Taxes Formula
taxes - transfers - government interest payments
Private Saving Formula
SPRIVATE = Y - T - C
Y = households total income
T = net taxes
C = consumption expenditure
Private Saving
Household plus business saving
Household's total income is Y
Households pay taxes (T) from this income
Government transfer payments
Interest is paid to government bond holders
After-tax income less consumption
Done by households and businesses
Transfer Payments
made by the government to households without receiving any goods in return
increase household income
Household/Personal Saving
done by families and individuals
Business Saving
makes up the majority of private saving in the US
Revenues - Operating Costs - Dividends to Shareholders
can purchase new capital equipment
Public Saving
the amount of the public sector’s income that isn’t spent on current needs
income is net taxes
spending on current needs is G (government spending)
Public Saving Formula
SPUBLIC = T – G
T = net taxes
G = government spending
National Saving Formula
private savings + public savings
SPRIVATE + SPUBLIC = (Y – T – C) + (T – G)
S = Y – C – G
Balanced Government Budget
occurs when government spending = net tax receipts
Government Budget Surplus
the excess of government net tax collections over spending
(T - G)
pubic savings
Government Budget Deficit
the excess of government spending over net tax collections
(G - T)
public dissavings
What does National Savings determine?
a country’s ability to invest in new capital goods
National Saving
the source of funding for investment
Investment
the creation of new capital goods and housing - necessary to increase average labour productivity
When is Investment Spending undertaken?
if it is expected to be profitable
i.e., the benefit, or value of marginal product, exceeds the cost of the investment
Why do Firms buy new Capital?
to increase profits
cost-benefit principle
cost = cost of using the machine/other capital
benefit = value of the marginal product of the capital
What factors affect the Value of the Marginal Product (VMP) of capital?
Net of operating and maintenance expenses and of taxes on revenues generated
Technical innovation increases benefits
Lower taxes increase benefits
Higher price of the output increases benefits
Influenced by the relative price of the good or service produced by the capital
Rate of Return of an Investment Formula
= VMP / PK
VMP = value of marginal product
PK = price of investment
if VMP / PK > r the investment is profitable
where r = the real interest rate
What are financial Intermediaries?
firms that extend credit to borrowers using funds raised from savers e.g. banks
How do Banks help Savers?
by evaluating the quality of potential borrowers and directing savings towards higher-return investments
provide information about the possible uses of their funds
help share risks by pooling funds for investment projects, enabling risk sharing
Why is Risk Sharing Important in Banking?
makes funding possible for risky but potentially very productive projects
Principle of Comparative Advantage in Banking
banks specialise in evaluating borrowers more efficiently and cost-effectively than individuals
How do Banks reduce the cost of evaluating Investment opportunities?
thorough specialisation and pooling of resources which allows them to make large loans and spread out risks
Bond
a legal promise to pay someone a debt, usually including both the principal amount and regular interest payments
Principal Amount
the amount originally lent
Coupon Rate
the interest rate promised when the bond is issued
Coupon Payments
regular interest payments made to the bondholder
A Share of a Stock
a claim to partial ownership of a firm
receive dividends, a periodic payment determined by management
receive capital gains if the price of it increases
What are Share and Bond Markets?
help ensure savings are devoted to the most productive users
they gather information about prospective borrowers, and help savers share the risks of lending, provide information on investment projects and their risks, and provide risk sharing and diversification across projects
channel funds from savers to borrowers by facilitating the sale of new bonds/stock to finance capital investment
What is Diversification in the context of Investment?
spreading one’s wealth over a variety of investments to reduce risk
Benefits of Diversification Example
Vikram has $1,000 to invest in stocks
Put all in one stock
50% chance of 10% gain and 50% chance of zero
Diversify and put half in each
One stock will gain 0% and the other gain 10%
Return is 5% with no risk

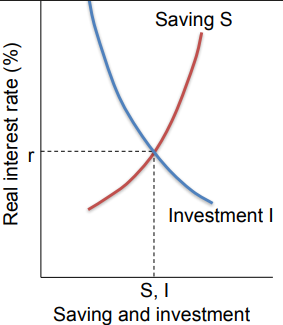
Supply of Savings (S)
The amount of savings that would occur at each possible real interest rate (r)
The quantity supplied increases as r increasest
Demand for Investment (I)
The amount of savings borrowed at each possible real interest rate
The quantity demanded is inversely related to r
Equilibrium Interest Rate
equates the amount of saving with the investment funds demanded
If r is above equilibrium, there is a surplus of savings
If r is below equilibrium, there is a shortage of savings
Financial Markets
Adjust to surpluses and shortages as any other market does
Equilibrium Principle holds
Changes in factors other than real interest rates will shift the savings or investment curves
New equilibrium
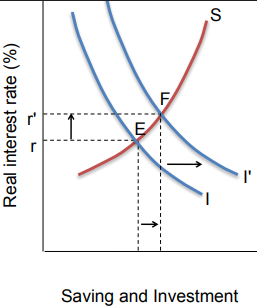
What happens when New Technology raises Marginal Productivity of Capital?
Increases the demand for investment funds
Movement up the savings supply curve
Higher marginal product of capital makes firms more eager to invest
Investors race for new technologies
Higher interest rate (as in the U.S. during the 90s)
Higher level of savings and investment
High rate of investment reflecting opportunities created by new technologies
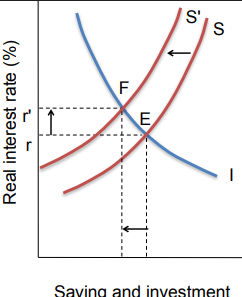
Government Budget Deficit Increases
Reduces national saving
Government has dipped further into the pool of private savings to borrow funds to finance deficit
Investors compete for a smaller quantity of available saving
Movement up the investment curve
Higher interest rate
Investments less attractive
Lower level of savings and investment
Private investment is crowded out
Benefits of increased National Saving Rates according to Policymakers
Reducing government budget deficit would increase national saving
Political problems
Increase incentives for households
Federal consumption tax
Reduce taxes on dividends and investment income
What does higher National Saving Rate lead to?
greater investment in new capital goods and a higher standard of living
Austerity
fiscal policy
cutting government spending to reduce deficits
often arrives too late
Stimulus
fiscal policy
increasing spending to boost demand during downtimes
political difficulty in enforcing during good times
When did Keynes support Stimulus and Austerity?
stimulus in recessions
austerity during booms
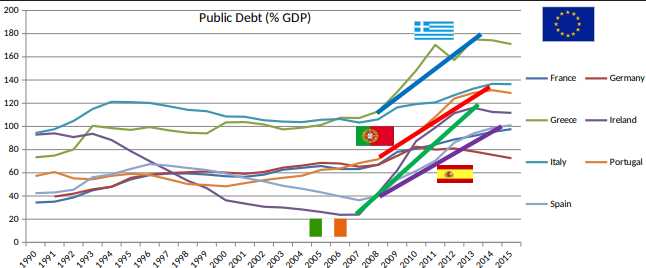
Eurozone Debt Crisis
With austerity, debt/GDP ratios continued to rise sharply: Declining GDP outweighed progress on reduction of budget deficits
What happened when a Government borrows?
it issues debt in the form of bonds
Purchasers of Government Bonds Include:
pension funds
insurance companies
overseas investors
Yield on a Bond
the interest rate paid on state borrowing
Arguments in Favour of Austerity
Reducing debt in long-run interests of economy – helps to keep U.K. taxes lower
Shrinking state encourages private sector growth
High opportunity cost from billions on debt interest
Cutting deficits increases investor confidence
Upturn of cycle is time for government to borrow less – ahead of another downturn
Some economists argued that the UK government austerity programme had resulted in growth that was higher than the European average and that the UK's economic performance had been much stronger than the International Monetary Fund had predicted
Austerity can be expansionary in situations where government reduction in spending is offset by greater increases in aggregate demand
Arguments Against Austerity
Austerity is self-defeating if it leads to deflation
Government bond yields are low – a time to invest more
Infrastructure investment will increase aggregate demand
Wrong to cut spending when economy is in a zero interest rate environment – liquidity trap
Economic growth is needed to pay back the debt and fiscal austerity makes this harder to achieve
Keynesian macroeconomists argued that the austerity programme pursued by the Coalition Government in its first two years was both too severe and unnecessary and set back the economic recovery which was underway in the first half of 2010