Chapter 5: Comparing Two Proportions
1/14
There's no tags or description
Looks like no tags are added yet.
Name | Mastery | Learn | Test | Matching | Spaced | Call with Kai |
|---|
No study sessions yet.
15 Terms
What are two-sample problems?
Two-sample problems involve comparing two populations or treatments. The goal is to compare responses or characteristics from separate samples.
What are the key target parameters for comparing two populations?
Key parameters include mean difference (μ1 - μ2),
variance ratio (σ1²/σ2²),
difference between proportions (π1 - π2), and
relative risk (π1/π2).
What are conditional proportions?
Conditional proportions represent the probability of an event occurring within a specific category of a dataset, used to compare success rates.
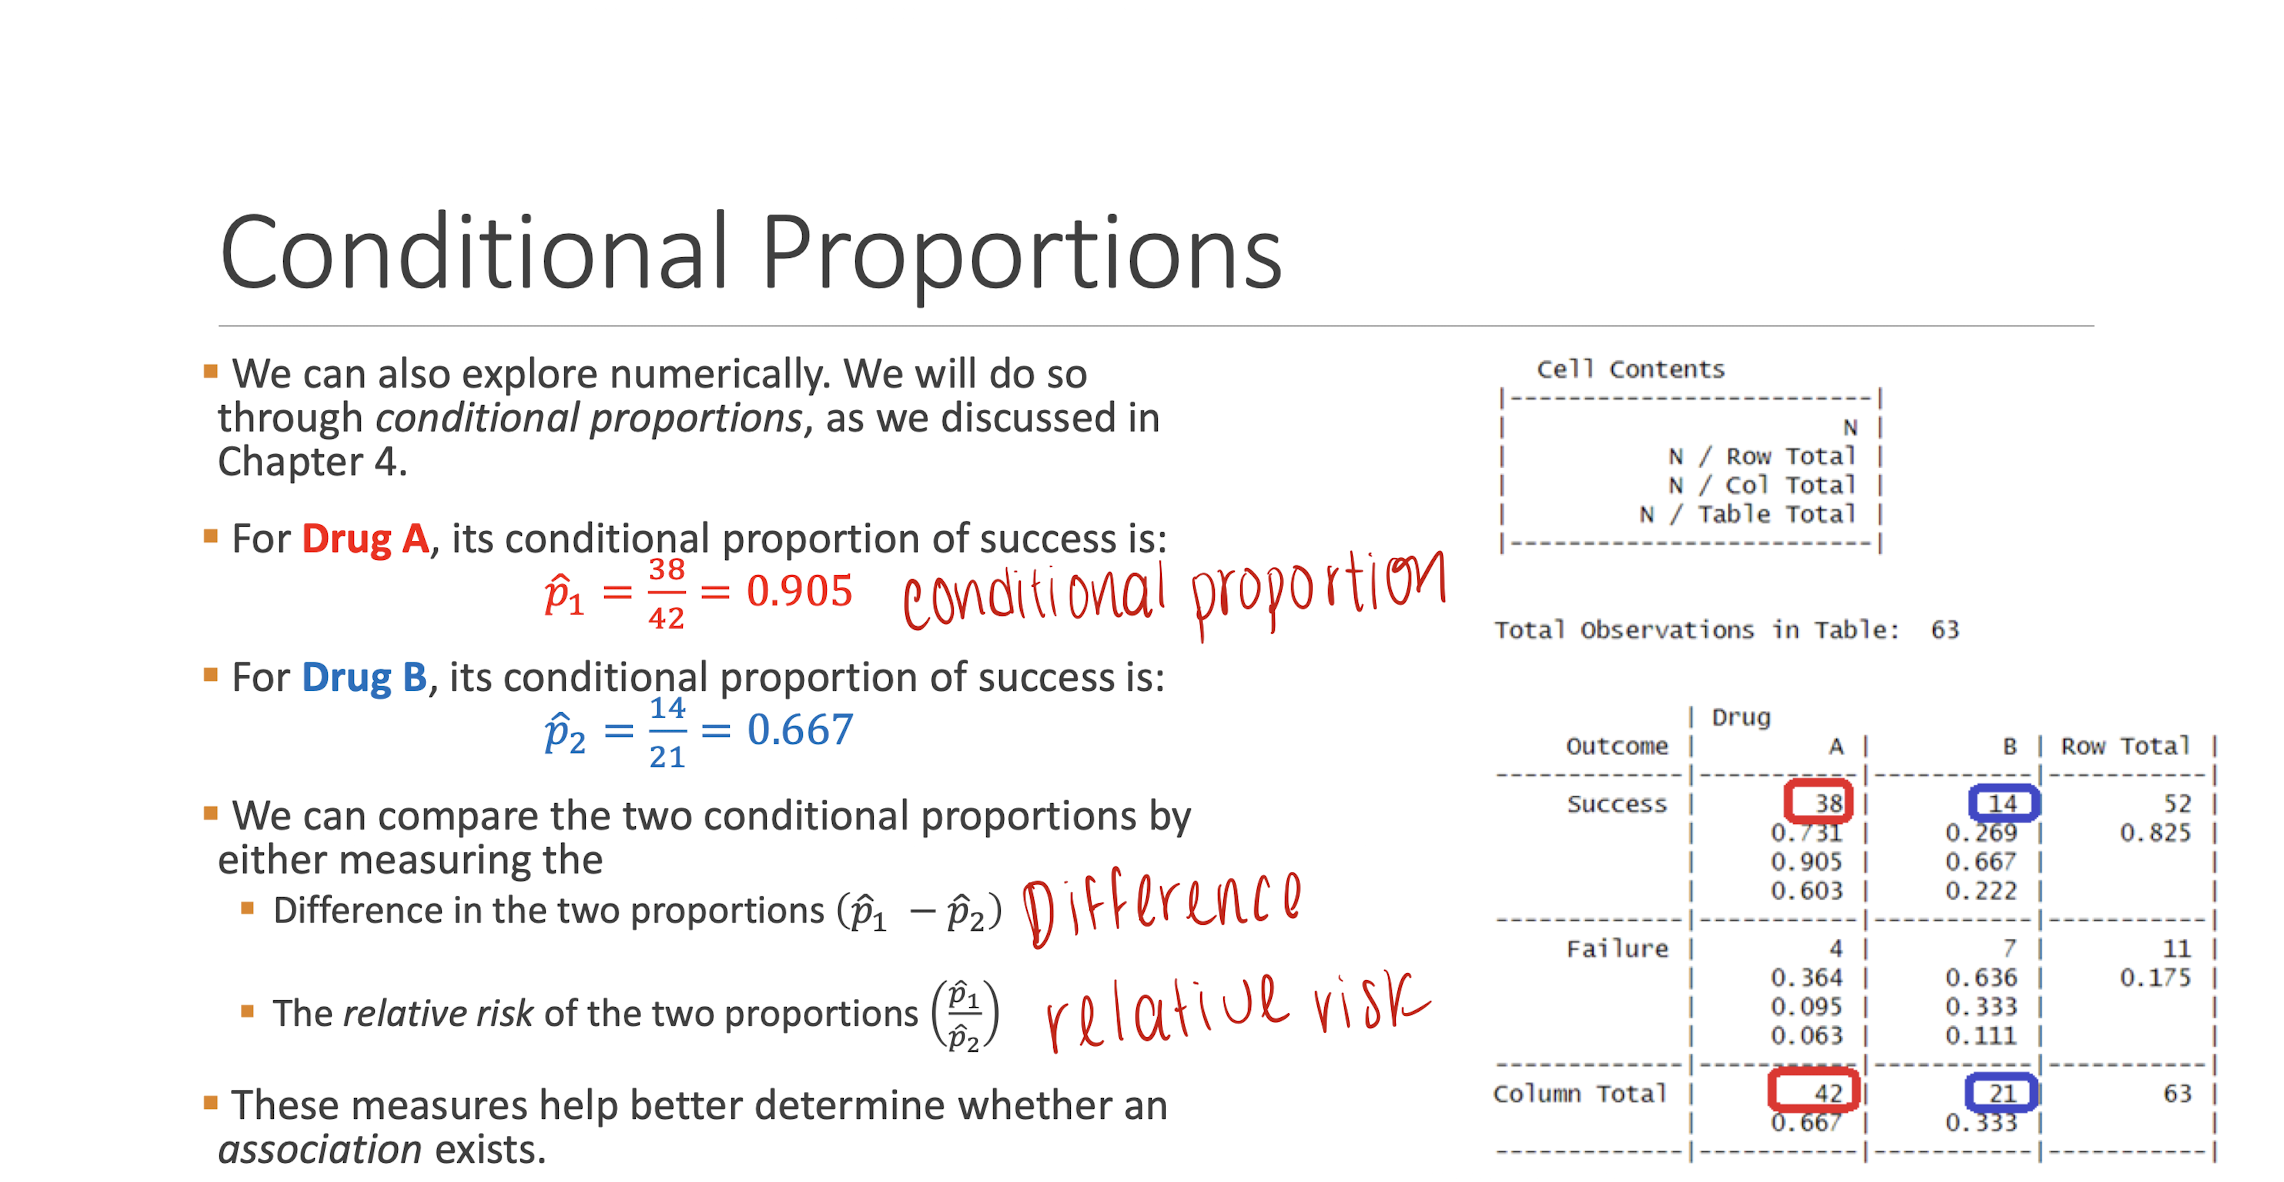
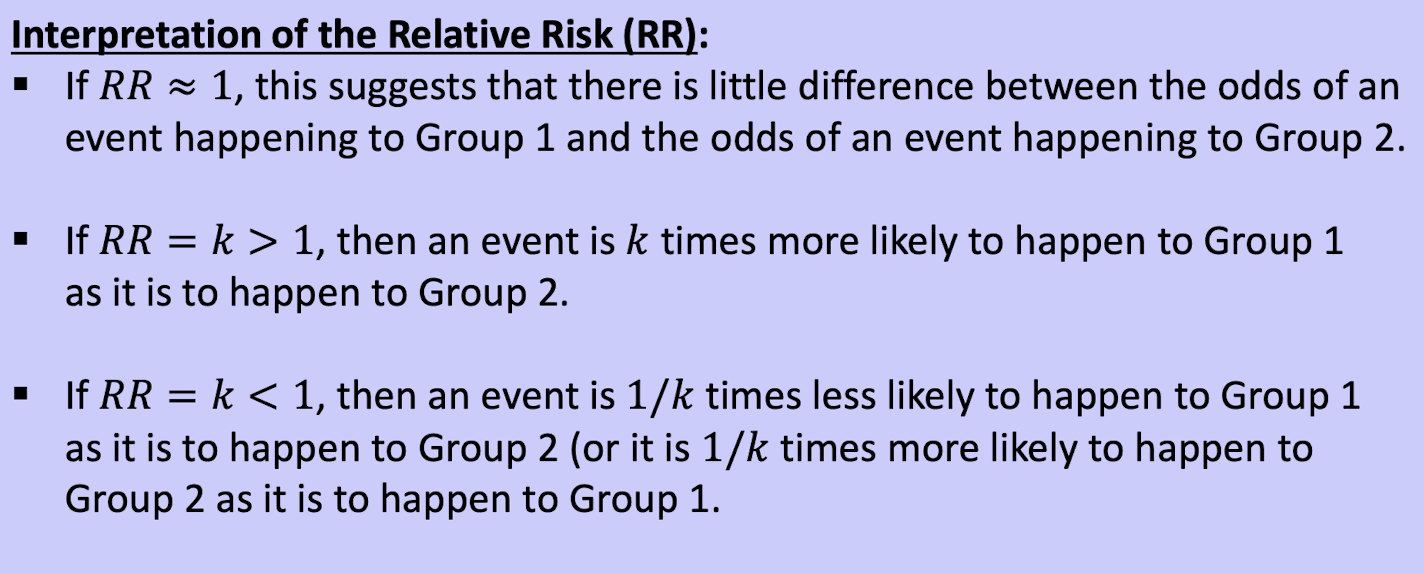
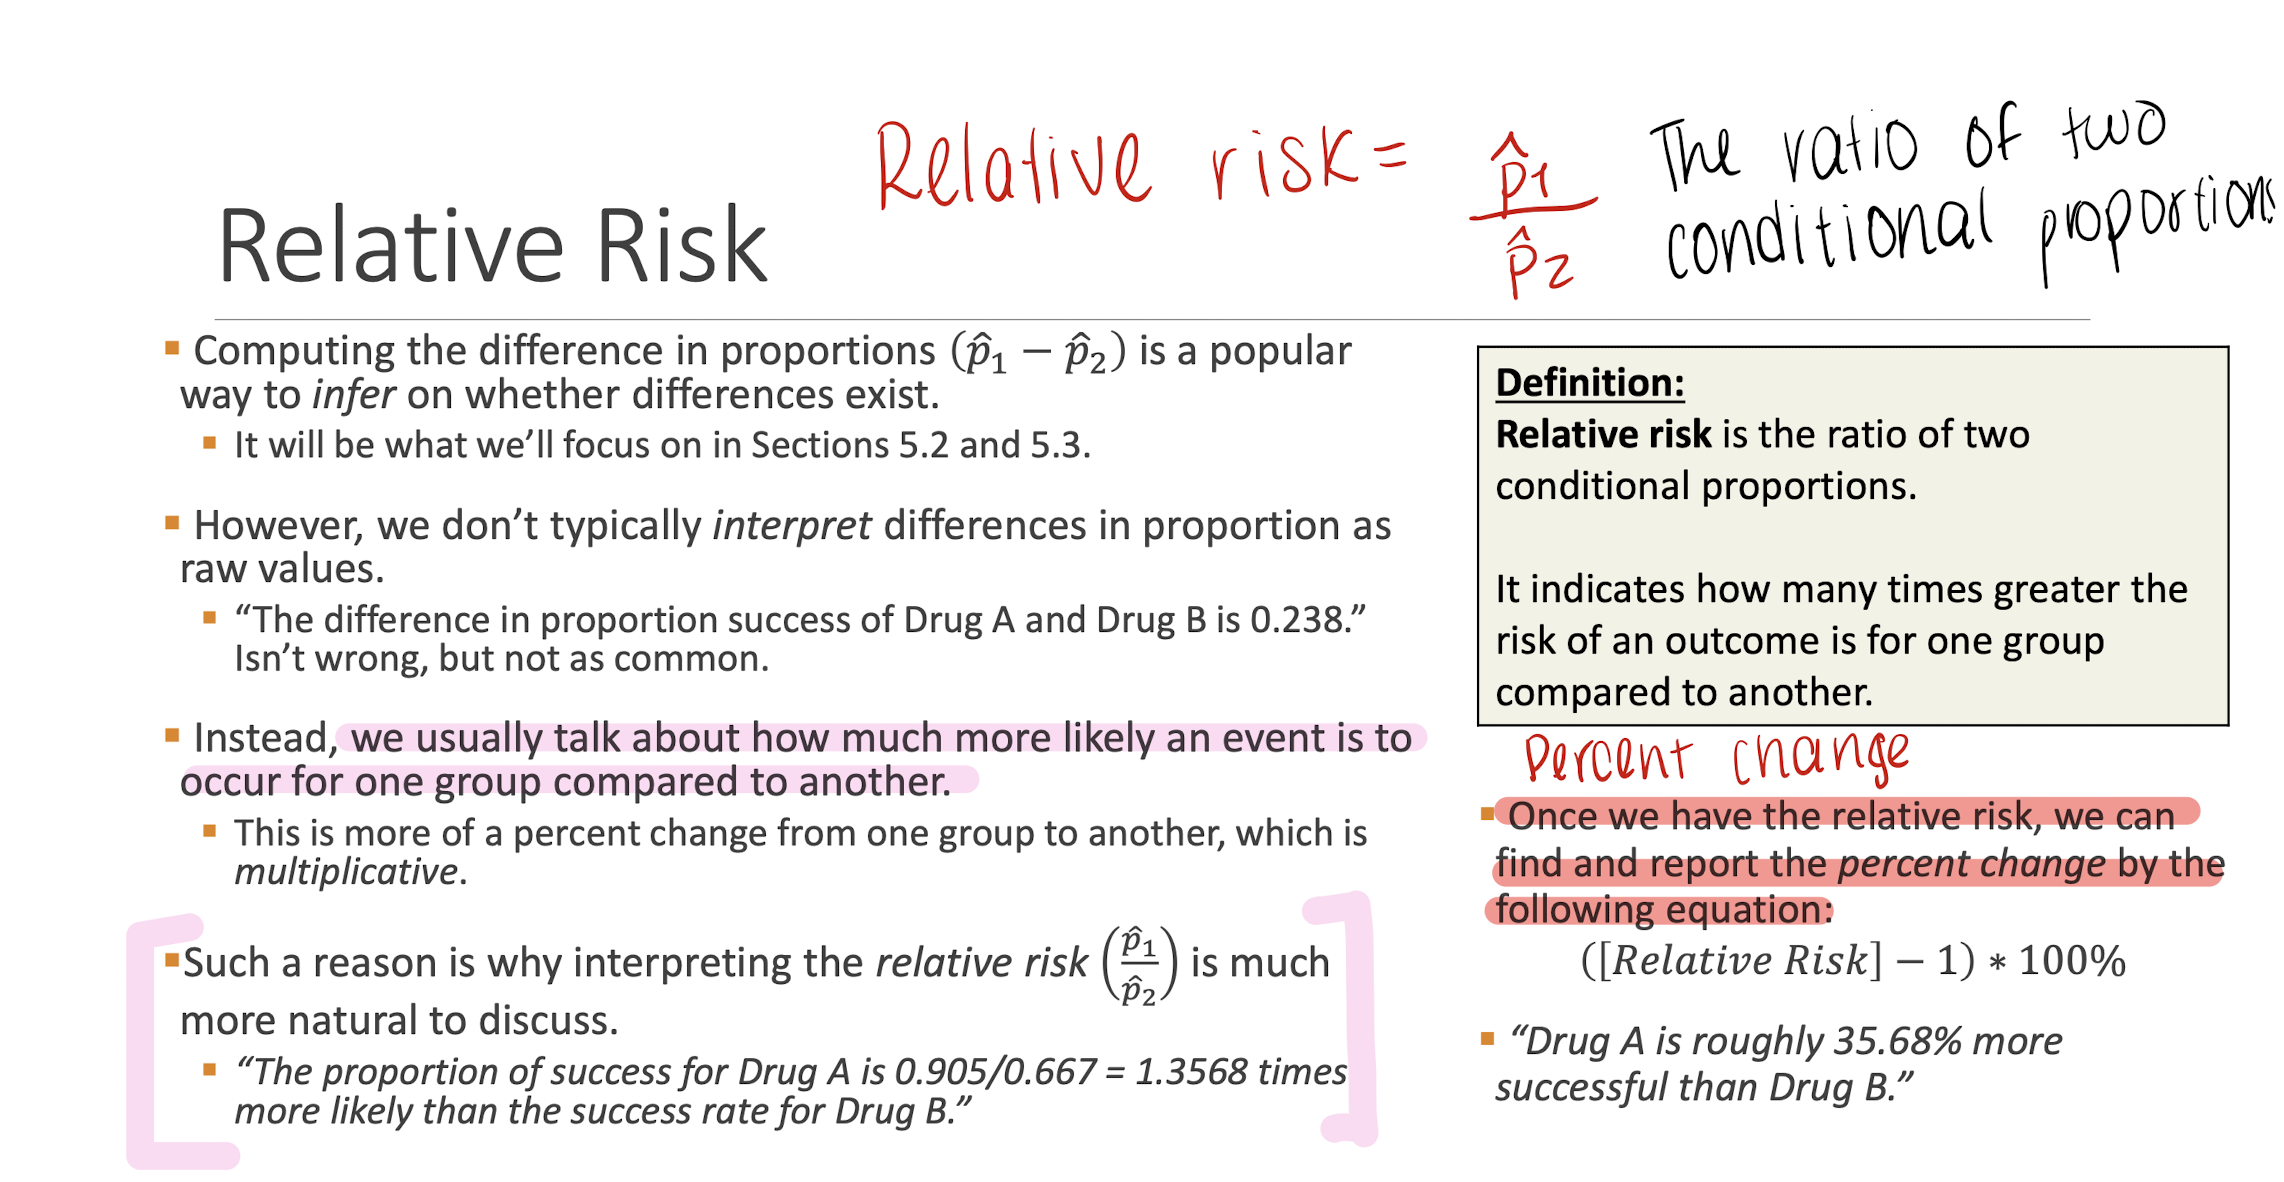
How is relative risk calculated?
What is the purpose of comparing two proportions via simulation?
The purpose is to determine if there is statistical evidence suggesting a difference between two proportions using a hypothesis test.
What are the types of hypothesis tests for comparing proportions?
Right-sided test (H₀: π1 = π2 vs. Hₐ: π1 > π2),
Left-sided test (H₀: π1 = π2 vs. Hₐ: π1 < π2),
Two-sided test (H₀: π1 = π2 vs. Hₐ: π1 ≠ π2).
How is simulation used to test hypothesis for two proportions?
Simulation involves shuffling data and observing random distributions to compare the observed proportion difference against the simulated distribution.
What are the key steps in hypothesis testing via simulation?
1. State hypotheses,
2. Compute observed statistic,
3. Simulate data,
4. Compute p-value,
5. Conclusions
Interpret results.
How is the 2SD method used for confidence intervals
The 2SD method estimates a 95% confidence interval using the formula: Observed Difference ± 2 × Standard Deviation.
Why do we use theoretical approaches instead of simulation for large samples?
Simulation becomes inefficient for large samples, whereas theoretical methods approximate results using normal distributions.
What is the sampling distribution of the difference in proportions?
It follows a normal distribution with mean (π1 - π2) and standard deviation √[(π1(1-π1)/n1) + (π2(1-π2)/n2)].
![<p>It follows a normal distribution with mean (π1 - π2) and standard deviation √[(π1(1-π1)/n1) + (π2(1-π2)/n2)].</p>](https://knowt-user-attachments.s3.amazonaws.com/89e203d5-a2a9-4542-b38f-38b4a8733cdc.png)
What are the assumptions for large-sample confidence intervals for π1 - π2?
1. Independent random samples,
2. Sample sizes large enough (at least 10 successes and 10 failures per sample).
What is the test statistic for hypothesis testing of two proportions?
Z = (p̂1 - p̂2) / √[(p̂1(1 - p̂1)/n1) + (p̂2(1 - p̂2)/n2)].
![<p>Z = (p̂1 - p̂2) / √[(p̂1(1 - p̂1)/n1) + (p̂2(1 - p̂2)/n2)].</p>](https://knowt-user-attachments.s3.amazonaws.com/7f6c0566-cd60-4a8b-b27e-2a5a69c76b2f.png)
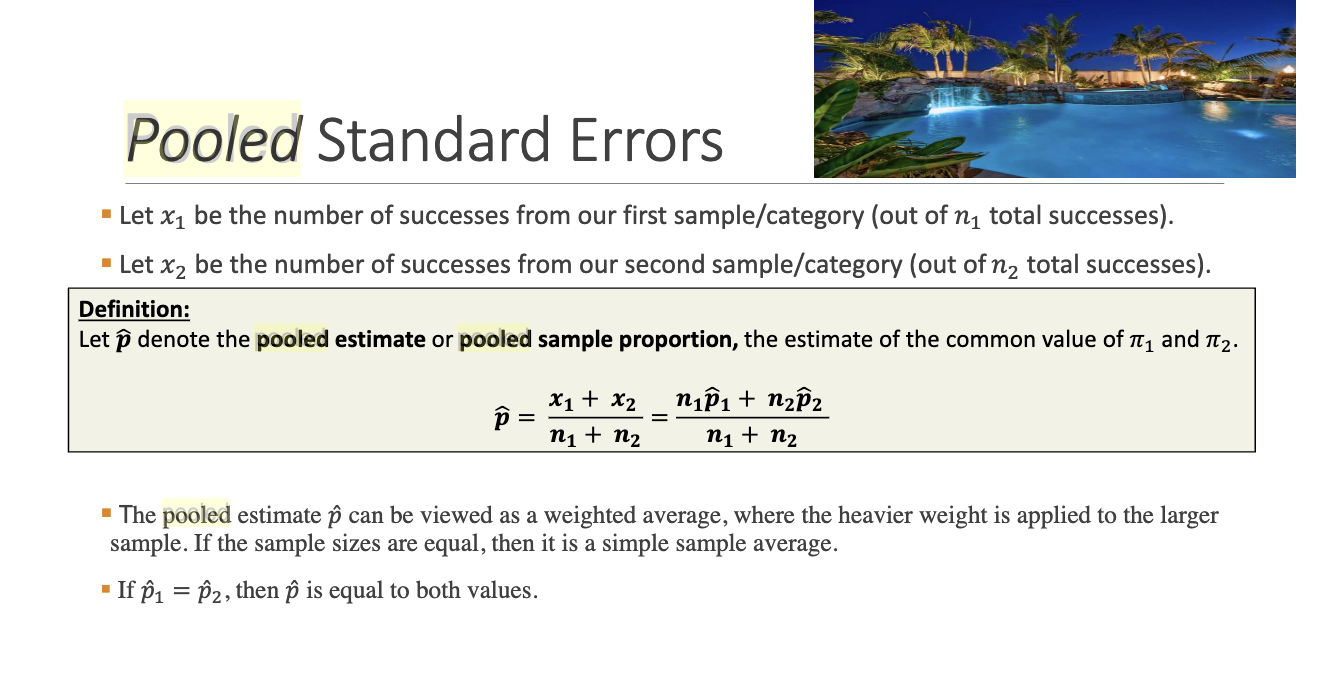
What is a pooled standard error in hypothesis testing?
The pooled standard error is a weighted average of sample proportions, assuming π1 = π2 under the null hypothesis.
How is relative risk interpreted?