Curves
1/15
There's no tags or description
Looks like no tags are added yet.
Name | Mastery | Learn | Test | Matching | Spaced |
|---|
No study sessions yet.
16 Terms
Lorenz curve
measures inequality based on I/W distribution in a population
Gini index
measures inequality sum of
PC
RS btw inflation, growth/U for a given actual inflation expectation
Cobb douglass production function
Same L, ∆tech = >Y
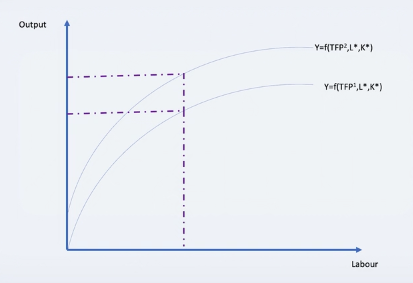
Cobb douglass production function

Unemployment graph
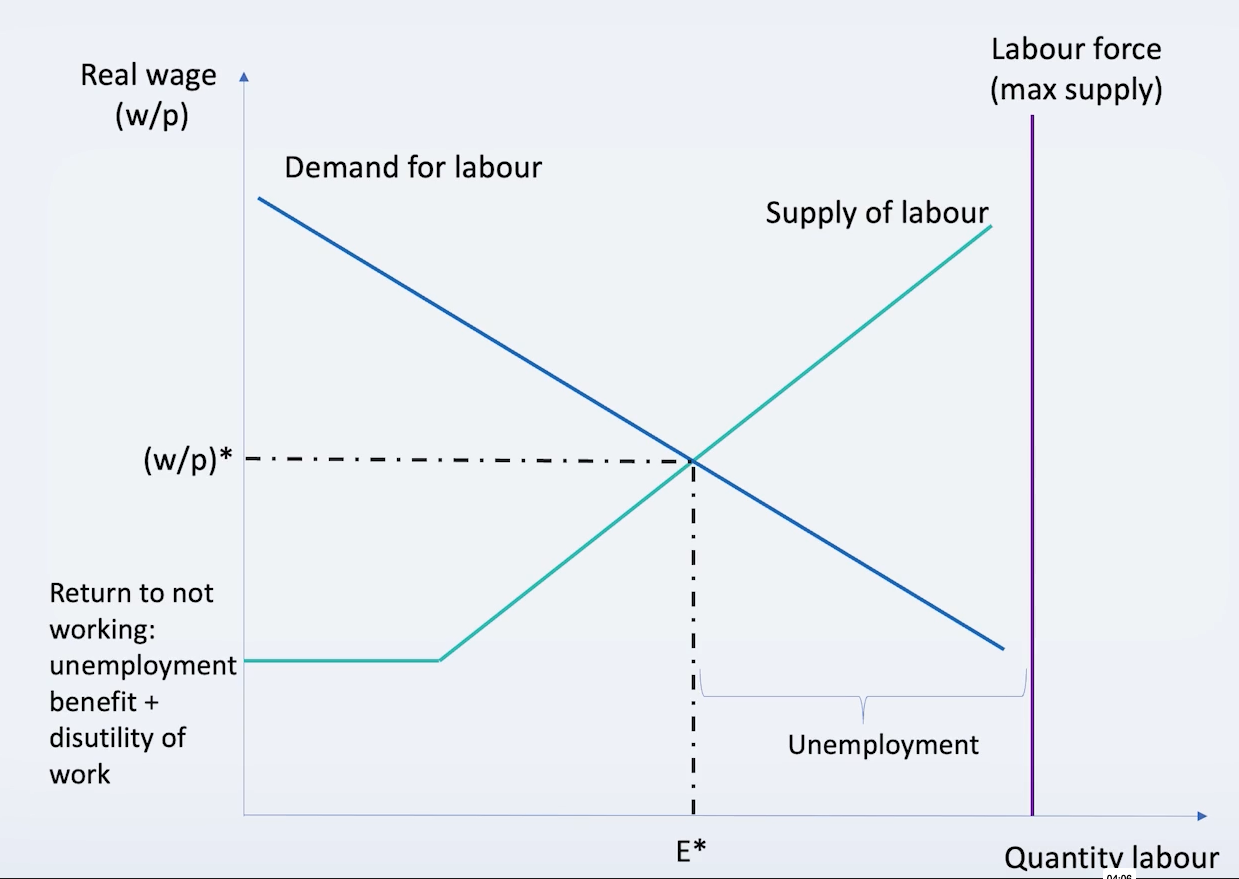
Equilibrium in the labor market
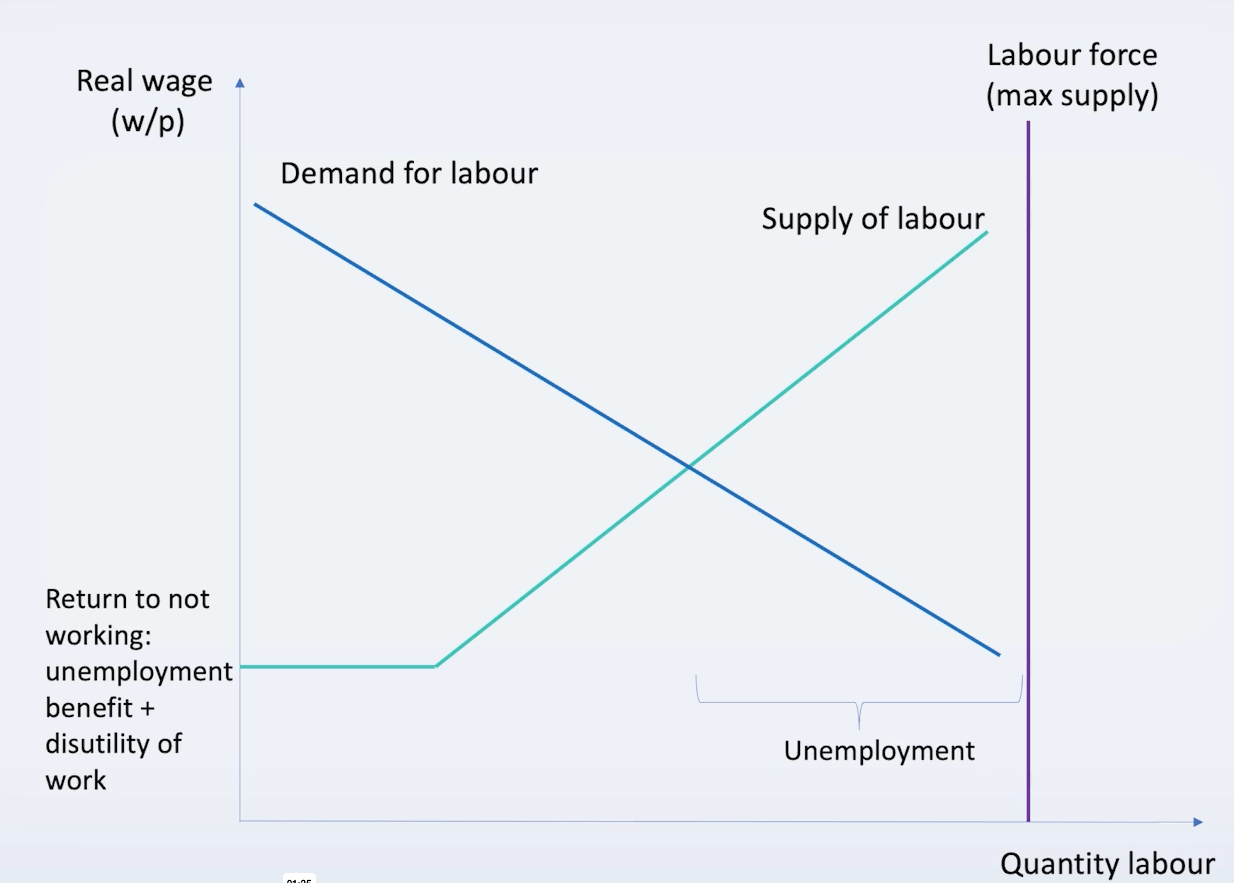
“unemployment” annotation
natural U rate
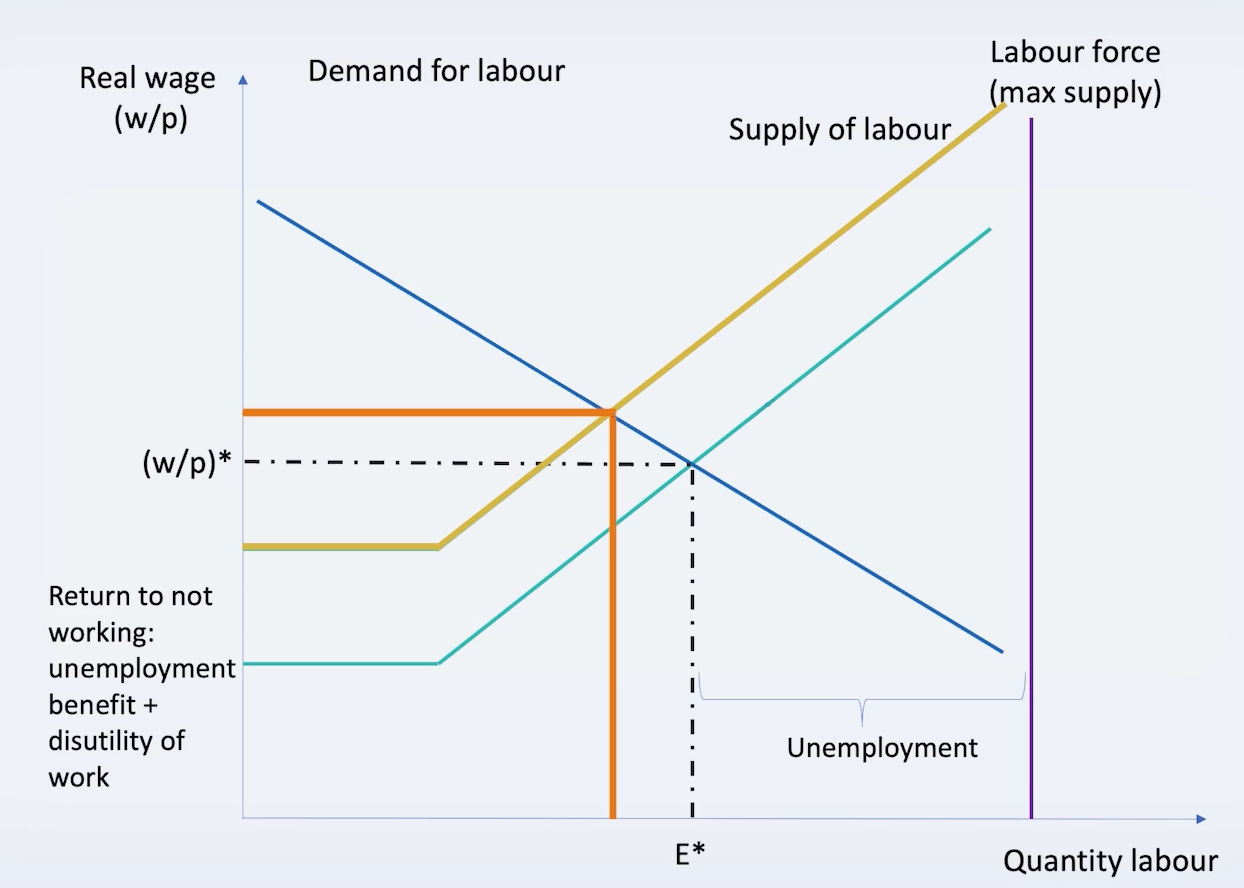
Shift in supply of labour (Up)
High real w and lower U
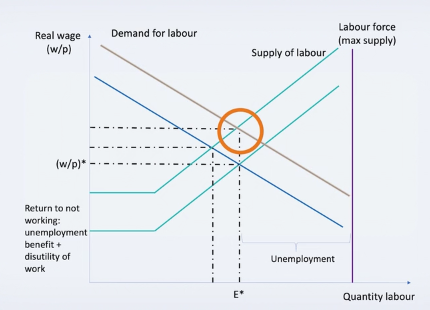
Shift in real w - for >desired Y
higher wage, for more LF
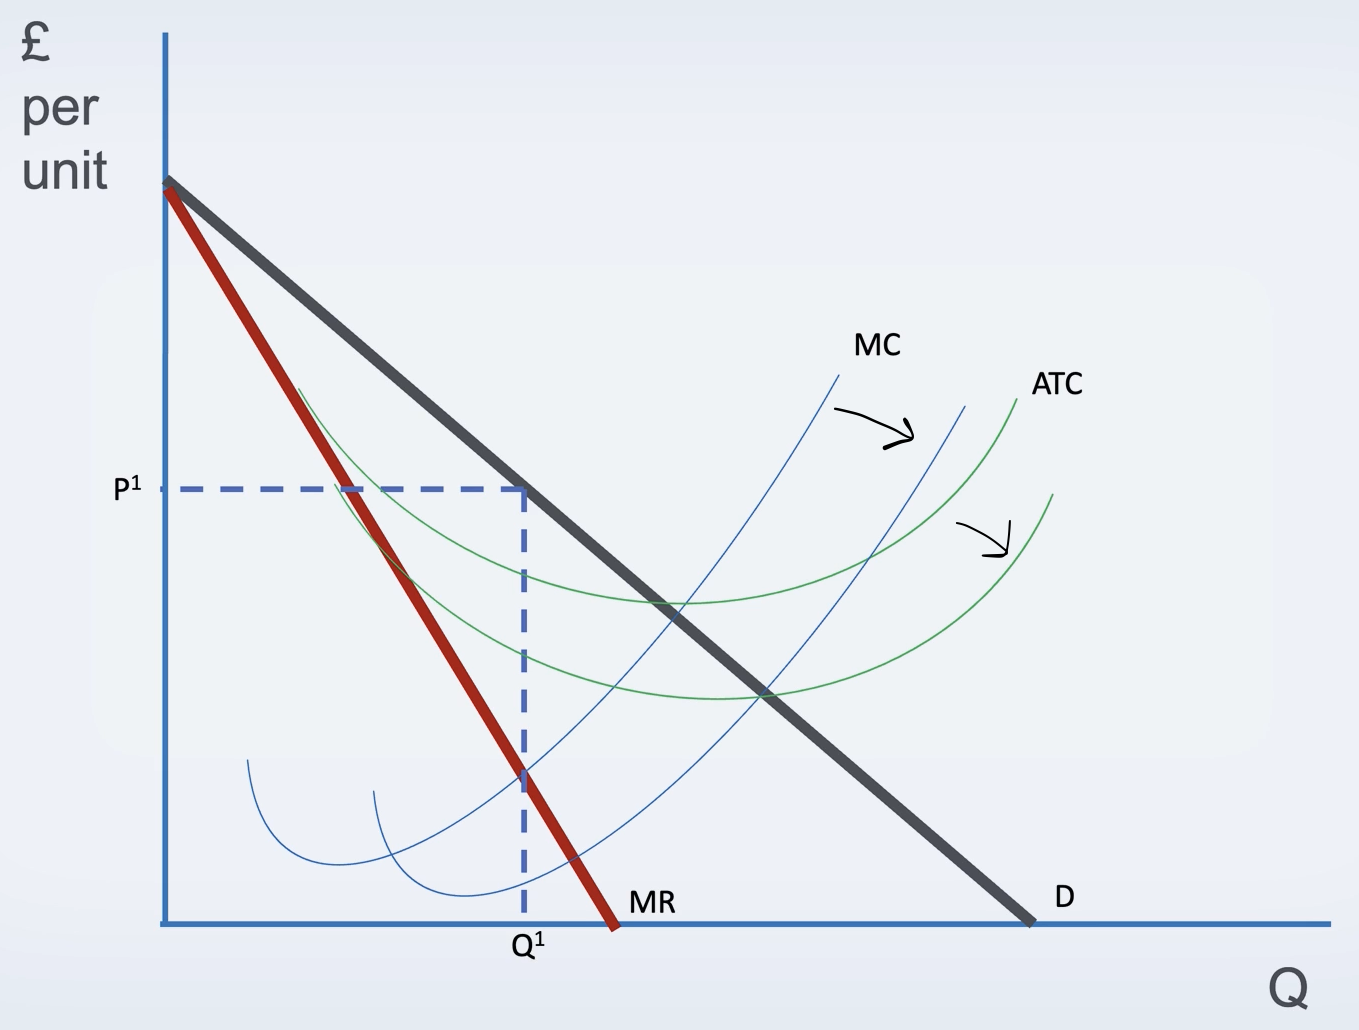
Effect of Labour force (Good labour) downward shift
lower both MC and ATC and A-VC - more profit
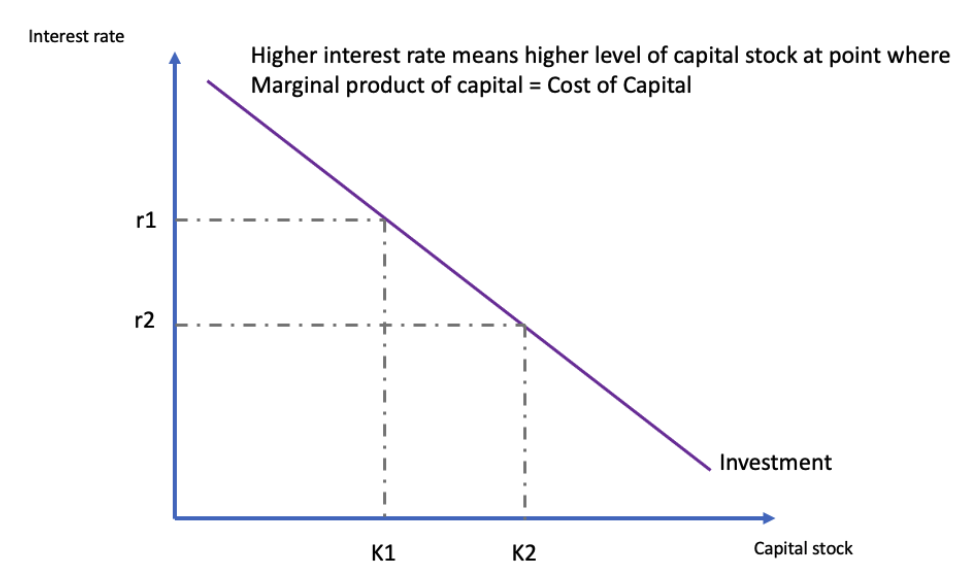
The higher in r = less people will in invest in K-stock, due to the lower value of Y, vice versa
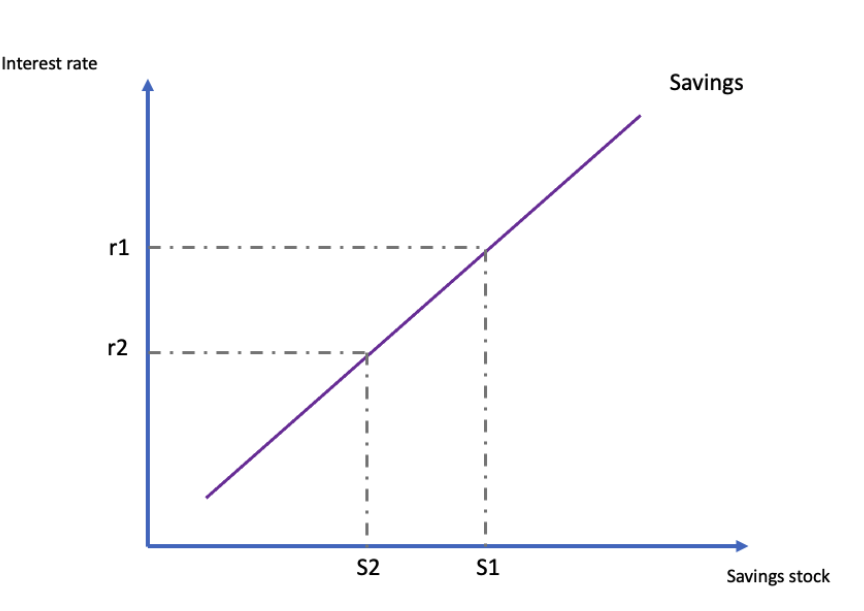
What can this reflect
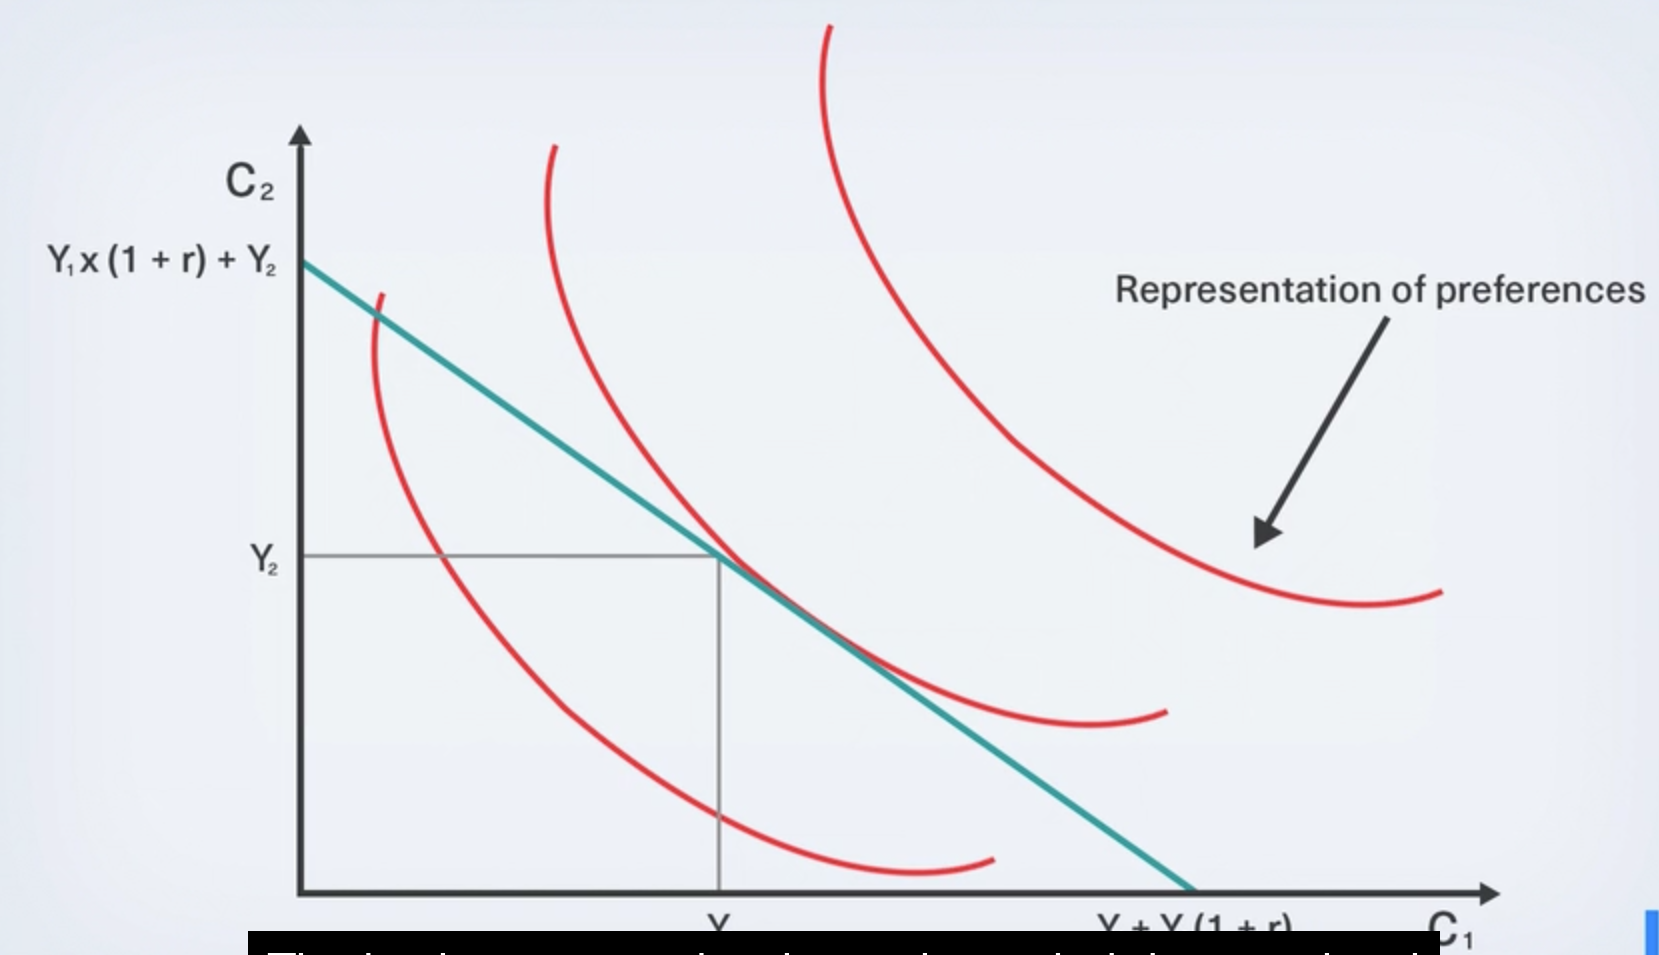
MPS
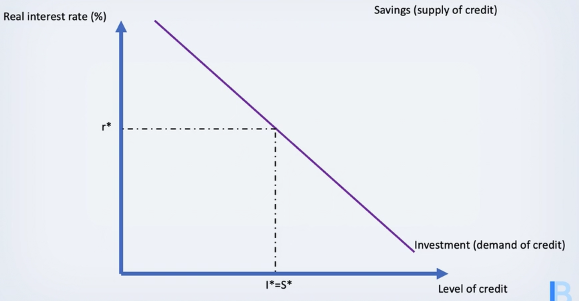
SAving displays the supply of credit - funding to banks —> lending to others
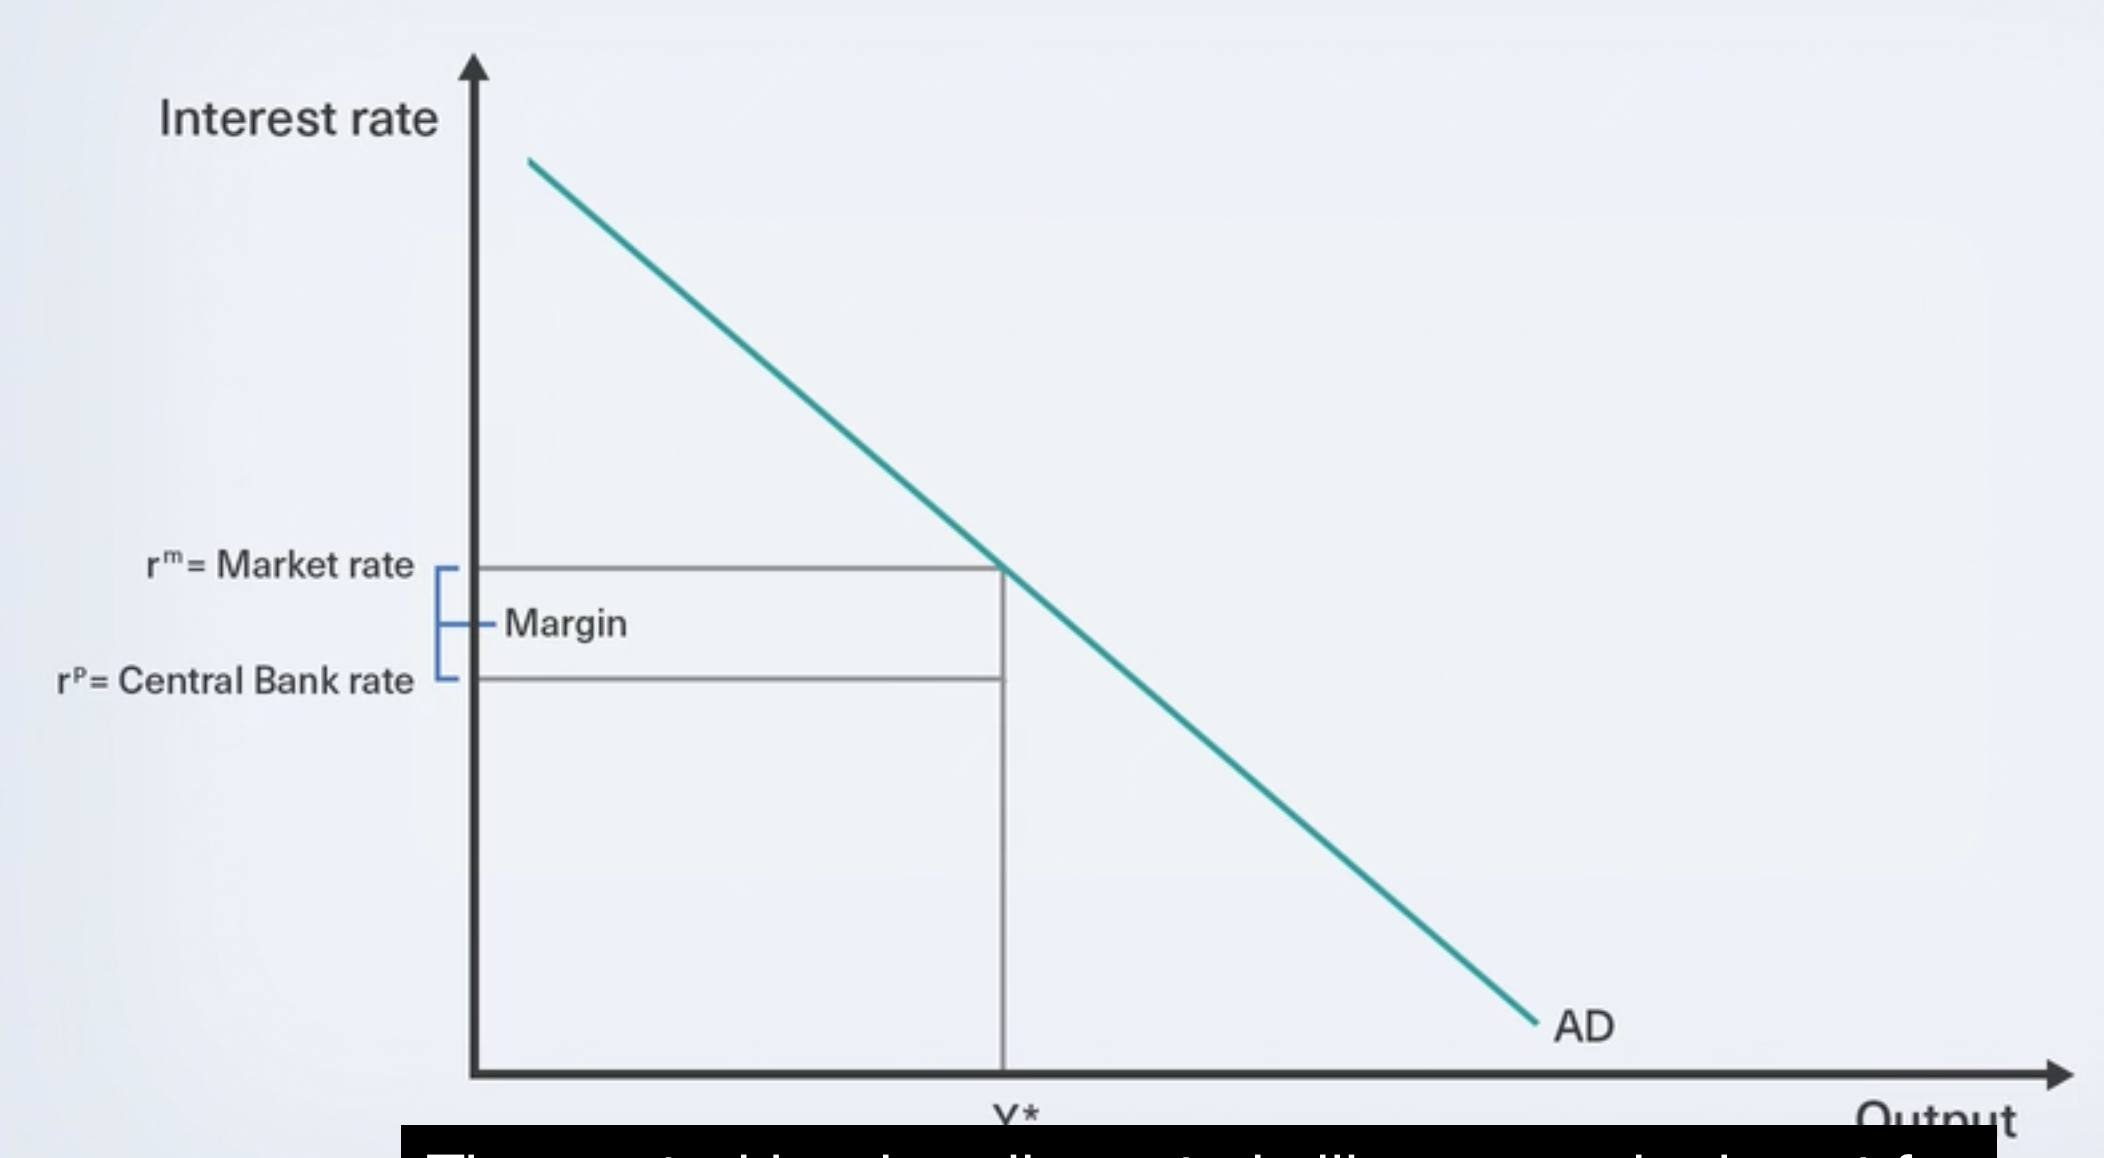
Central bank policy rate