Microeconomics Diagrams
 Call Kai
 Learn
Learn Practice Test
 Spaced Repetition
 Match
Match Flashcards
 Knowt Play
1/8

There's no tags or description
Looks like no tags are added yet.
Name | Mastery | Learn | Test | Matching | Spaced | Call with Kai | Chat |
|---|
No analytics yet
Send a link to your students to track their progress
9 Terms
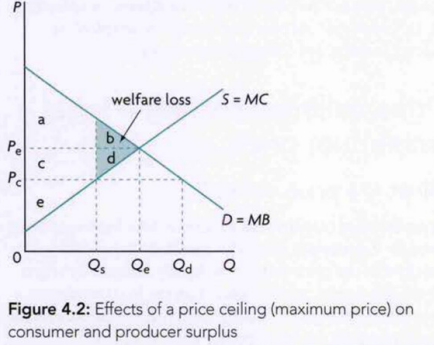
Welfare loss caused by price ceiling
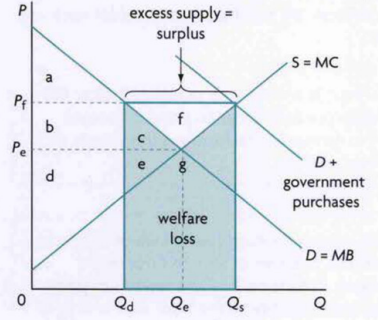
Price floor with government purchases and welfare loss
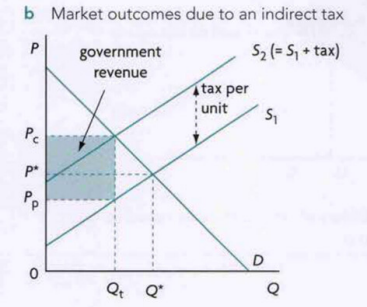
Specific tax diagram + welfare loss
welfare loss is triangle pointing to optimum
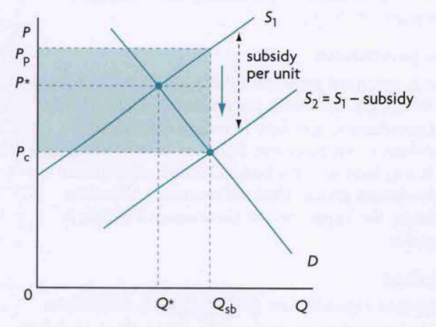
Subsidy diagram + welfare loss
triangle pointing to optimum
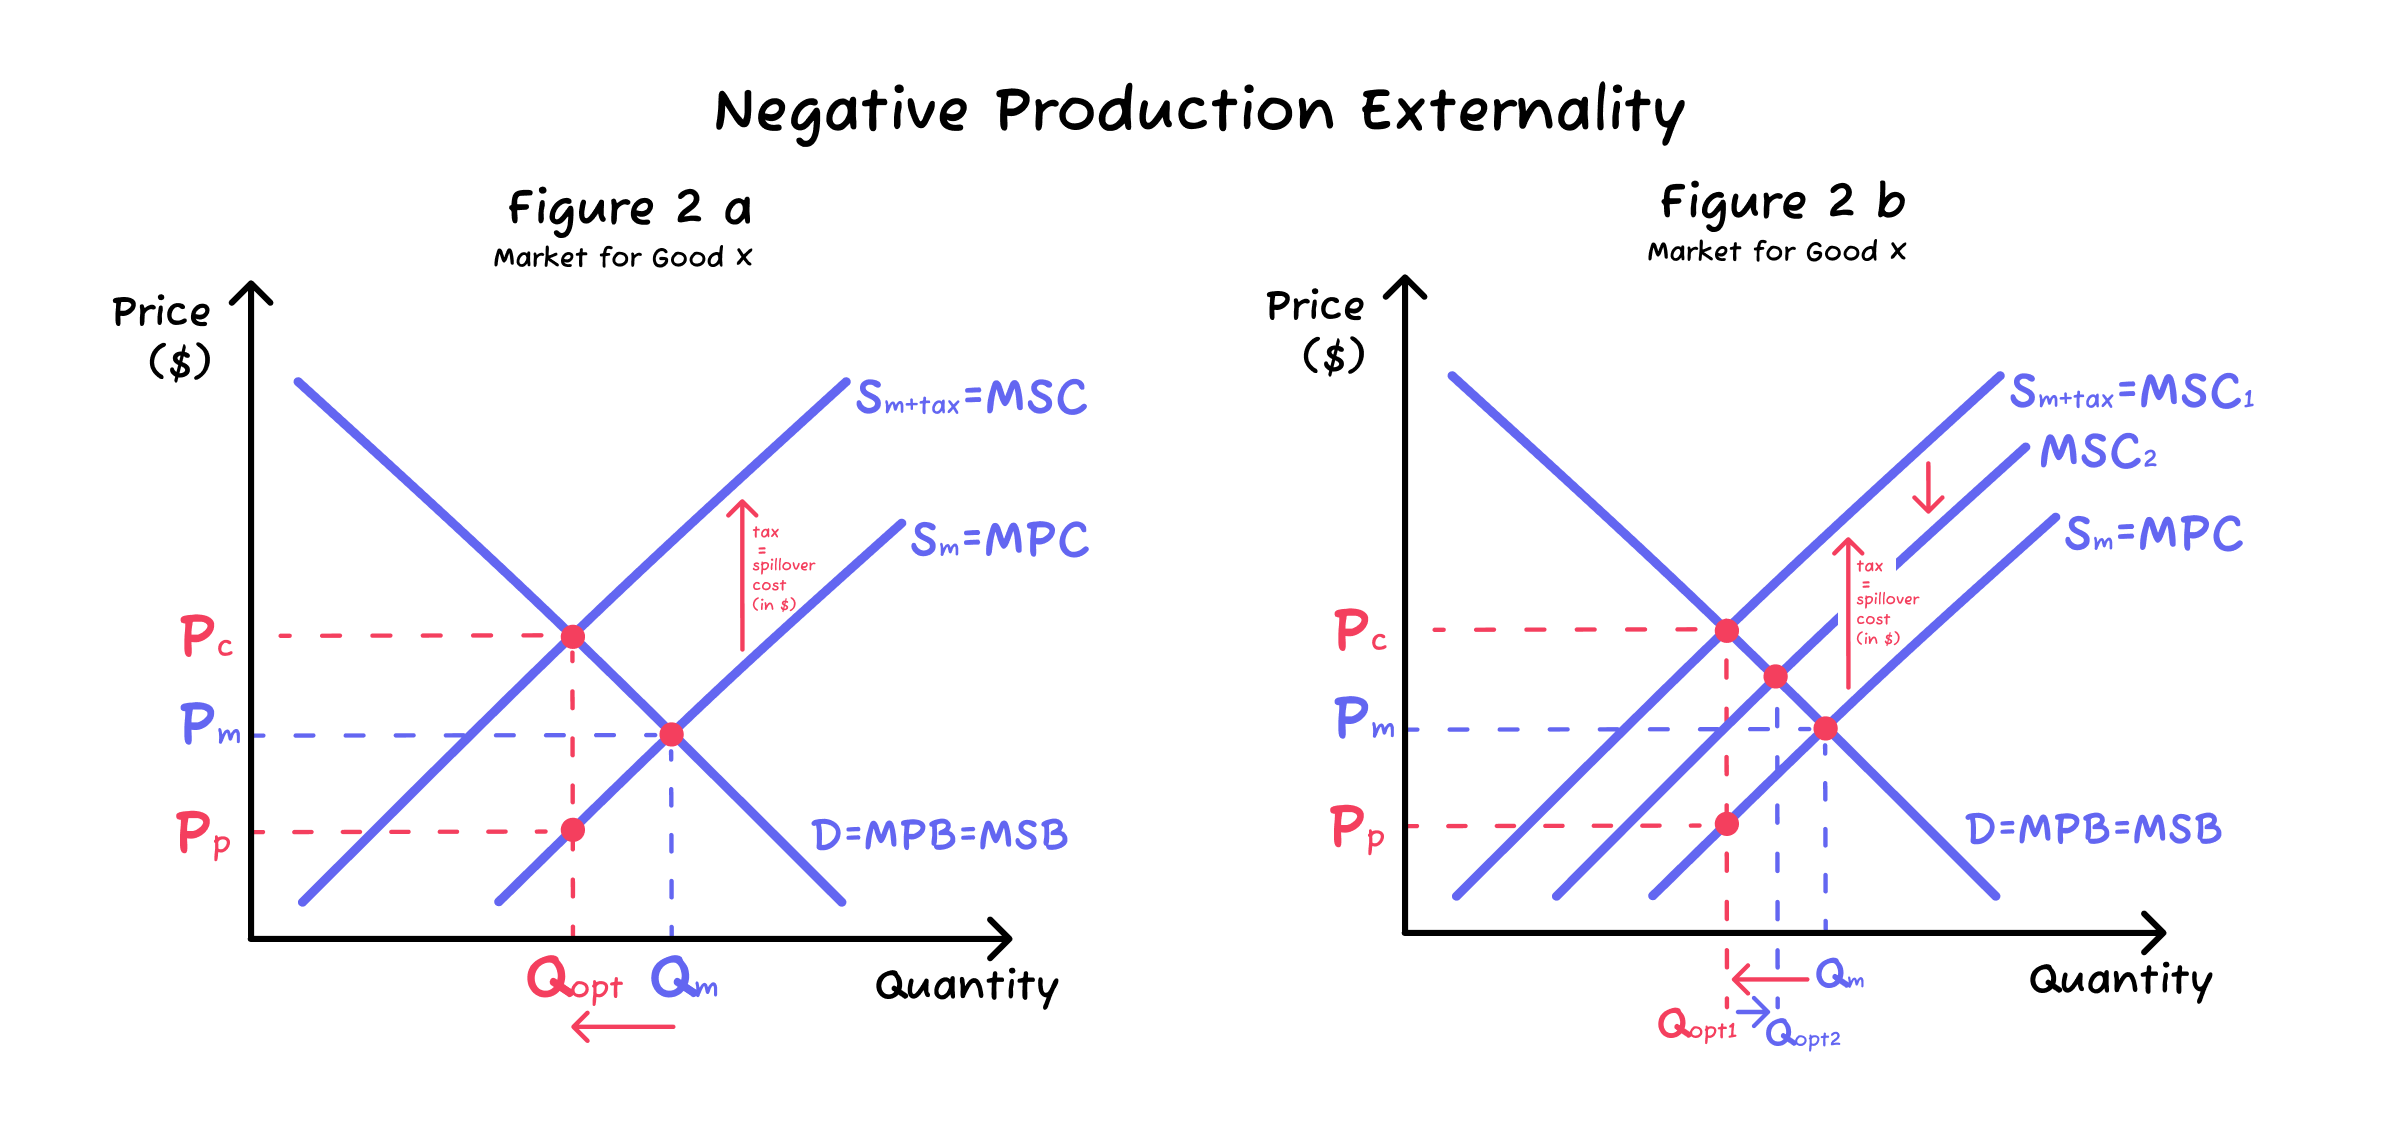
Piguovian tax and Carbon tax diagram
The introduction of a carbon tax helps shift the MPC curve to the MSC curve.
However, as there are alternatives to carbon emitting fossil fuels, which do not get affected from carbon tax, a lot of firms may switch to those alternatives.
Hence, firms still pollute the environment, but by a lower factor, which is represented by the shift from
to MSC1 to MSC2. (EXTERNAL COST DECREASES)
Therefore the externality may not be fully corrected, but rather reduced.
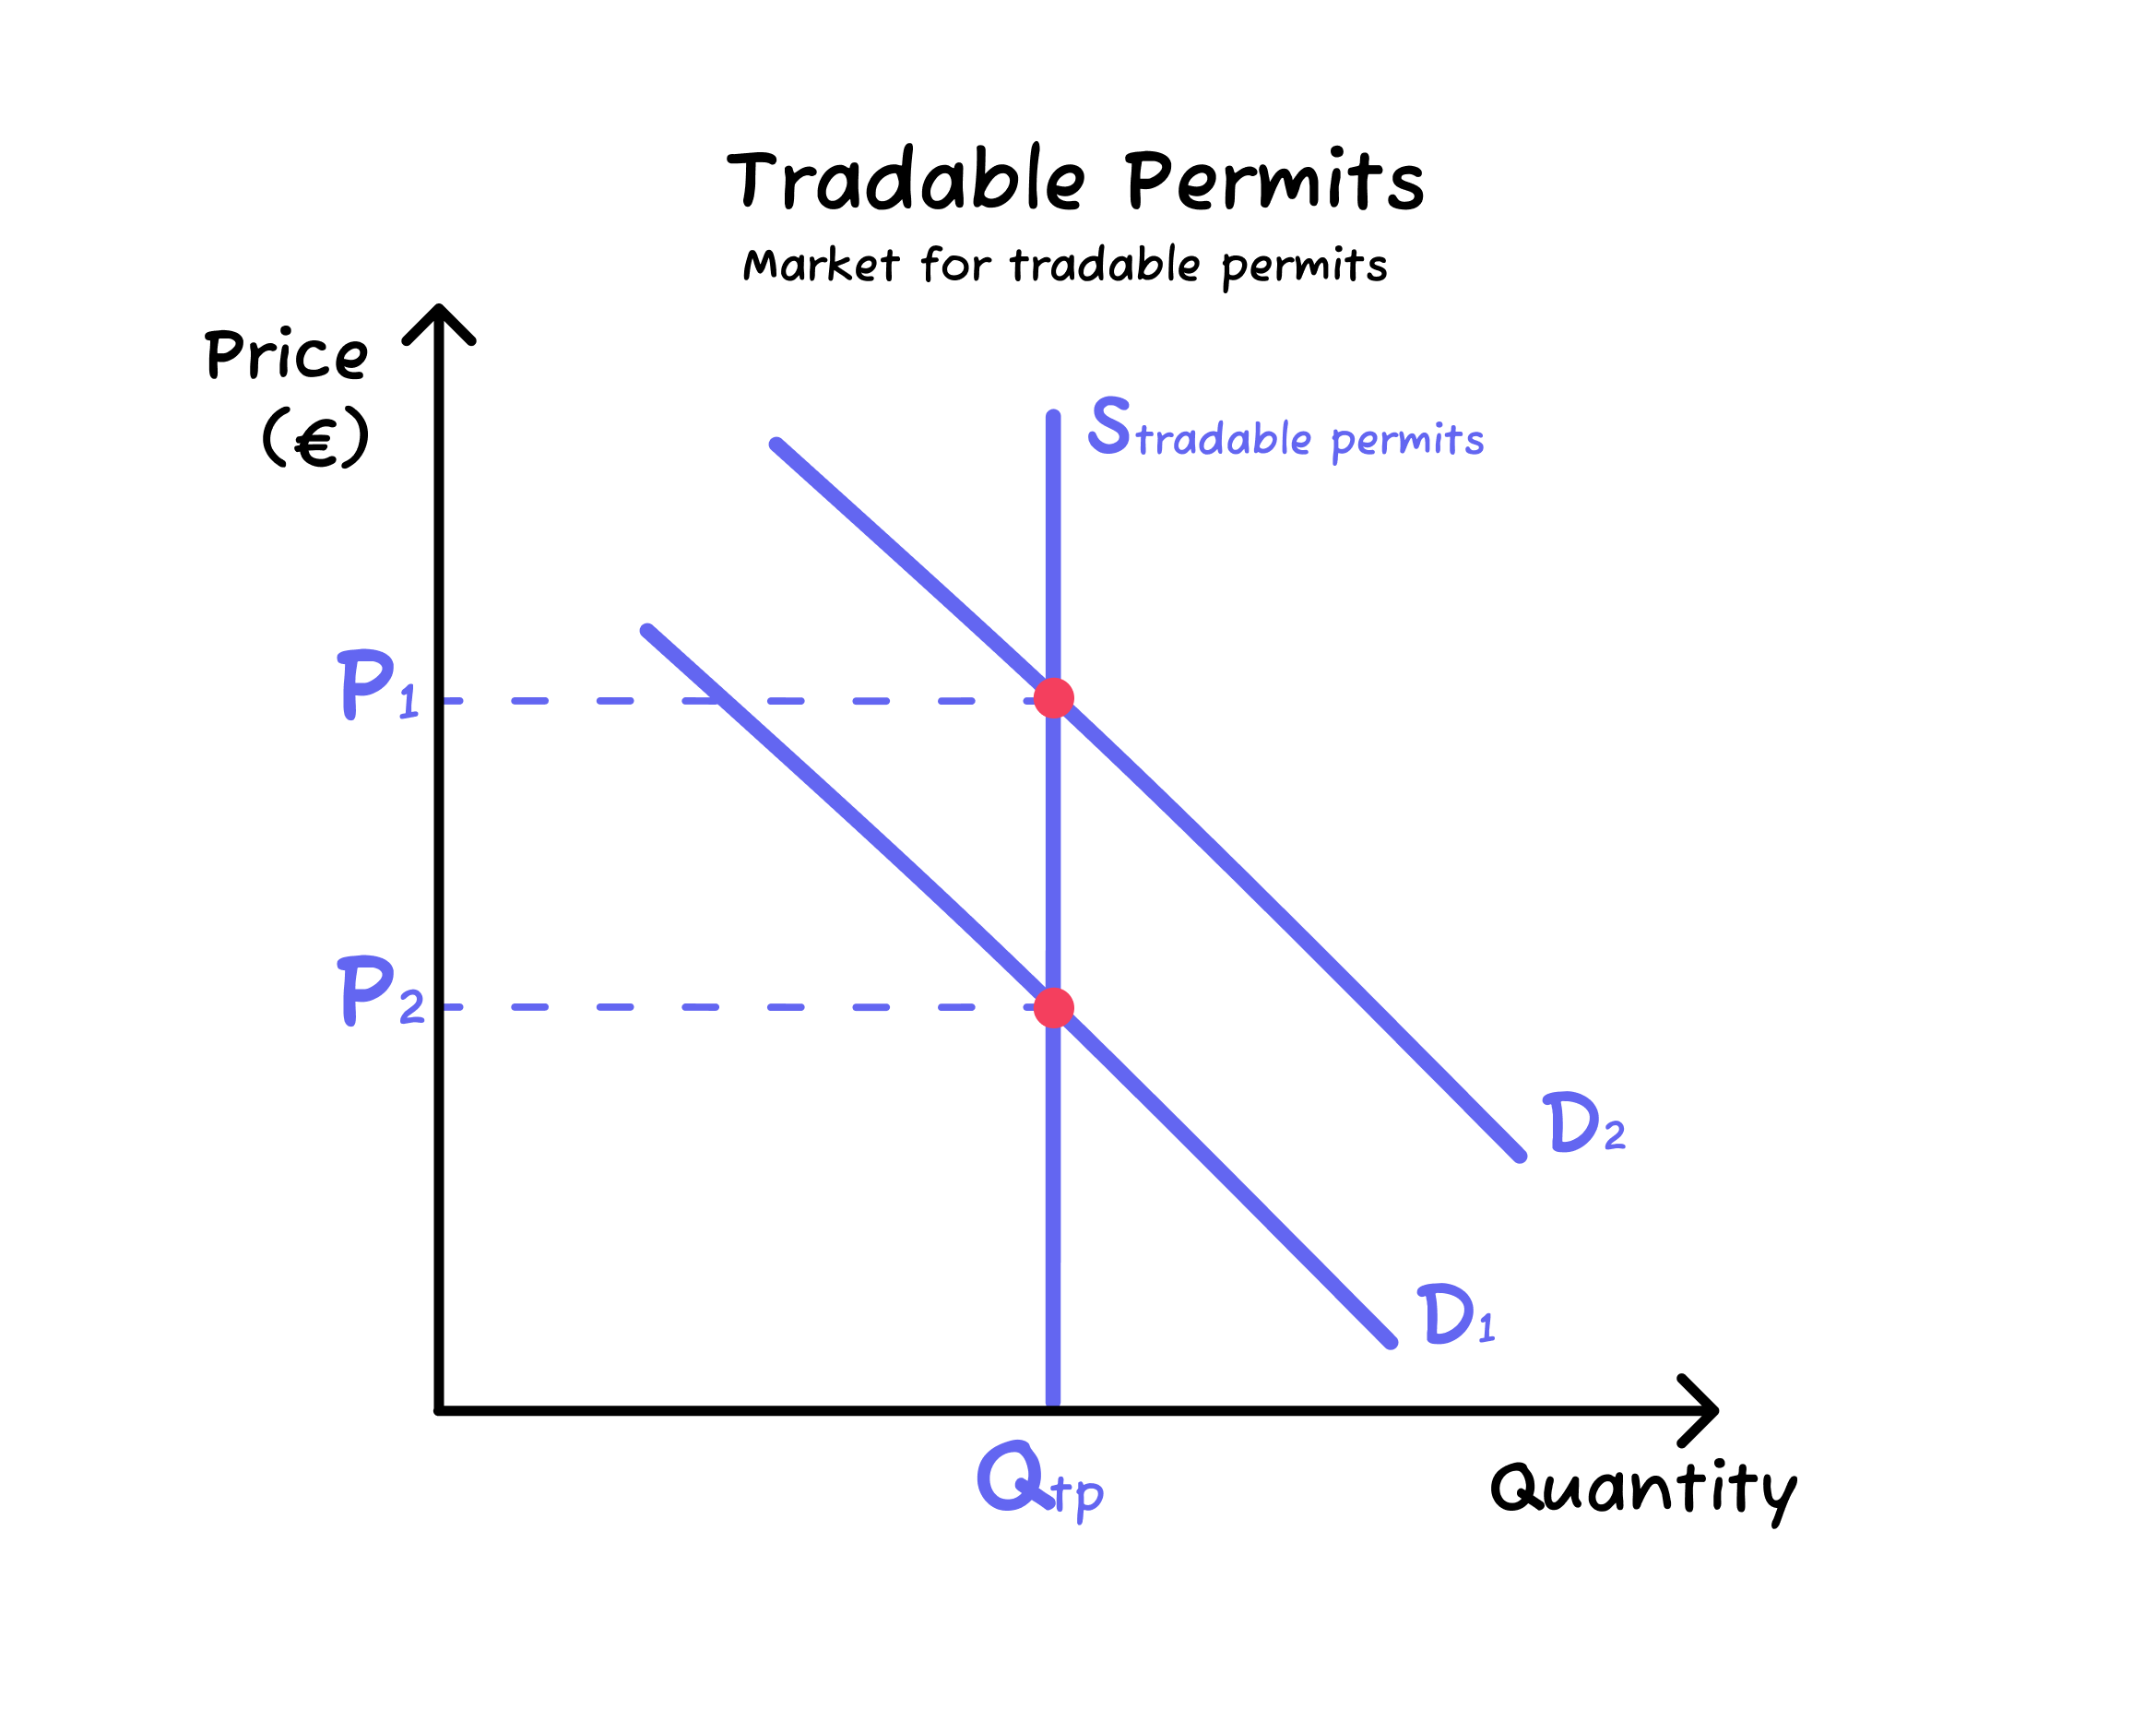
Market for tradeable permit diagram
As an economy grows and the firms increase their output levels,
the demand for permits is likely to increase, as shown by
the rightward shift of the demand curve from D1 to D2.
With supply fixed, the price of permits increases from
P1 to P2.
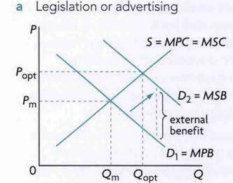
Legislation (mandate consumption) / advertising diagram
MPB to MSC
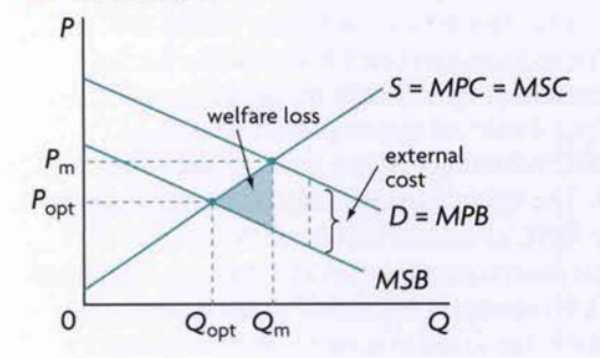
Negative consumption externality diagram
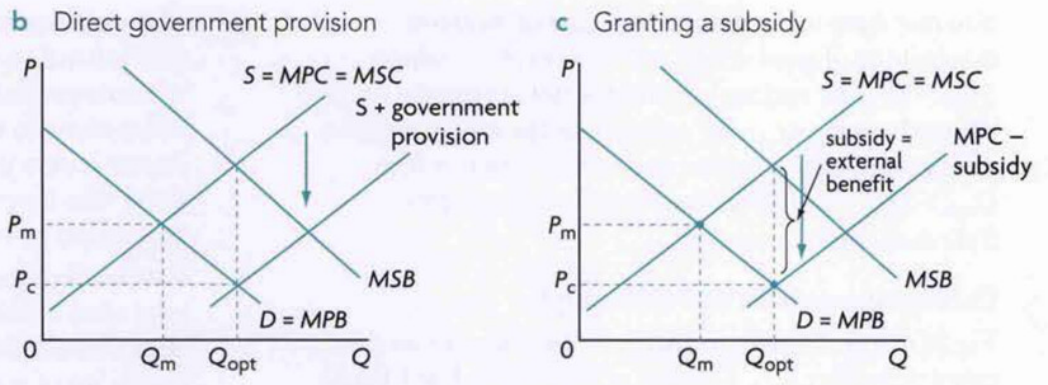
Correcting positive cosumption externality with government provision / subsidy