Modeling a Data Warehouse
1/31
There's no tags or description
Looks like no tags are added yet.
Name | Mastery | Learn | Test | Matching | Spaced | Call with Kai |
|---|
No analytics yet
Send a link to your students to track their progress
32 Terms
The 7 W’s of Business Questions
WHO is involved?
WHAT did they do? To WHAT is it done?
WHEN did it happen?
WHERE did it take place?
HoW many or much was recorded – HoW can it be measured?
WHY did it happen?
HoW did it happen – in what manner?
What is a warehouse?
Efficiently store things so you can easily find them later when they are needed
Business Intelligence
Infrastructure for collecting, storing, analyzing data produced by business
Databases, data warehouses, data marts
Data Warehouse
Tools and techniques for analyzing data
OLAP, statistics, models, data mining
Purpose: Consolidate and integrate data from multiple sources (including various databases) into a central repository designed for analysis.
Structure: Often uses dimensional modeling (fact and dimension tables) for efficient querying.
Benefit: Provides a historical and holistic view of the organization’s data over time, enabling deeper insights.
Database Design Approaches
Database Design Approaches
DW/BI – Data Warehouse / Business Intelligence
OLTP – On-Line Transaction Processing
Operational systems to support the execution of business processes
Execute individual business processes
Processes are stable, predictable, pre-defined, real-time
Optimized for transaction processing: (Select, Insert, Update, Delete)
DW/BI – Data Warehouse / Business Intelligence
Support the evaluation of business processes
Evaluate effects of multiple business processes
Optimized for query processing: (Select)
Ad-hoc, querying very large amounts of data
Normalization (Normal Forms) Refresher
First Normal Form (1NF)
Second Normal Form (2NF)
Third Normal Form (3NF)
First Normal Form
All attributes have an ‘atomic’ value
Remove redundant columns and fields, and add a primary key
Second Normal Form (2NF)
Lessens redundancy of 1NF, by eliminating partial dependencies
Third Normal Form (3NF)
Further reduces data duplication, by removing transitive dependencies
(Transitive = Indirect dependency)
OLTP Advantages
Very efficient for data entry
Normalization minimizes duplication (3NF)
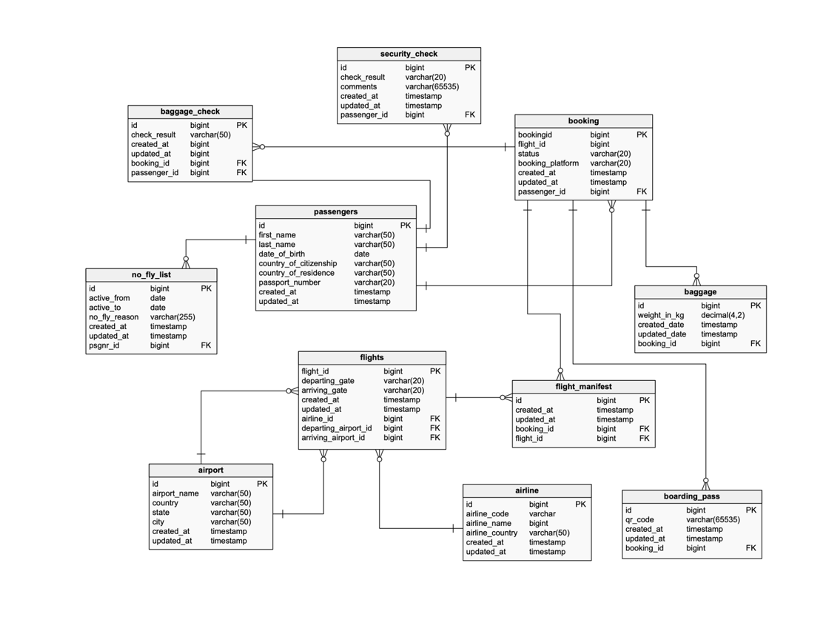
OLTP Disadvantages
ERD Diagrams can be very complex!
Many joins and combinations
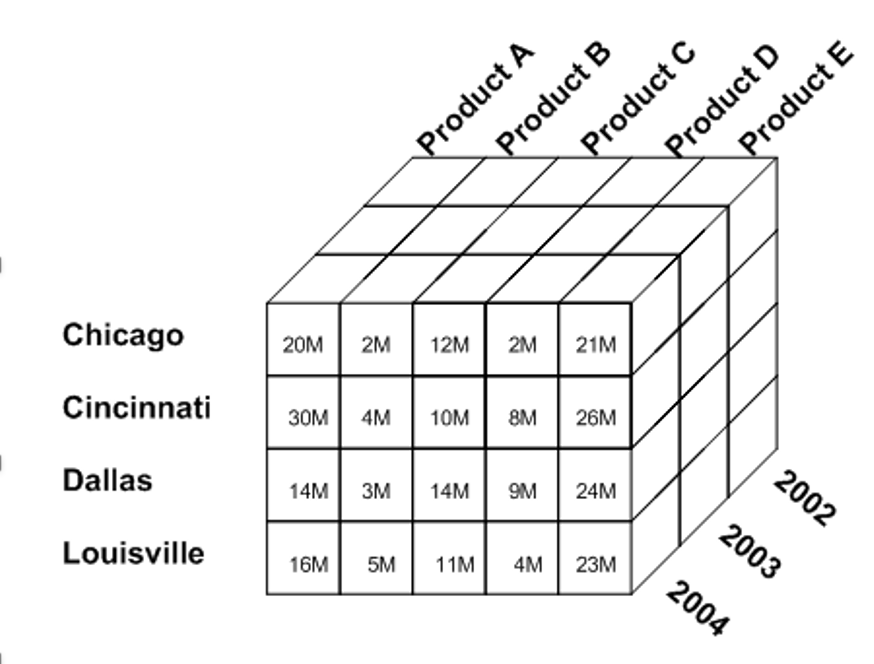
data cube
Grouping of data in a multidimensional matrix.
Arrange relevant information together
Expedite query response times
Analyze large datasets quickly
Dimensional Modeling
Define business processes and individual events in terms of:
Facts
Dimensions
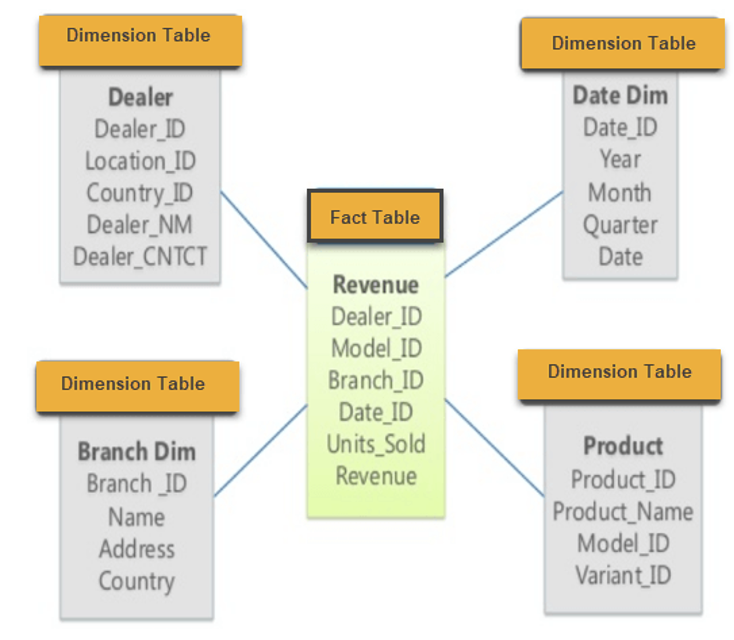
fact
Measurements. A quantitative piece of information.
Dimensions
Descriptions of the objects. One of the 7 W’s.
star
Single fact table referenced by several dimension tables.
Design Considerations
Data Driven Analysis
Report Driven Analysis
Reactive BI Design
Proactive BI Design
Data Driven Analysis
Analyze operational data sources
Starts with the raw data and explores it to uncover patterns, trends, or insights without a predefined set of questions. The analysis evolves based on what the data reveals.
Report Driven Analysis
Analyze business intelligence needs
Begins with a specific set of reporting requirements or business questions. The data warehouse and BI tools are designed to generate predefined reports that answer these questions.
Reactive BI Design
Wait for OLTP design and data
an established company might have an existing OLTP system and opt for a reactive approach
Proactive BI Design
Design DW/BI in parallel with OLTP
For example, a startup might favor a proactive design to quickly gain business insights
So how do you start the design?
‘Chicken or Egg’ conumdrum
agile modeling
Early and frequent delivery of working models, focusing on stakeholder input and value
collaborative
Incremental
Iterative
Early and Frequent Delivery: Delivering working models incrementally rather than waiting for a complete design.
Collaborative Approach: Involving stakeholders directly in the modeling process to ensure the design meets their needs.
Incremental and Iterative: Gradually refining the model based on ongoing feedback and new requirements.
collaborative
Model directly with stakeholders
Incremental
Provide more requirements when they are better understood by stakeholders
Iterative
Understanding existing requirements better and improve existing schemas refactoring:
Correcting mistakes
Adding missing attributes
Describe the 7 W’s of Business Analytics
Who
What
When
Why
How Many
How did it work
Descibe the difference between OLTP and DW/BI
OLTP = Execution
DW/BI = Evaluation
Understand fact and dimension tables (Star Schema)
Fact = Measurments
Dimensions = Descriptions
Designing and Modeling BI Database
agile with stakeholders: Collaborative, Incremental, Iterative