AP Chemistry ALL UNITS (1-9) Ultimate Study Guide
 AP Practice
 Call Kai
1/212

Earn XP
Description and Tags
okay so ik this is a little late but if anyone else has procrastinated to the point of last minute cramming like me then here you go have this i guess. i have another one of these of just units 1-5 i made for my midterm and just kinda copied over here with the new units added so... yeah lol.
Name | Mastery | Learn | Test | Matching | Spaced | Call with Kai | Chat |
|---|
No analytics yet
Send a link to your students to track their progress
213 Terms
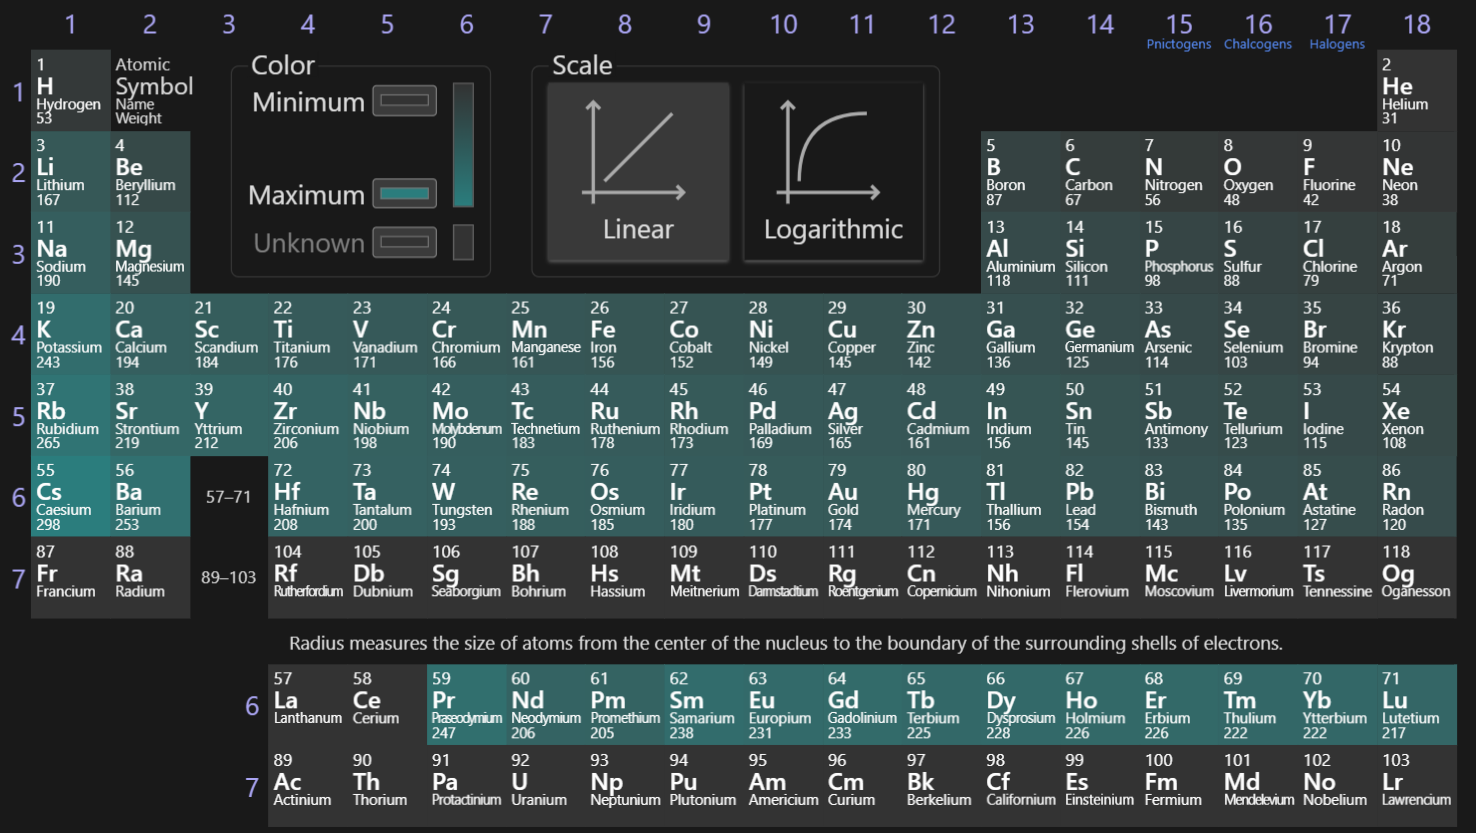
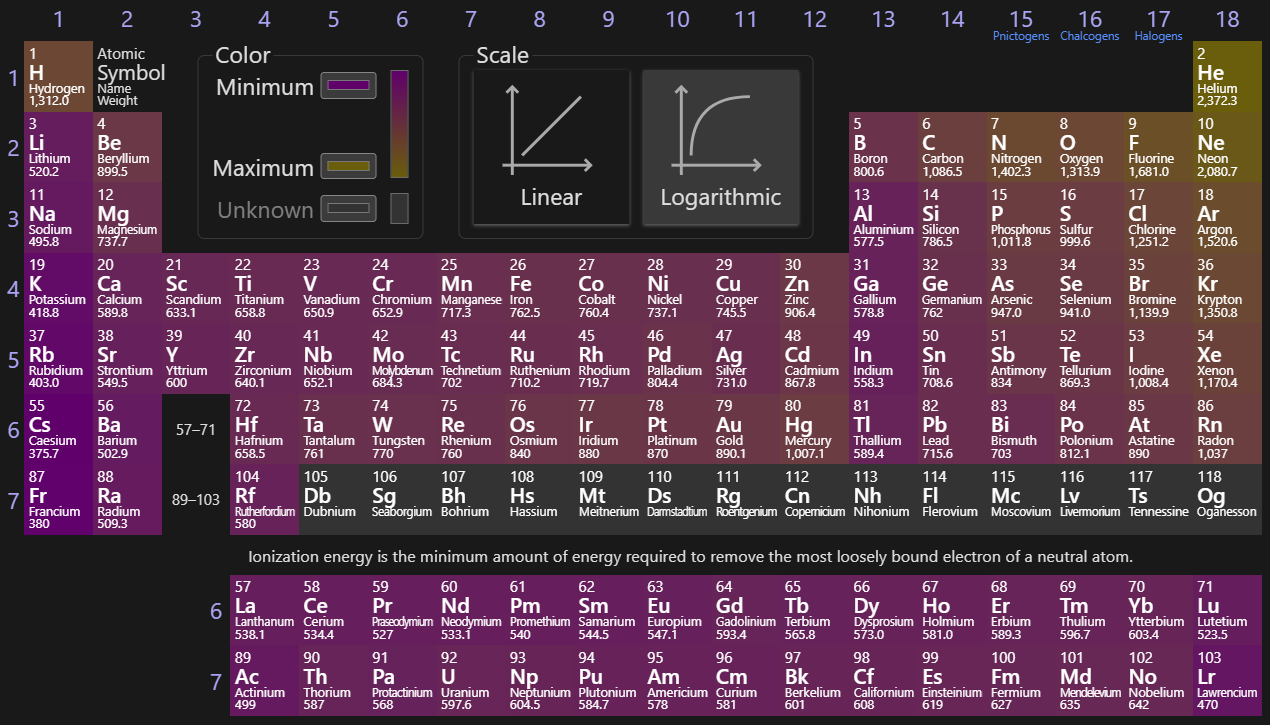
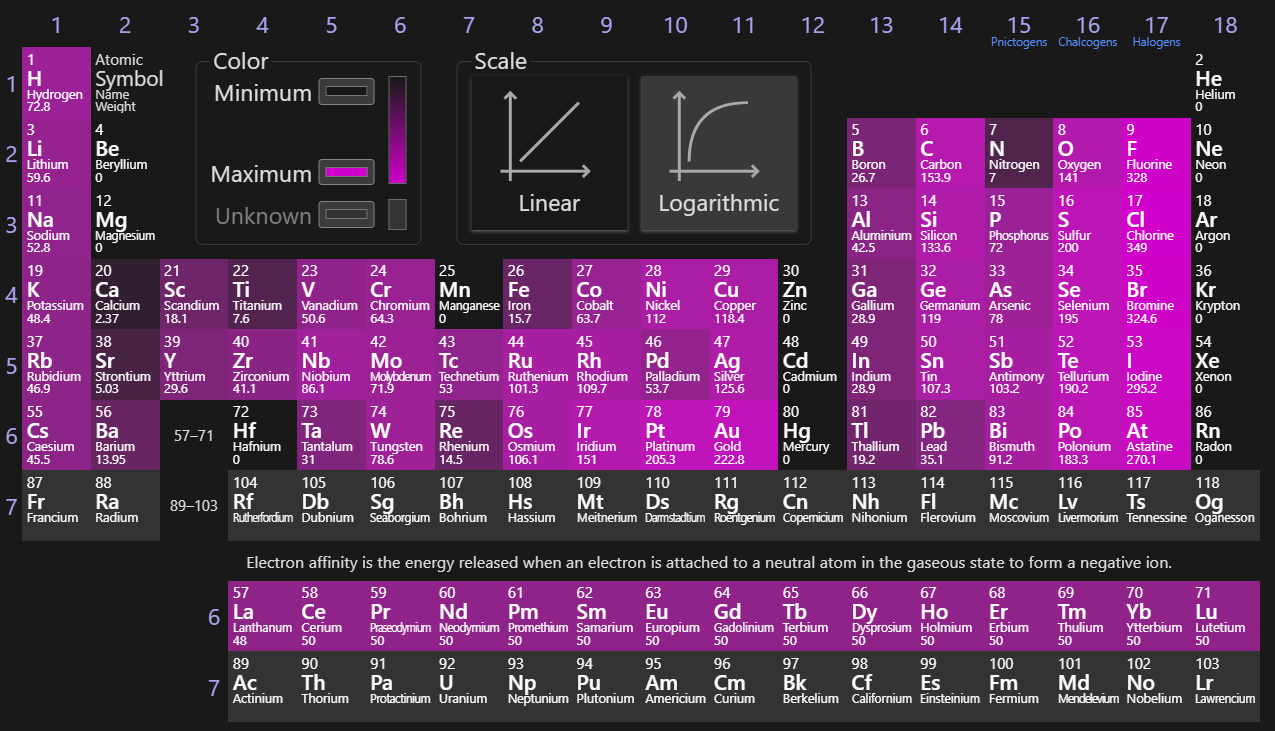
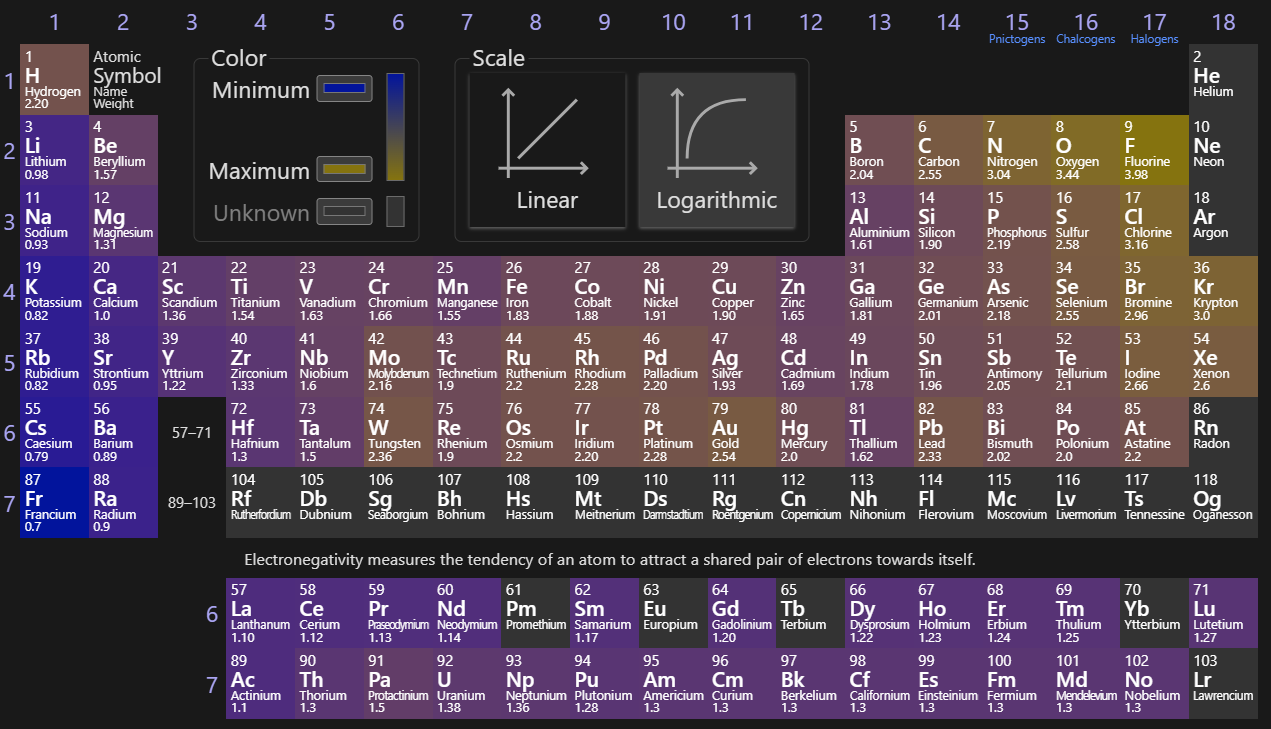
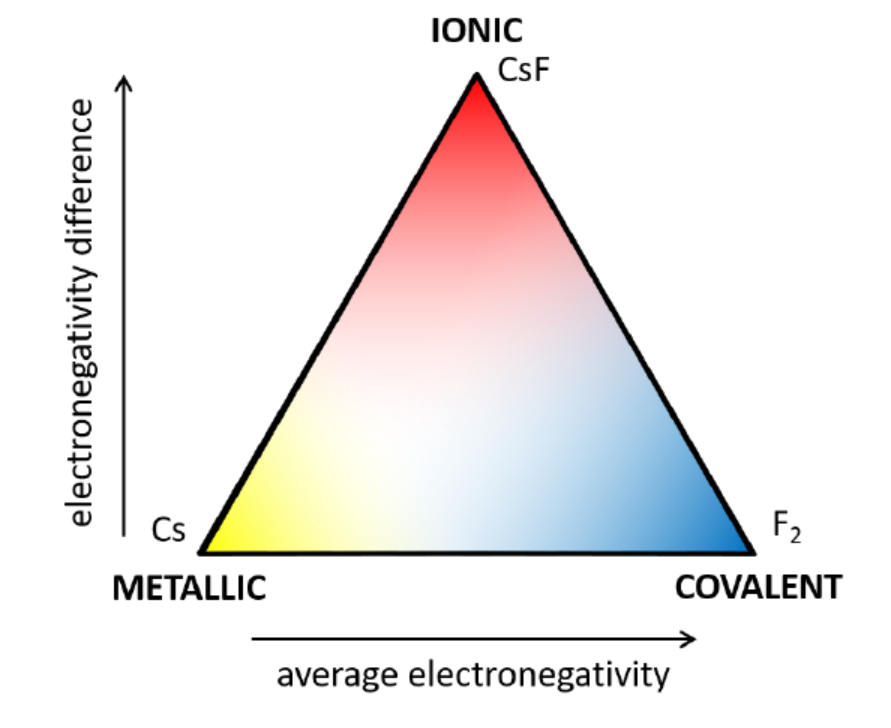
The amount of energy gained by an atom when it gains another electron. For noble gasses, this will always be 0 k/mol. But since it is affected by the strength of the attraction between the nucleus and new electron as described in Coulomb’s law for all other elements, it trends upward and to the right (increasing towards Cl).
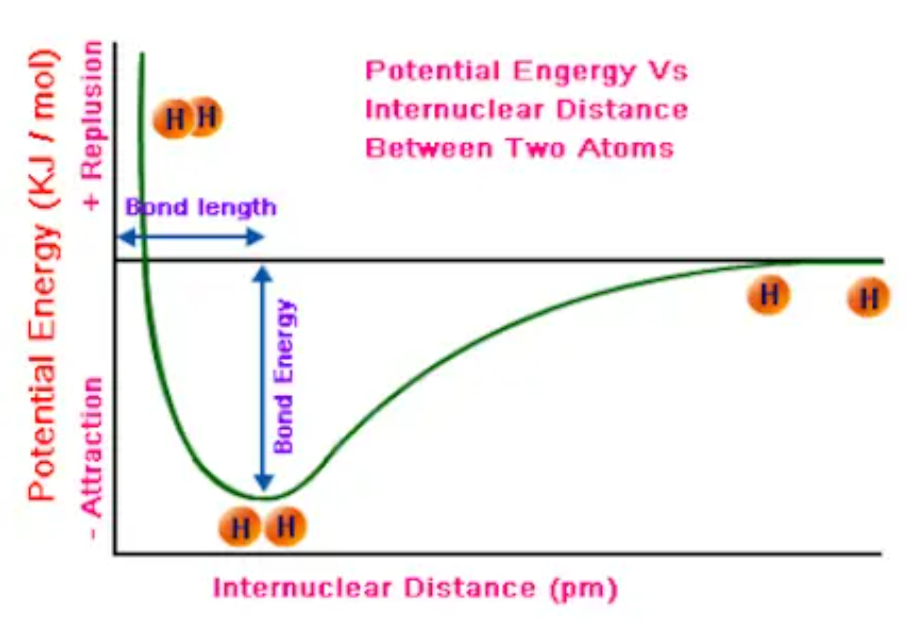
Graph which shows the potential energy of chemical bonds, helping predict how long and strong the chemical bond shown is. The potential energy well shows the most stable point of the bond at the trough of the graph. The bond can always exist at that state, and here it has the least amount of potential energy. The lower the trough, the shorter and stronger the bond formed there is. Bonds can be stronger because they are of a stronger bond type (triple being strongest) or made of smaller atoms as smaller bonds are stronger.
Valence Shell Electron-Pair Repulsion Theory (VSEPR)
Theory which predicts the geometry of molecules, founded on the idea that valence electrons repel from one another, so they will be as far away from each other as possible in a molecule’s shape. Although this is neglectable, the more delocalized lone pairs there are, the more they will repel. The angle of an electron’s repulsion will depend on the amount of electron domains present. Also, while lone pairs don’t physically contribute to molecular geometry, their repulsion still does.
For different electron and molecular geometries, go here: https://knowt.com/flashcards/841bf0c5-ebab-461b-8672-ab2f158e957b
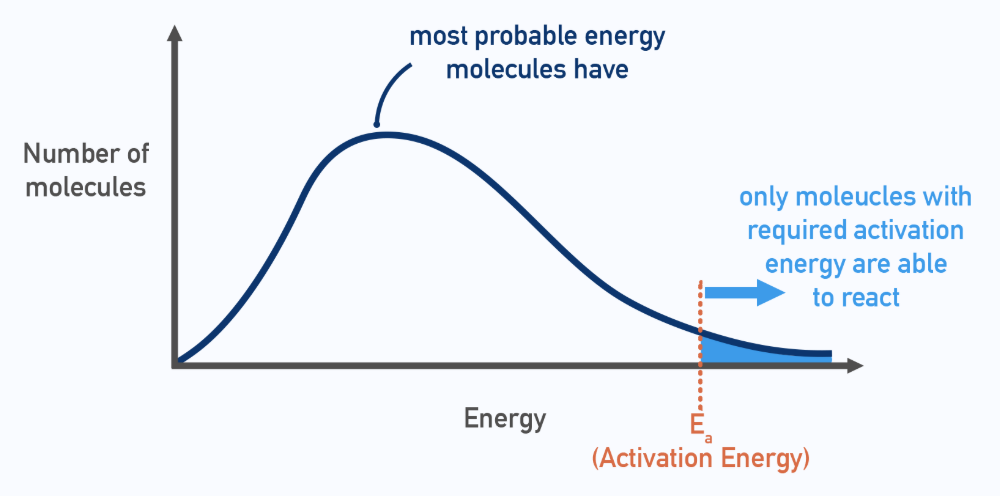
Maxwell-Boltzmann Distribution Curve
Graph demonstrating the energy that the molecules of a gas could potentially have in a given system. The peak of the graph shows the amount of potential energy that any given gas molecule is most likely to have. Should a dotted line be drawn, that line shows the energy that is needed in order for a reaction to occur should two of these gas particles collide. Increasing the temperature of the system will cause the curve of this graph to shift to the right, as well as lowering the peak, since the increase of heat will grant more molecules a higher potential energy.
Molarity
The concentration, typically shown with brackets ‘[]’, of a solution as it is directly related to moles, represented by the equation M = n × V (where M is molarity, n is moles of solute, and V is volume of solvent in liters).
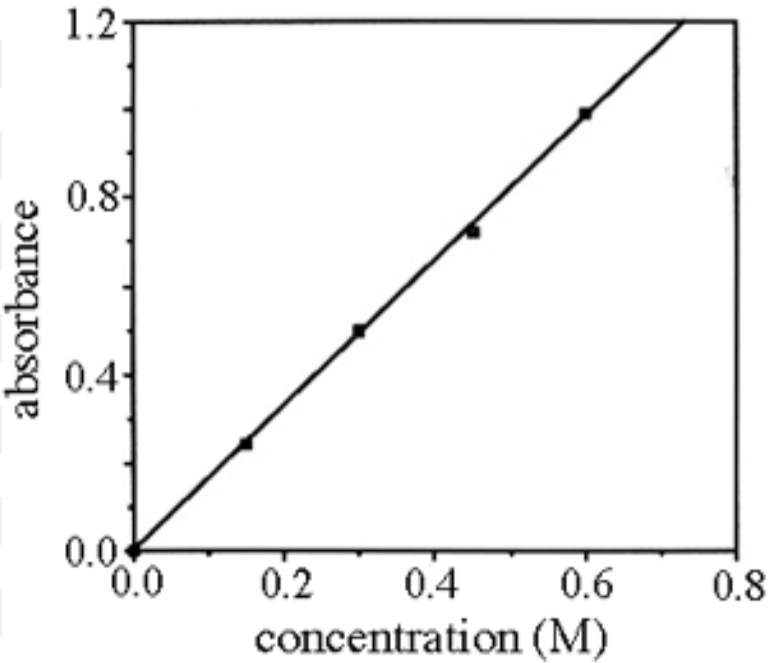
![The absorbance [of light waves] of a chemical is defined by the equation A = εbC (where A is absorbance often within the interval 0 < A < 1, ε is the molar absortivity constant, b is the path length of the curette in cm [if not indicated, it is assumed to be 1cm], and C is the concentration of the chemical in M or m/L). Experimentally, this can be demonstrated by placing a substance in a curette and targeting a specific frequency of light at it to measure its absorbance factor.](https://assets.knowt.com/user-attachments/0259ab28-65f0-42d9-afd8-ad1ef7d5204a.png)