2.3 LMM Diagnostics and Other Issues
 Call Kai
 Learn
Learn Practice Test
 Spaced Repetition
 Match
Match Flashcards
 Knowt Play
1/17

Earn XP
Description and Tags
Section 2.3 of Exam MAS-II
Name | Mastery | Learn | Test | Matching | Spaced | Call with Kai | Chat |
|---|
No analytics yet
Send a link to your students to track their progress
18 Terms
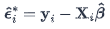
Conditional Residual
The difference between the observed response and the conditional predicted value.

Marginal Residual
The difference between the observed response and the unconditional predicted value.
Standardized Residual
Scaling a residual by dividing by its true standard deviation. Denoted as

Studentized Residual
Scaling a residual by dividing by its estimated standard deviation. Denoted as

Internal vs External Studentization
Internal Studentization – The estimate of the standard deviation includes the observation the residual corresponds to.
External Studentization – The estimate of the standard deviation does not include the observation the residual corresponds to.
Pearson Residual
Scaling a residual by dividing by the estimated standard deviation of the response. Denoted as

Potential Issues with Residuals
Residuals with non-zero averages
Heteroscedasticity
Non-normal errors
Outliers
Influence Diagnostics
Techniques used to identify the influence an observation or set of observations have on the response, or the parameter estimates in B and theta
Likelihood Distance
Restricted Likelihood Distance
Cook’s Distance
Multivariate DFFITS Statistic
Covariance Ratio
Predicted Residual Error Sum of Squares (PRESS) Statistic
Name,Parameter(s),Description,Diagnostic Type,General Interpretation
Likelihood Distance,ψ,Change in ML log-likelihood for all data with ψ estimated using all data versus reduced data,Overall influence,Larger values indicate that omitting the observations in u significantly decreases the model’s likelihood.
Restricted Likelihood Distance,ψ,Change in REML log-likelihood for all data with ψ estimated using all data versus reduced data,Overall influence,Larger values indicate that omitting the observations in u significantly decreases the model’s likelihood.
Cook’s Distance,β,Scaled change in estimated β vector,Change in parameter estimates,Larger values indicate that the observations in u have a larger influence on the parameters in β or θ.
Cook’s Distance,θ,Scaled change in estimated θ vector,Change in parameter estimates,Larger values indicate that the observations in u have a larger influence on the parameters in β or θ.
Multivariate DFFITS Statistic,β,Scaled change in estimated β vector using the “externalized” Var[β̂],Change in parameter estimates,Larger values indicate that the observations in u have a larger influence on the parameters in β or θ.
Multivariate DFFITS Statistic,θ,Scaled change in estimated θ vector using the “externalized” Var[θ̂],Change in parameter estimates,Larger values indicate that the observations in u have a larger influence on the parameters in β or θ.
Covariance Ratio,β,Change in precision of estimated β vector based on the determinant of Var[β̂],Change in precision of parameter estimates,A ratio of 1 indicates that omitting u has no effect on the parameters in β or θ. A ratio significantly different from 1 indicates that omitting u improves the precision of the parameters in β or θ.
Covariance Ratio,θ,Change in precision of estimated θ vector based on the determinant of Var[θ̂],Change in precision of parameter estimates,A ratio of 1 indicates that omitting u has no effect on the parameters in β or θ. A ratio significantly different from 1 indicates that omitting u improves the precision of the parameters in β or θ.
Predicted Residual Error Sum of Squares (PRESS) Statistic,N/A,Sum of squared PRESS residuals calculated by deleting observations in u,Effect on predicted value,Larger values indicate that omitting the observations in u significantly reduces the accuracy of predicted values.
Random Effect Diagnostics: Define and 2 characteristics
Diagnose random effects by looking at the EBLUPs
EBLUPs do not have to follow the true distribution of the random effects, so checking them for normality is not needed.
Focus on identifying potential outliers, as an unusually small or large EBLUP could point toward an abnormality within the corresponding group.
Observed vs Predicted Values
Plot the observed response values against the conditional predicted values to verify a model's accuracy
We hope to see a roughly linear relationship between observed and predicted values. If these values are not similar, our model may not be adequate.
Aliasing
When there is ambiguity in the specification of a parametric model that would lead to multiple possible sets of parameters that each imply identical or indistinguishable models.
Intrinsic Aliasing vs Extrinsic Aliasing vs Nonestimability
Intrinsic Aliasing – Aliasing due to a model's formula specification.
Sometimes referred to as "nonidentifiability" or "overparameterization"
Extrinsic Aliasing – Aliasing due to characteristics of the dataset.
Nonestimability - A result of aliasing. This implies that infinitely many sets of parameters would lead to the same predicted values.
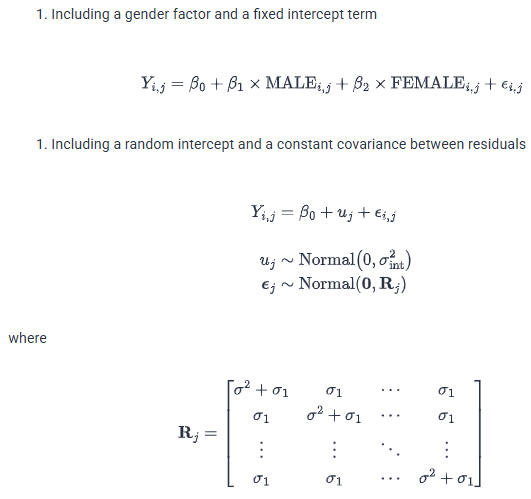
2 Common Examples of Alaising
Including a gender factor and a fixed intercept term
Including a random intercept and a constant covariance between residuals
Missing Data - What LMMs can handle and assumption for missing data
LMMs are better at handling datasets that have different-sized groups or missing observations than alternatives such as repeated-measures ANOVA.
LMMs assume that any unobserved data is missing at random, meaning that the probability of having missing data on a given variable may depend on other observed data, but cannot depend on the data that would have been observed.
Centering Covariates - Grand Mean Centering
The overall mean of a covariate is subtracted from each observation.
Changes the interpretation of the intercept, but not the corresponding coefficient.
Centering Covariates - Group Mean Centering
The mean covariate value for a higher-level cluster or group is subtracted from each observation.
Changes the interpretation of the intercept and the corresponding coefficient.
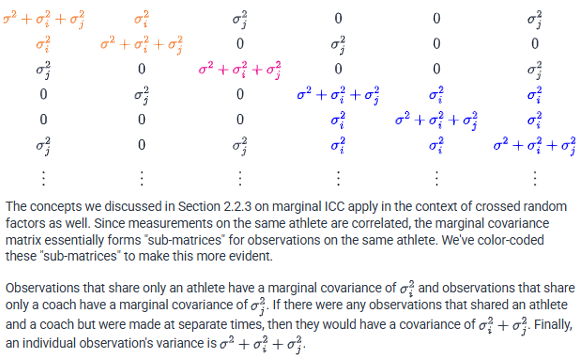
Crossed Random Factors: Define, model change, estimation change, testing parameters, changes to the implied marginal covariance matrix
A model with multiple random factors whose levels do not have a specific nesting structure
Adds a random factor v_i to the model (level 2)
Changes estimation (sparse matrices)
Testing - Likelihood Ratio
Changes form of the implied marginal covariance matrix