QQM: topic 2: sampling and generalizability
1/36
There's no tags or description
Looks like no tags are added yet.
Name | Mastery | Learn | Test | Matching | Spaced | Call with Kai |
|---|
No analytics yet
Send a link to your students to track their progress
37 Terms
types of variables
quantitative
qualitative
quantitative variables
measured on numeric scale = numerical
discrete (counted items) or continuous (measured characteristics)
examples:
number of defective items in a lot (discrete)
salaries of CEO’s of oil companies (discrete)
ages of employees at company (continuous)
weight of 12 years old children (continuous)
number of children in class (discrete)
voltage of electric kettles (continuous)
qualitative variables
classified into defined categories = categorical
examples
college major of each student in a class
gender of each employee at a company
method of payment
marital status
political party
eye color
types of data
longitudinal
cross sectional
longitudinal data
data values observed over time
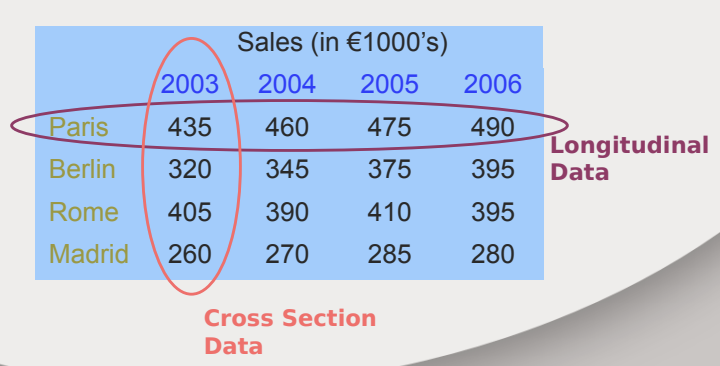
cross section data
data values observed at a fixed point in time
longitudinal designs
= repeated cross-sectional or trend designs
data collected at 2 or more points in time from (different) samples of the same population
panel designs and cohort designs
panel designs
data are collected from the same individuals (the panel) at two or more points in time
cohort designs
data are collected at 2 or more points in time from individuals in a cohort (common starting point)
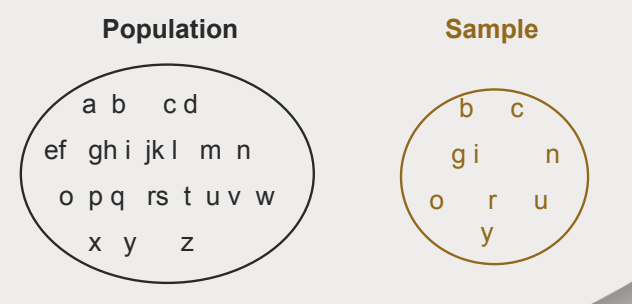
population
the collection of all items of interest or under investigation, often too many experimental units in a population to consider every one
=> if we can examine every single one we conduct a census
N
population size
sample
observed subset of the population
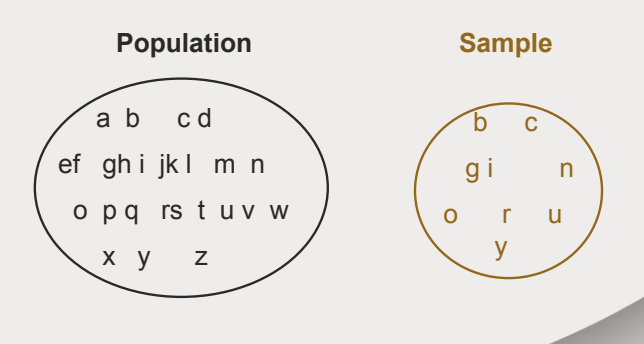
n
sample size
why sample?
less time consuming than a census
less costly to administer than a census
well-designed sampling strategy can result in a representative sample of the same population at far less cost
=> it is possible to obtain results of sufficiently high precision based on samples
preparing a sample
define sample components and the population
evaluate generalisability
asses diversity of the population
sample involves
elements (only from population from which it was drawn)
sampling frame
sample generalisability
can findings be generalised to the population from which the sample was extracted?
cross-population generalisability
can findings be generalised to another somewhat different population
target population
set of elements (larger than the sample) to which the researcher would like to generalise the study findings
representative sample
the distribution of characteristics among the elements of the sample is the same as the distribution among the total population
unrepresentative sample
some characteristics are overrepresented or underrepresented
sampling methods
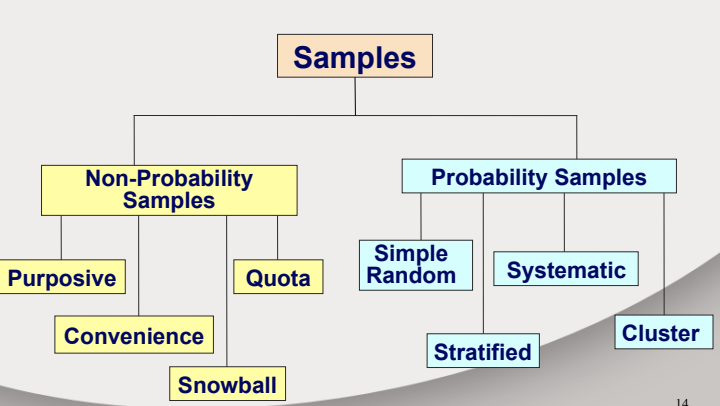
probability sampling
rely on a random/chance selection method so that the probability of selection of population elements is known
items of the sample are chosen based on known or calculable probabilities
more useful than non-probability samples when goal is to generalize
allow researchers to use the laws of chance to draw samples => must be well-designed to get a representative sample
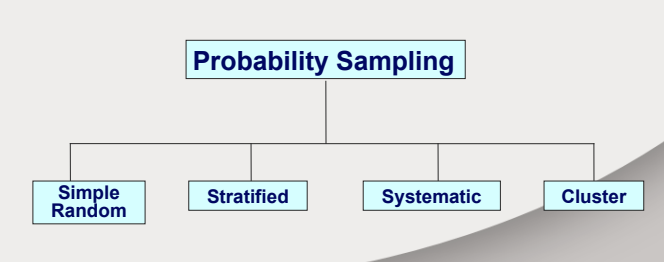
common problems probability sampling
incomplete sampling frame
non-response
bias
some population characteristics are overrepresented or underrepresented because of particular features of the method of sample selection
the larger the sample (probability sampling)
the higher the confidence in the sample’s representativeness
the more homogeneous the population (probability sampling)
the higher the confidence in the sample’s representativeness
simple random sampling
every individual from the population has an equal chance of being selected
ways of identifying cases
random number table
random digit dialing (RDD)
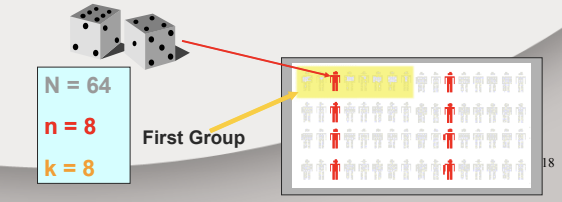
systematic sampling
decide on sample size n
divide frame of N individuals in groups of k individuals: k=N/n
randomly select one individual from the 1st group
select every kth individual thereafter
may not be random if sequence has periodicity
cluster sampling
population divided into several “clusters” each representative of the population
a simple random sample of clusters is selected
all items in the selected clusters can be used, or items can be chosen from a cluster using another probability sampling technique
useful when sampling frame is not available
sampling error is greater

stratified sampling
population divided into subgroups (strata) according to some common characteristic
ensures that various groups within the sampling frame will be included
simple random sample selected from each subgroup
samples from subgroups are combined into one
proportionate stratified sampling vs disproportionate stratified sampling

proportionate stratified sampling vs disproportionate stratified sampling
disproportionate stratified sampling used to ensure that cases from smaller strata are included sufficiently

non-probability sampling
items of the sample are not chosen based on known or calculable probabilities but using a subjective method
used to get in-depth understanding of a small group

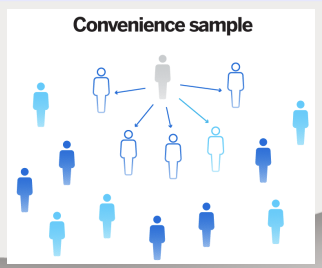
availability or convenience sampling
elements are selected on the basis of convenience
useful in a new setting or in exploratory studies
often masquerades as more rigorous form of research
quota sampling
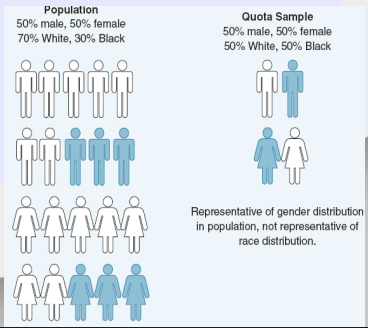
may be representative on quota characteristics but no other way
must know relevant characteristics of entire population
if a random sample cannot be drawn, it is better to use a quota sample than no quota
purposive sampling
elements are selected for a purpose, usually because of their unique position
informants should be
knowledgeable
willing to talk
representative
must pass completeness and saturation tests
what you hear provides an overall sense of the meaning of a concept, theme or process
you gain confidence that you are learning little that is new from subsequent interviews
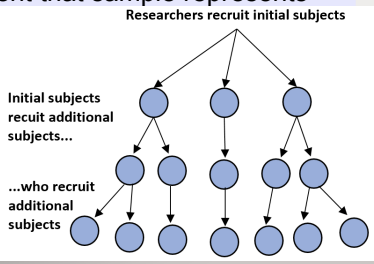
snowball sampling
elements are selected as successive informants or interviewees identify them
used for hard-to-reach or hard-to-identify interconnected populations
normally cannot be confident that sample represents total population of interest
