Population Ecology - Chapter 53
1/83
There's no tags or description
Looks like no tags are added yet.
Name | Mastery | Learn | Test | Matching | Spaced | Call with Kai |
|---|
No analytics yet
Send a link to your students to track their progress
84 Terms
“Either a species learns t control its own population, or something like disease, famine, and war will take care of the issue” Who said/wrote this?
Chuck Palahniuk
How biotic and abiotic factors influence size, distribution, density, and composition of populations
Population Ecology
What is population?
A group of individuals of a single species living in the same area at the same time
Define Density
Number of individuals per unit area or volume
Define Distribution
The way in which individuals are spaced within a population
There are 3 patterns of distribution
Within a population’s geographic range, what creates contrasting patterns of dispersion?
The availability of resources, environmental conditions, and interactions among individuals impacting local densities which can differ substantially
What are the three Patterns of Dispersion?
Clump Distribution
Random Distribution
Uniform Distribution
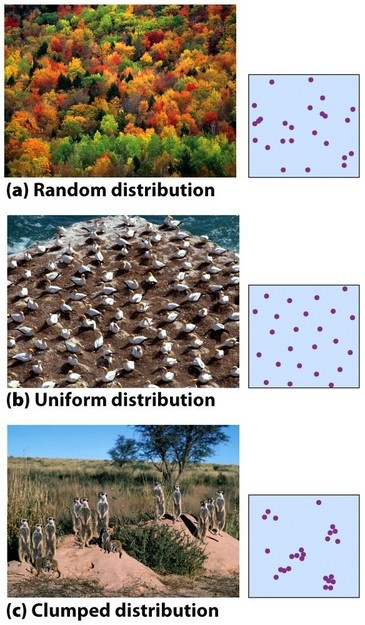
Individuals that are found in groups or patches within their particular habitat. The presence of other individuals increases their fitness. Usually prey, few predators (wolves) This is known as…
Clump Distributions
When does Random Distribution usually occur?
When there is an absence of strong attractions or repulsion’s from among individuals
Define Random Distribution
Individuals are spread out in the environment irregularly; the position of one individual is independent of another.
What results from direct negative interaction between individuals?
Uniform Distribution and Territoriality
Uniform Distribution is…
a distribution pattern where individuals are evenly spaced in an environment due to competition or territorial behavior.
-Rare in nature
-Presence of one hinders another
-Distance between individuals is maximized
Territoriality
a behavior exhibited by individuals to defend and maintain exclusive use of a specific area, often to secure resources such as food, mates, or nesting sites. Boundaries are created
What are ways to calculate population distribution?
1.Census
2.Survey
What does the Census do?
Counts every individual in the population
*The MOST accurate but usually not feasible/practical
What does a Survey do?
Estimates population size by sampling a subset of individuals instead of counting them all, then extrapolating to the geographic range.
*Can be modified based on pop size and geographic range THOUGH some info about the population is needed beforehand, usually feasible/practical
Survey is most effective when
Uniform Distributed or Random Distribution is occuring
Survey NOT effective when…
Clump Distribution is occurring
Survey Types
1.Area/Volume (quadrant) based survey
2.Line Survey (transect), counting as you move along a line - immobile and mobile organisms, not effective if geographic range is large
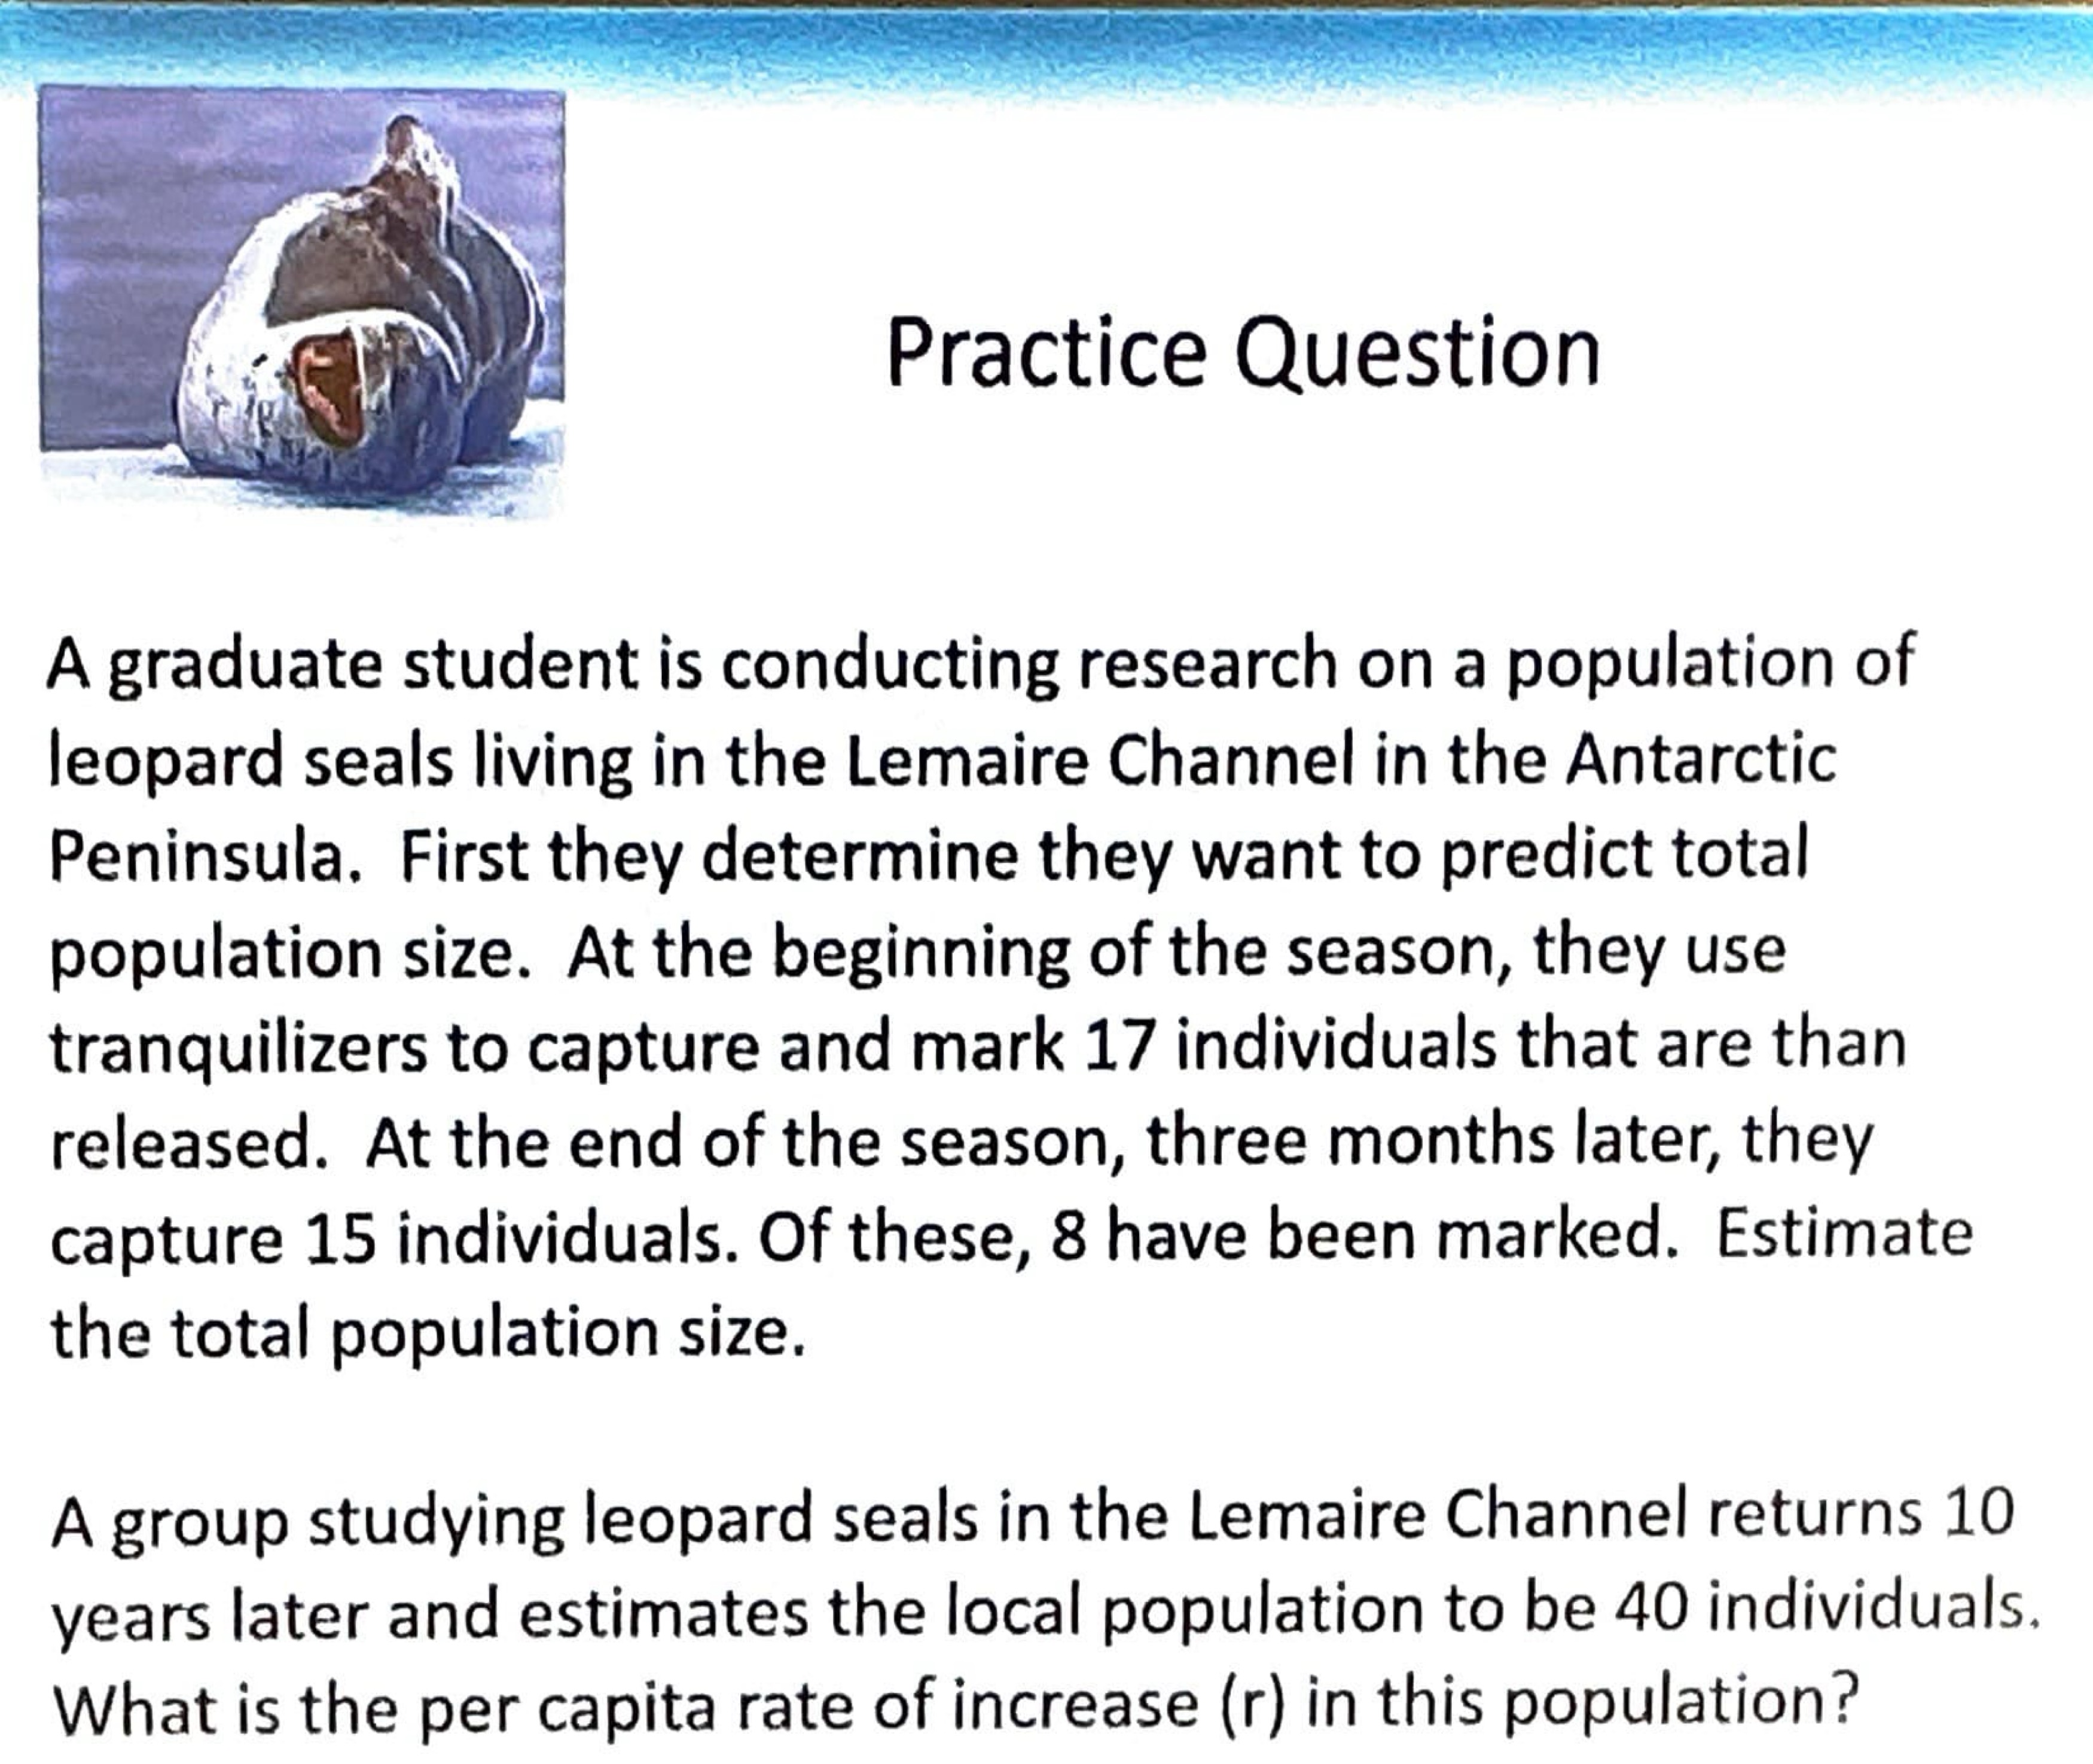
3.Mark and Recapture survey - VERY effective for birds and large mammals (mobile populations)
Photography
Drones
Physical capture
Nests, burrows, or fecal droppings as indicator(s)
How to calculate population size from Mark and Recapture Density?
Example of how to calculate density
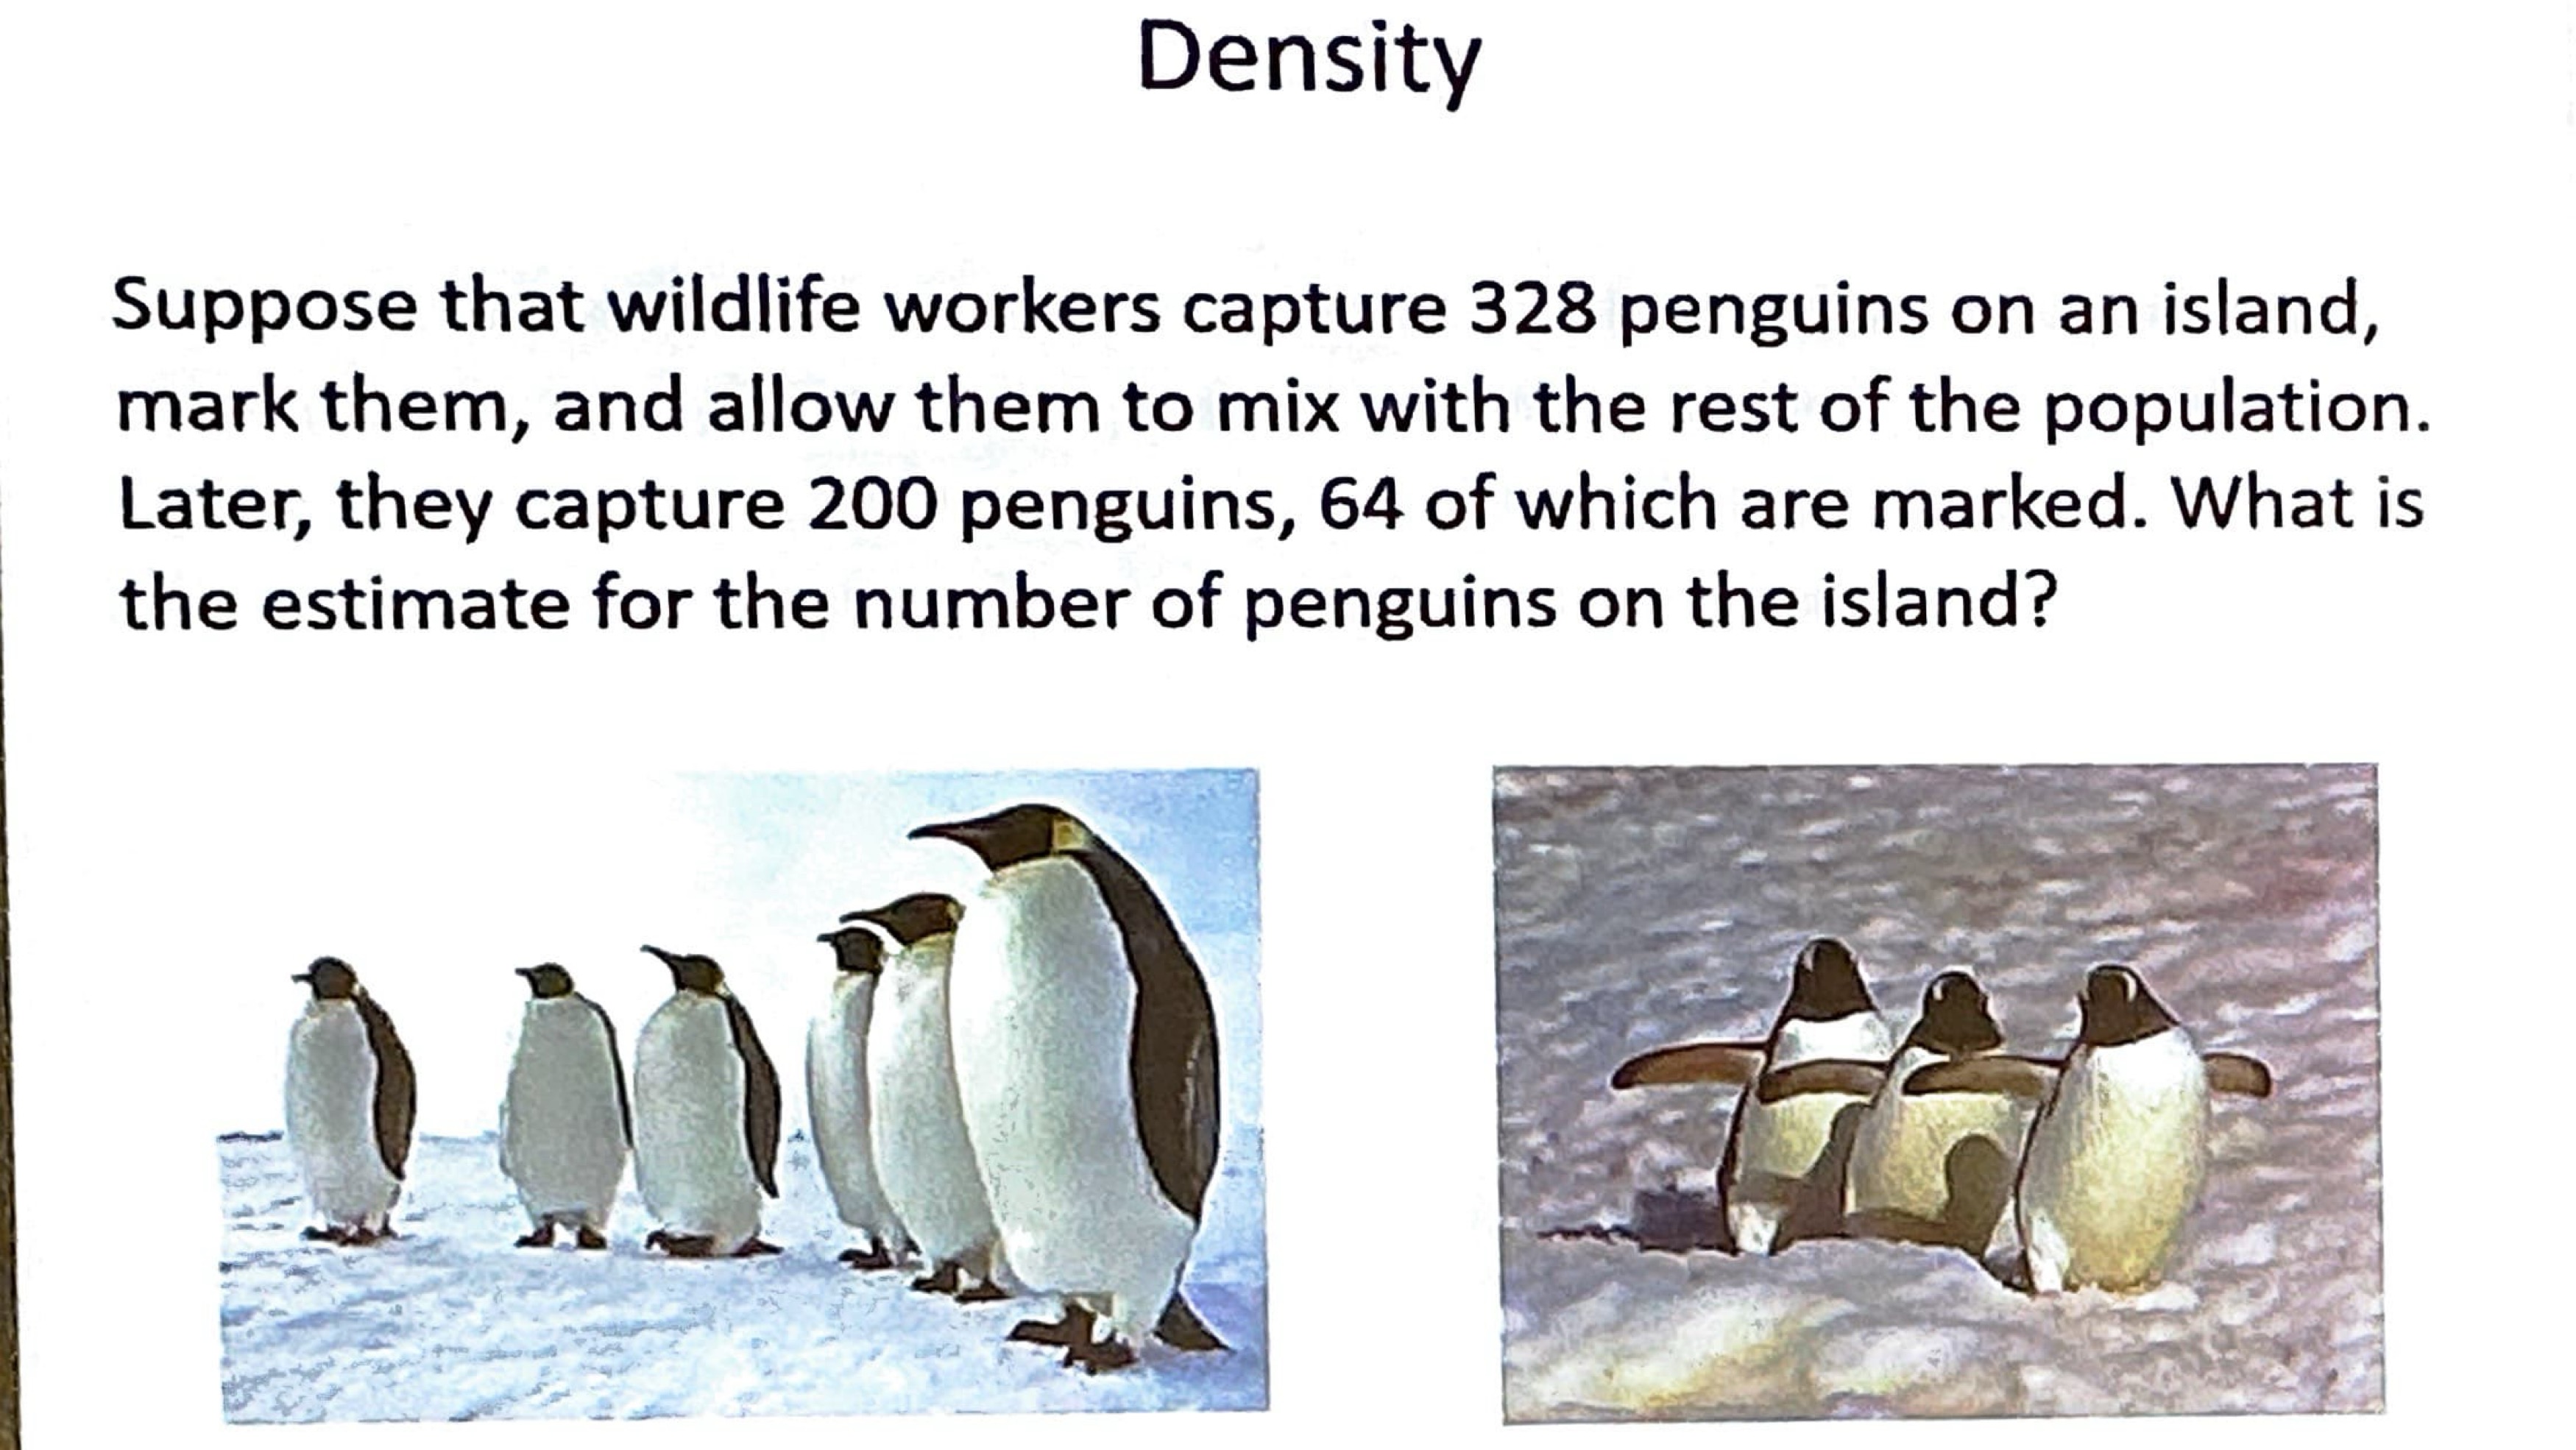
N = (S*n)/x
N = (328)(200)/64
N = 1025 individuals
Density is a static property. True or False?
False; density is constantly changing based on individuals being added or removed from the pop.
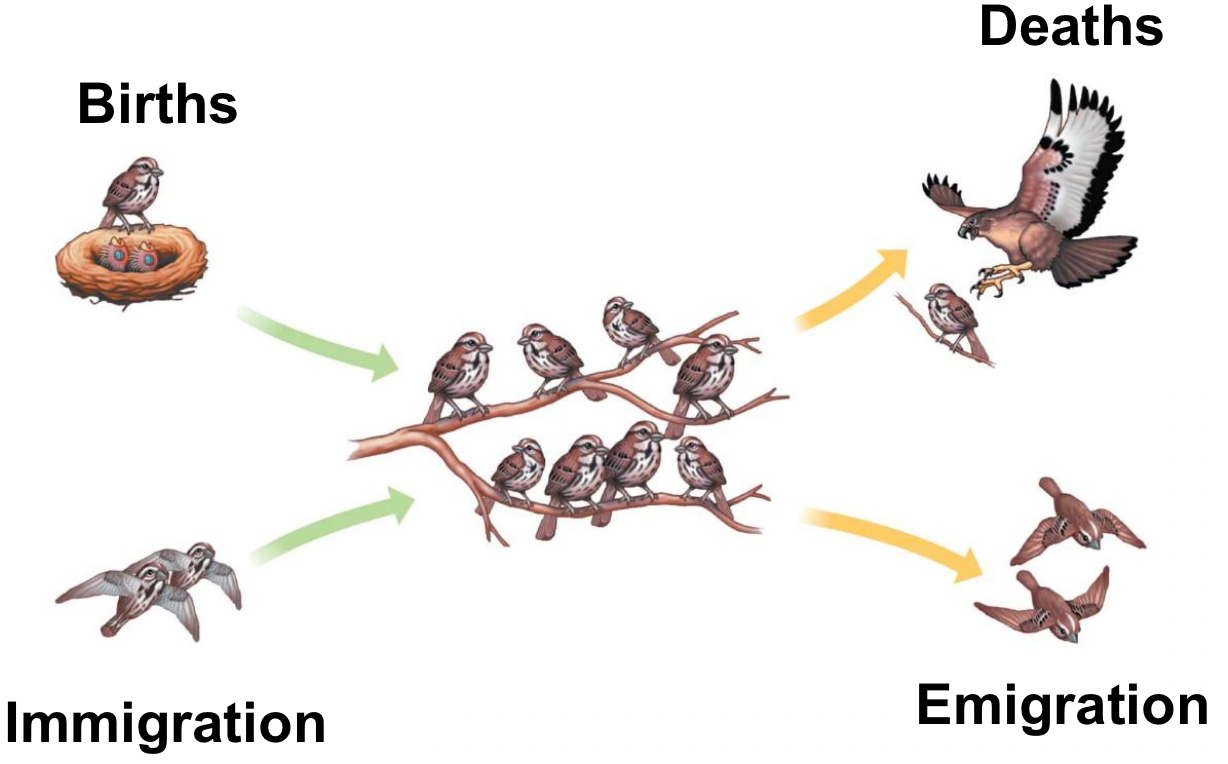
Immigration
Influx of new individuals from another pop
Example: southern border in U.S.
Emigration is the movement of individuals where?
Movement of individuals out of a pop.
Birth…
adds individuals to the population (all forms of reproduction)
Death…
removes individuals from a population
Define Demography
The study of the vital statistics of a population and how they change over time
Often done using life tables
What are Life Tables and what do they do?
A age-specific summary of the survival pattern of a population
Developed in the 1950s for insurance companies
Uses cohort: group of individuals of the same age
Can be dynamic (horizontal) or static (vertical)
Provide “snapshot” of a pop at ALL life stages at same time
There are 3 main types
????Types of Life Tables
Cohort Table - follows groups of same aged individuals from birth until they all die
Static Life tables - made from data collected from all ages at one time
TWO types of tables are theoretically identical if
the environment is not changing
The population is at equilibrium (B=D, I=E)
Static Life Table
A type of life table that summarizes the mortality and survival rates of a population from data collected at one specific point in time.
Static/stationary (vertical)
A specific point in time of all individuals regardless of age
Cohort Table
Dynamic (horizontal)
Follows one (1) group of same-age individuals
Single breeding season in throughout their lives
Much harder to do
Takes more time and money
Takes into account birth until death
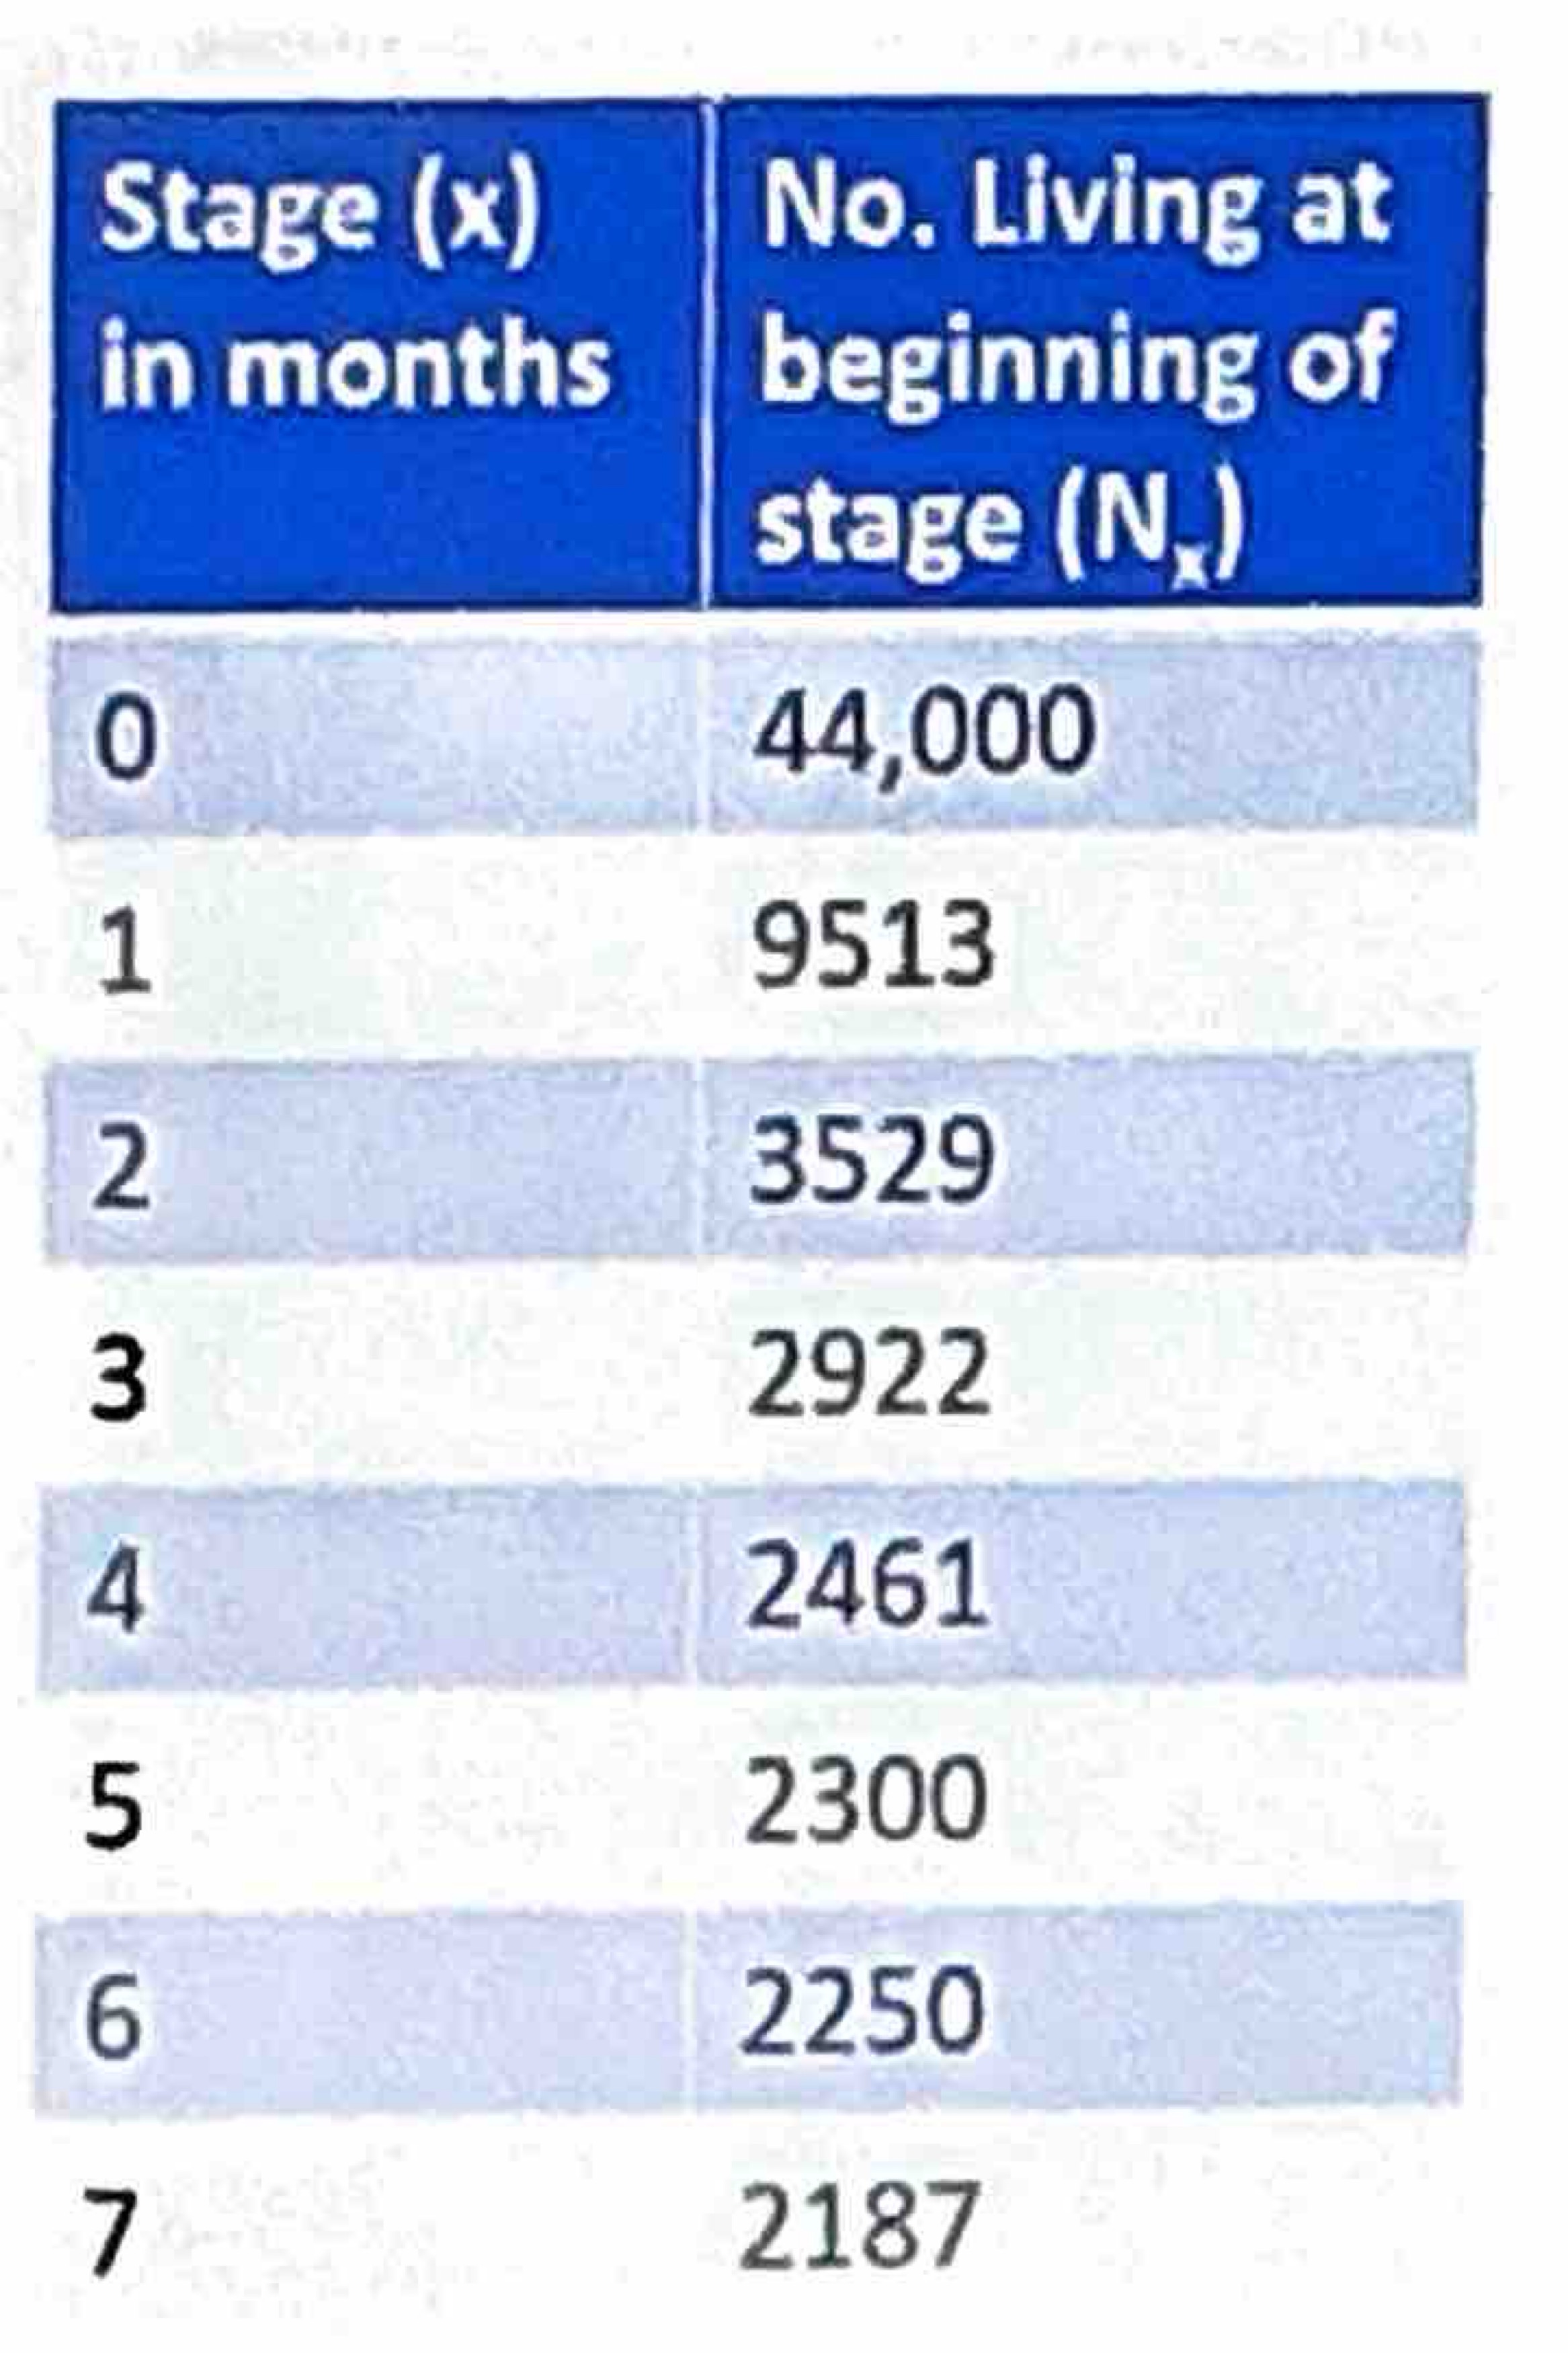
The first column (x) specifies the age class while the second column (Nx) is the number of individuals at start of each age class
As (x) increases, (Nx) is equal to or less than the previous (Nx) value
Demographic types
Semelparity
Iteroparity
Semelparity
Have only ONE reproductive event in their lifetime
*Semel meanings “once” in Latin
Iteroparity
Capable of multiple reproductive events
*Itero meaning “repeat” in Latin
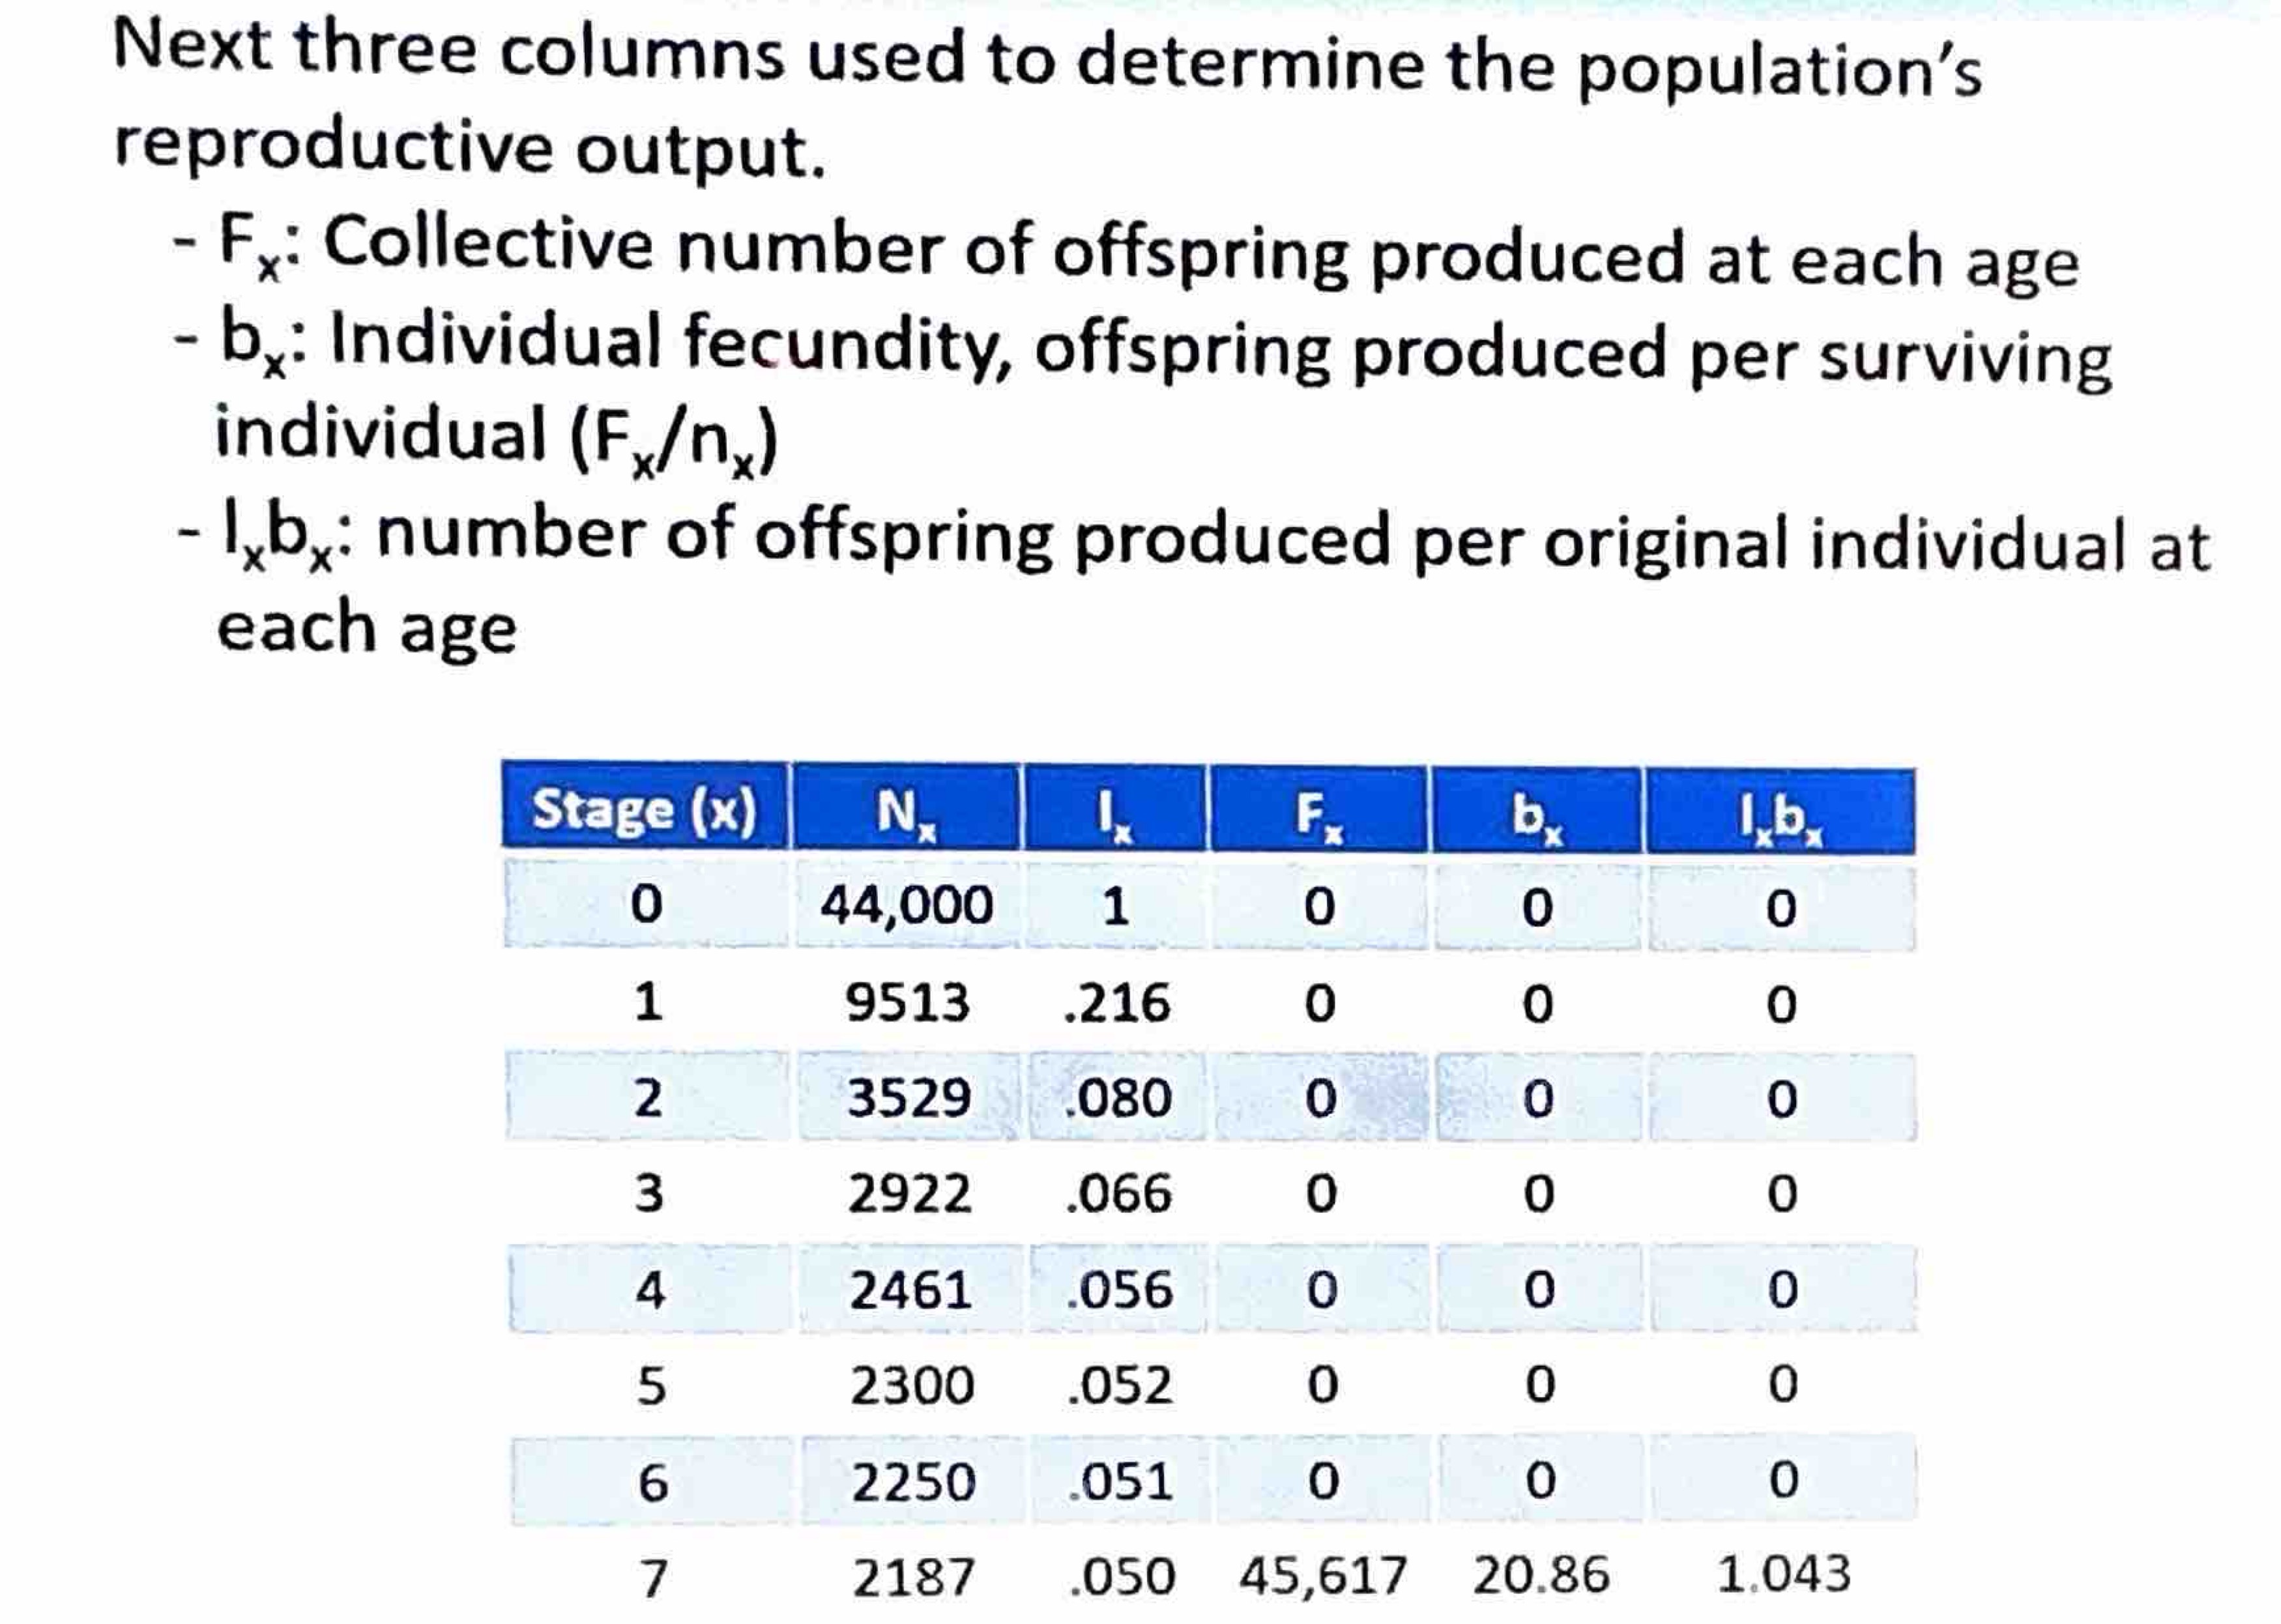
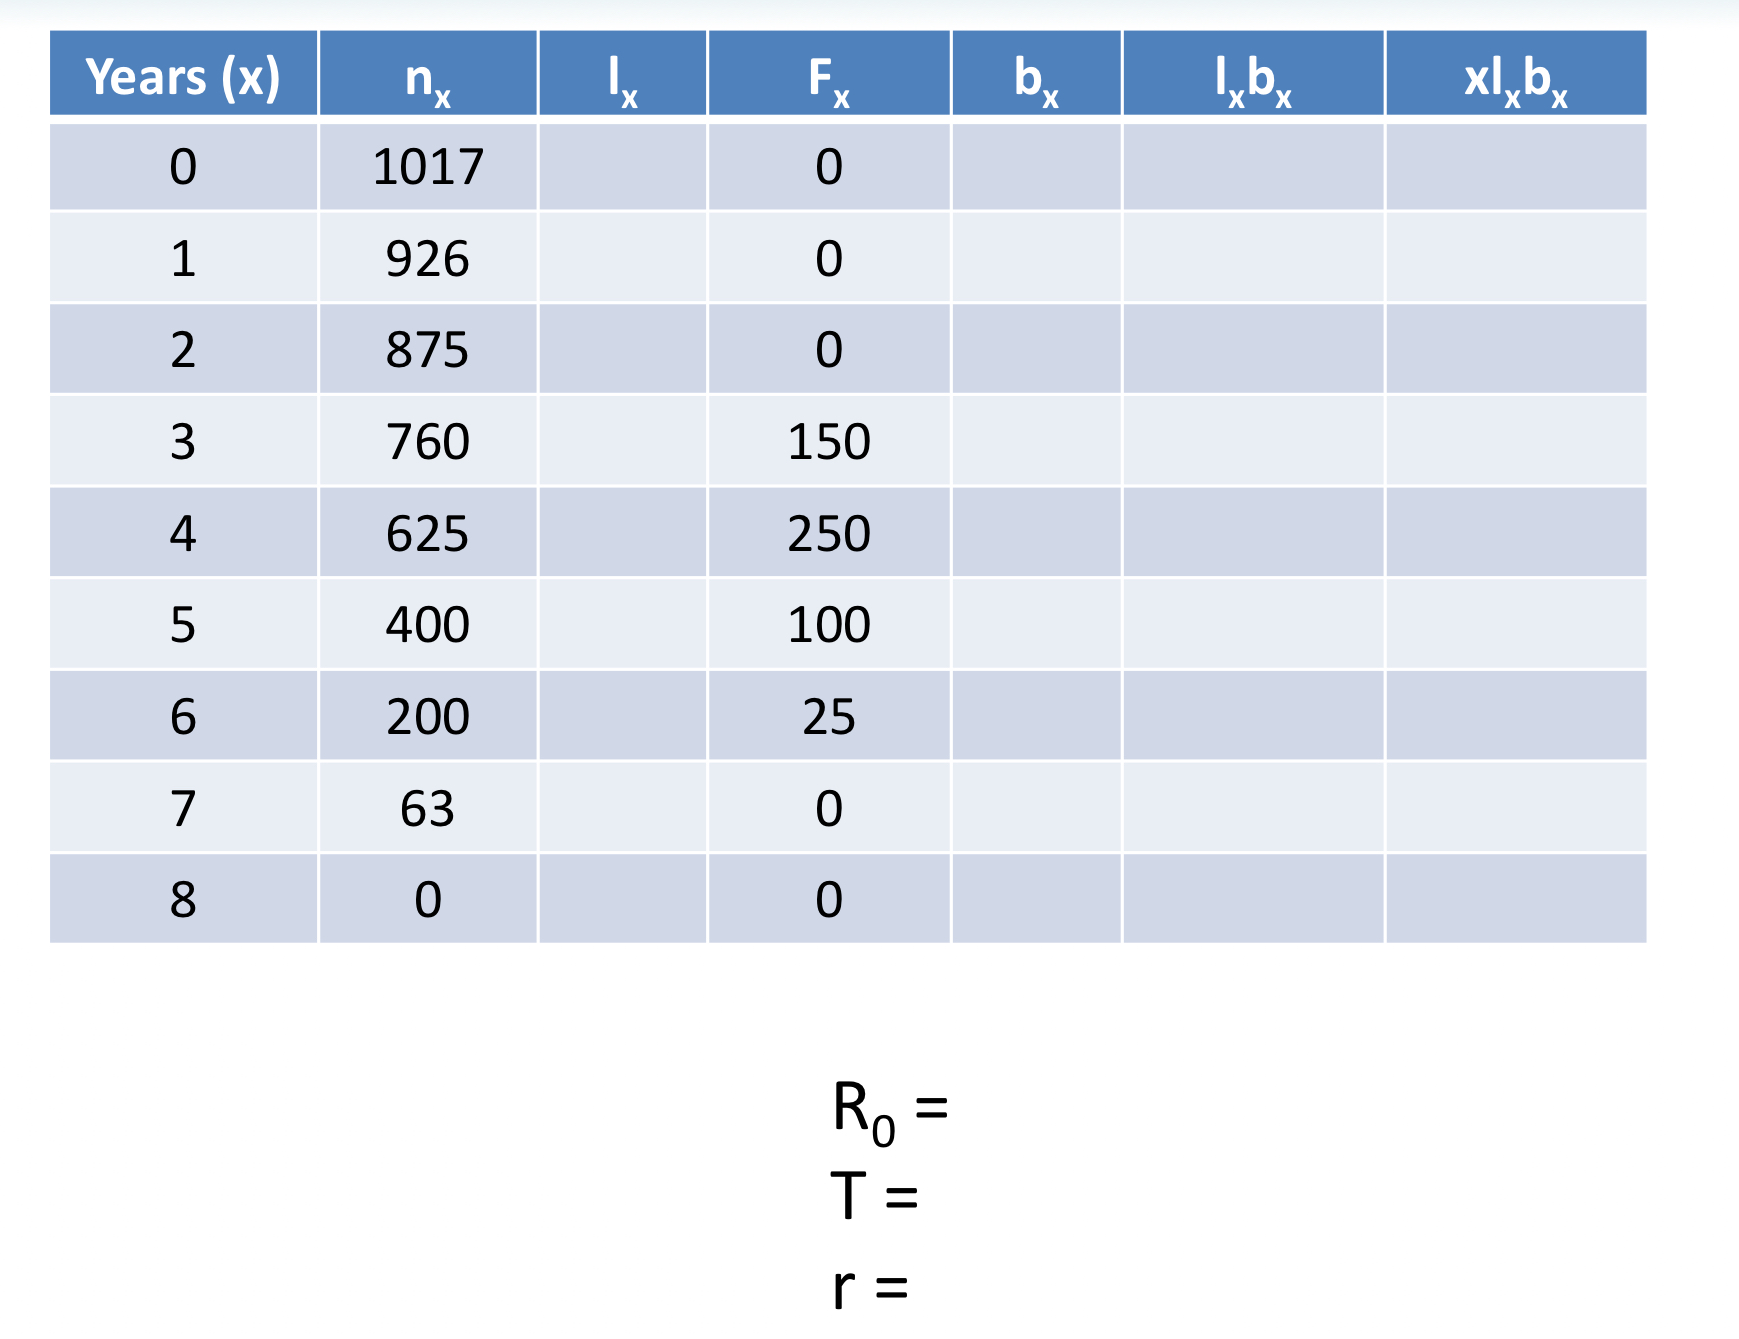
Life Table variables/demographics for semelparous organism
x —> age or stage of individuals in the population
nx—> # of individuals at start of each age class
Ix—> proportion surviving to each age class in comparison to the starting # of individuals at age class 0
Fx—> number of offspring produced by each female at each age class
bx—> average number of offspring per individual in a specific age class
Ixbx —># of offspring produced per original individual at each age
Ixbx accounts for all ages; you can calculate the net reproductive rate (R0)
T —> generation time or the time it takes one cohort to replace itself in the population
r —> per capita rate of increase
How to calculate The Net Reproductive Rate (R0) aka the population’s replacement rate
Sum of lxbx, which is the # of offspring produced per original individual at each age
1.043; population is growing
If R0 = less than 1; population is declining
If R0 = 1; population is replacing itself
If R0 = greater than 1; population is growing
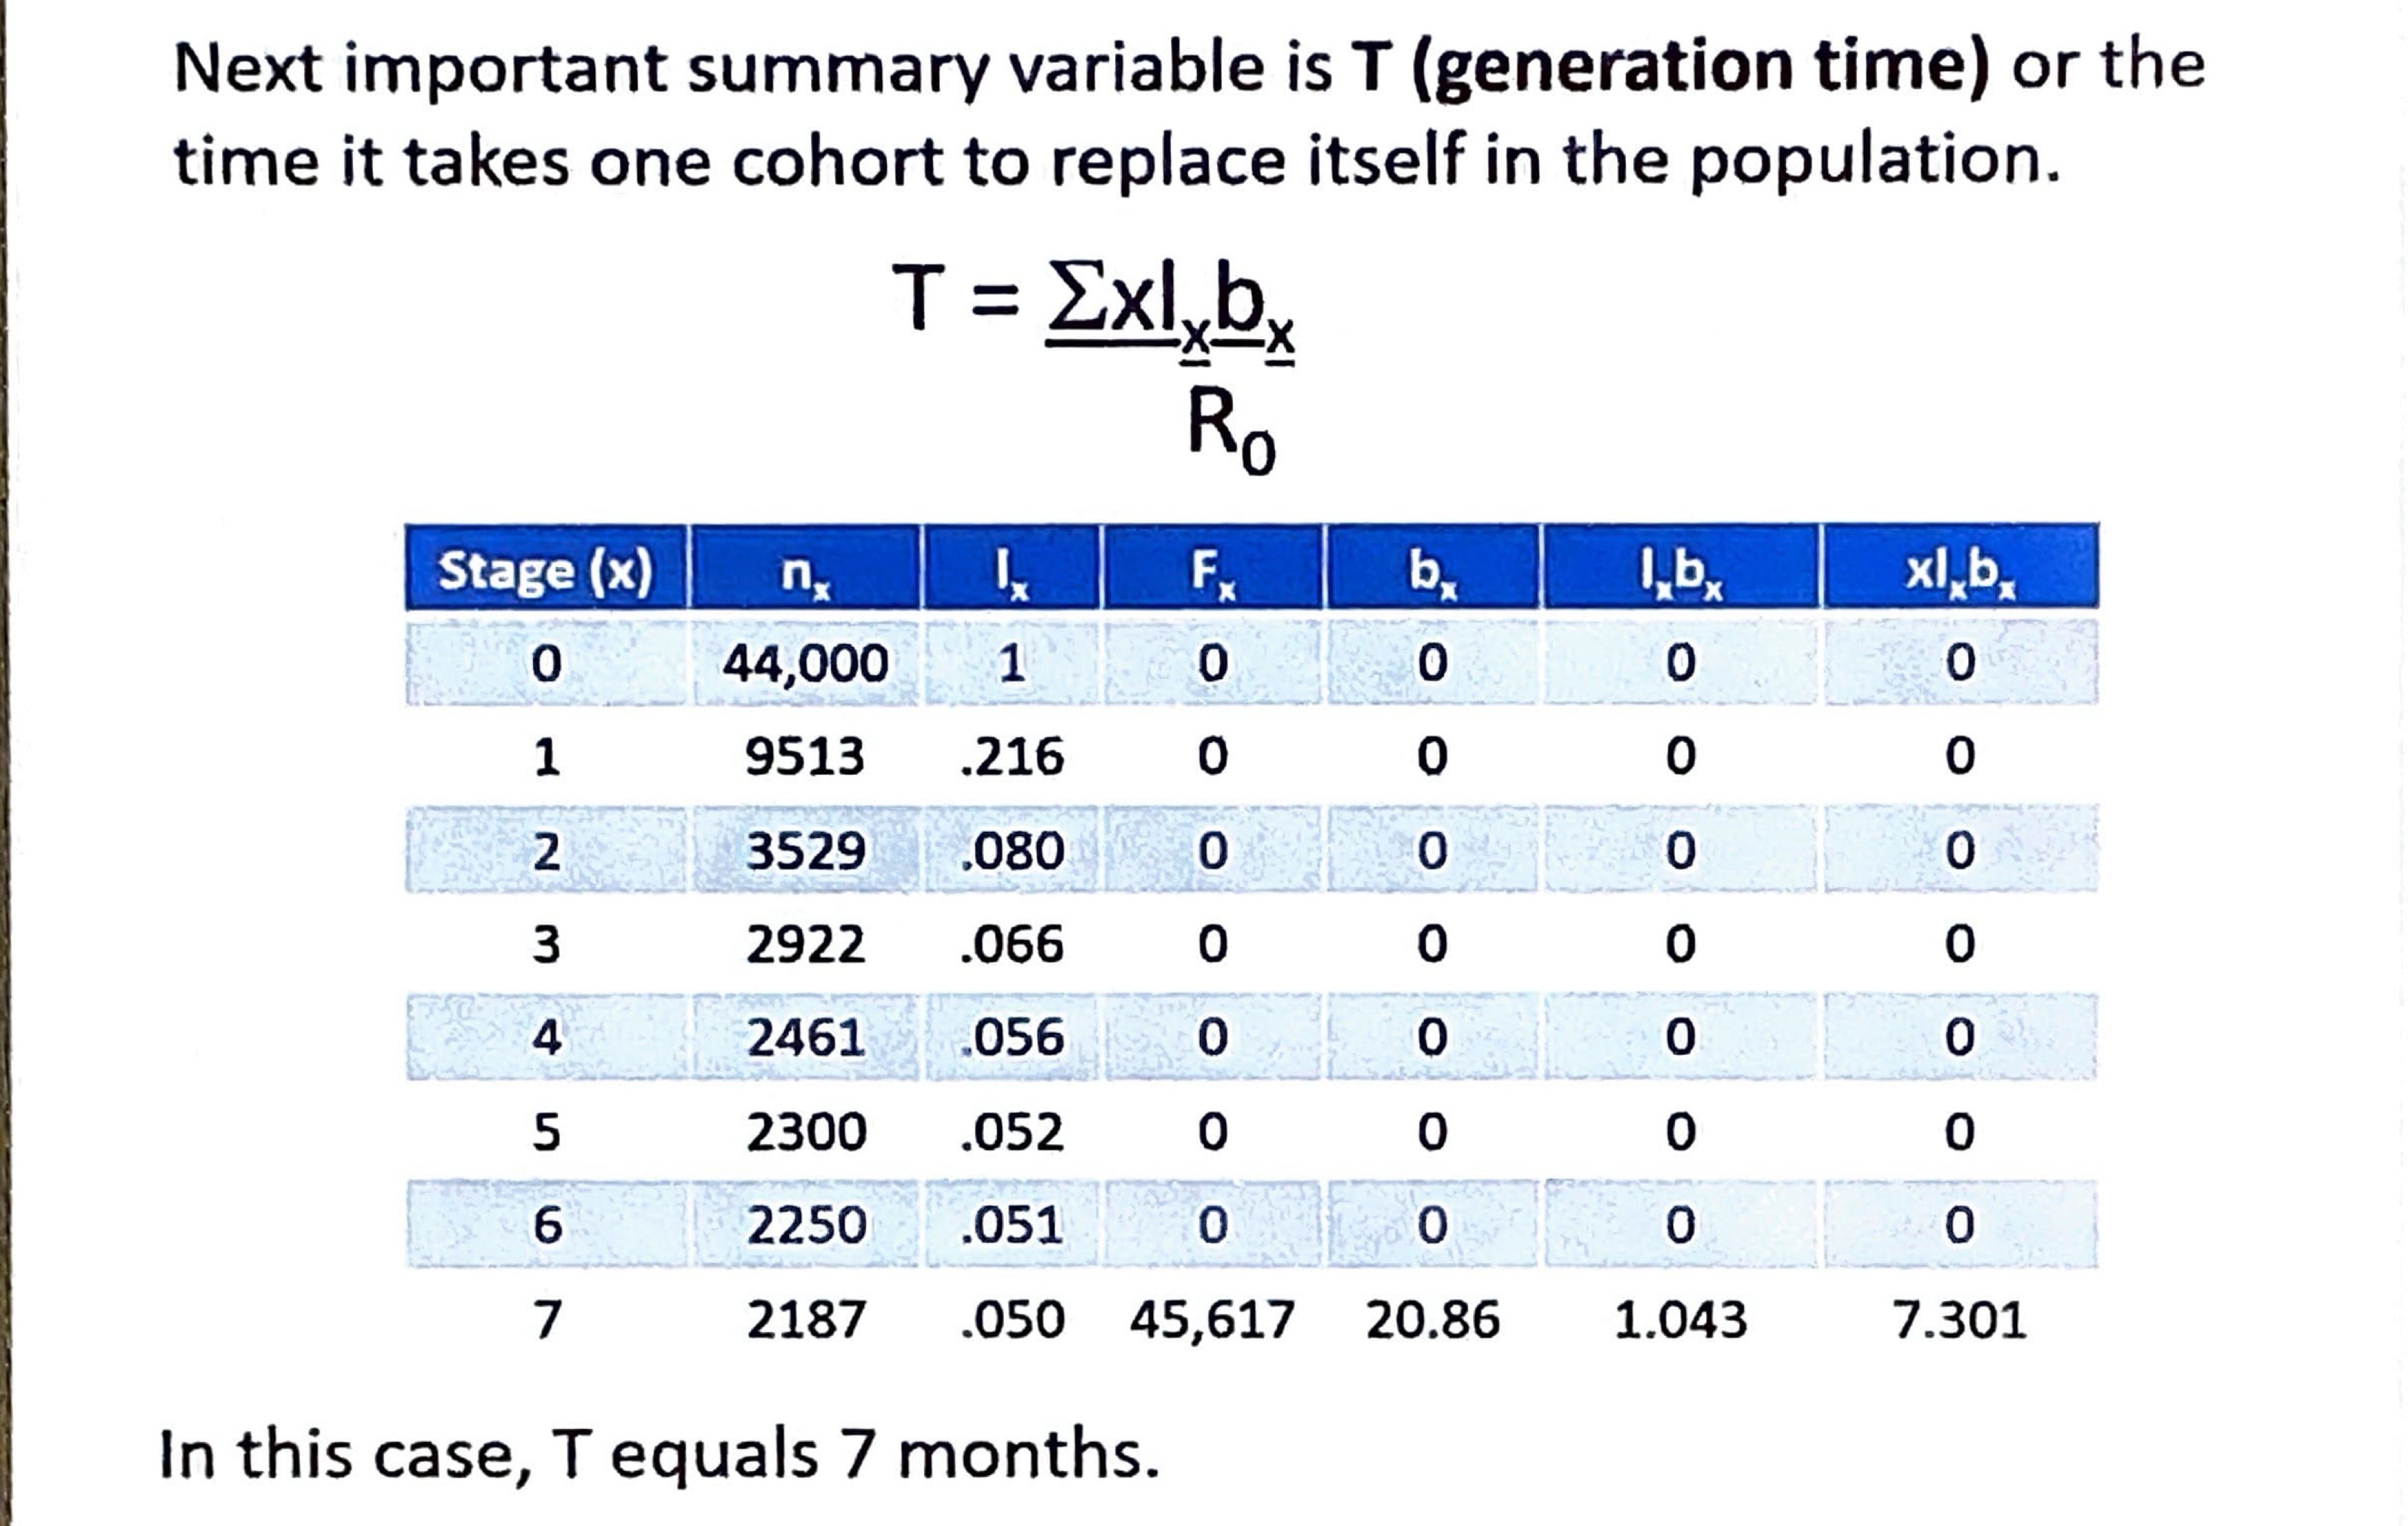
What does T represent and how is it calculated
T represents the generation time
In this case, T = 7 months
x*lx*bx divided by sum of Ix*bx (R 0)

What is r and how is it calculated?
Per capita rate of increase
In(R0) divided by T
If r = less than 0; the population is decreasing in size
If r = 0; population size will remain constant
If r = greater than 0; population is increasing in size
Solve
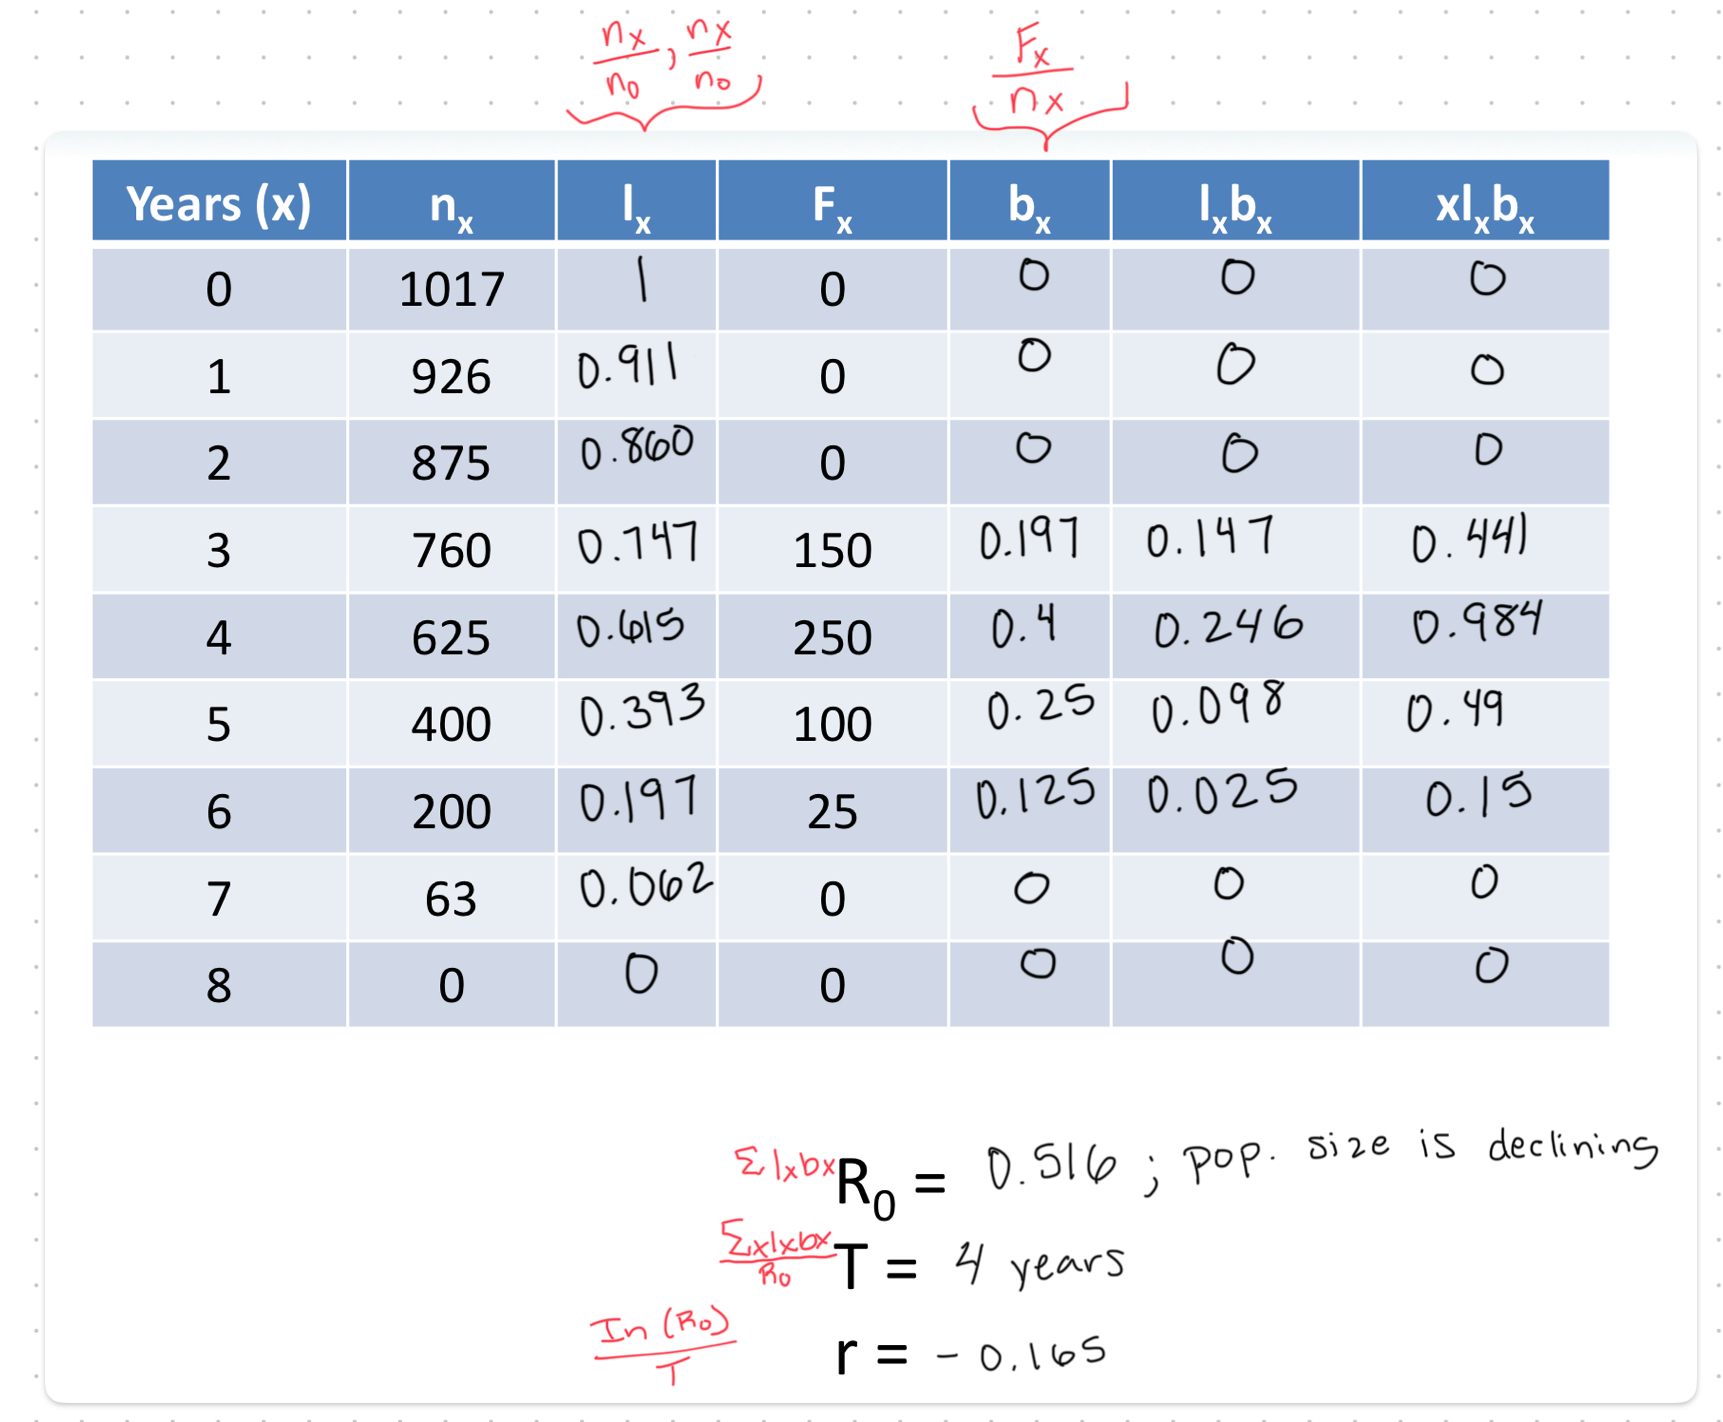
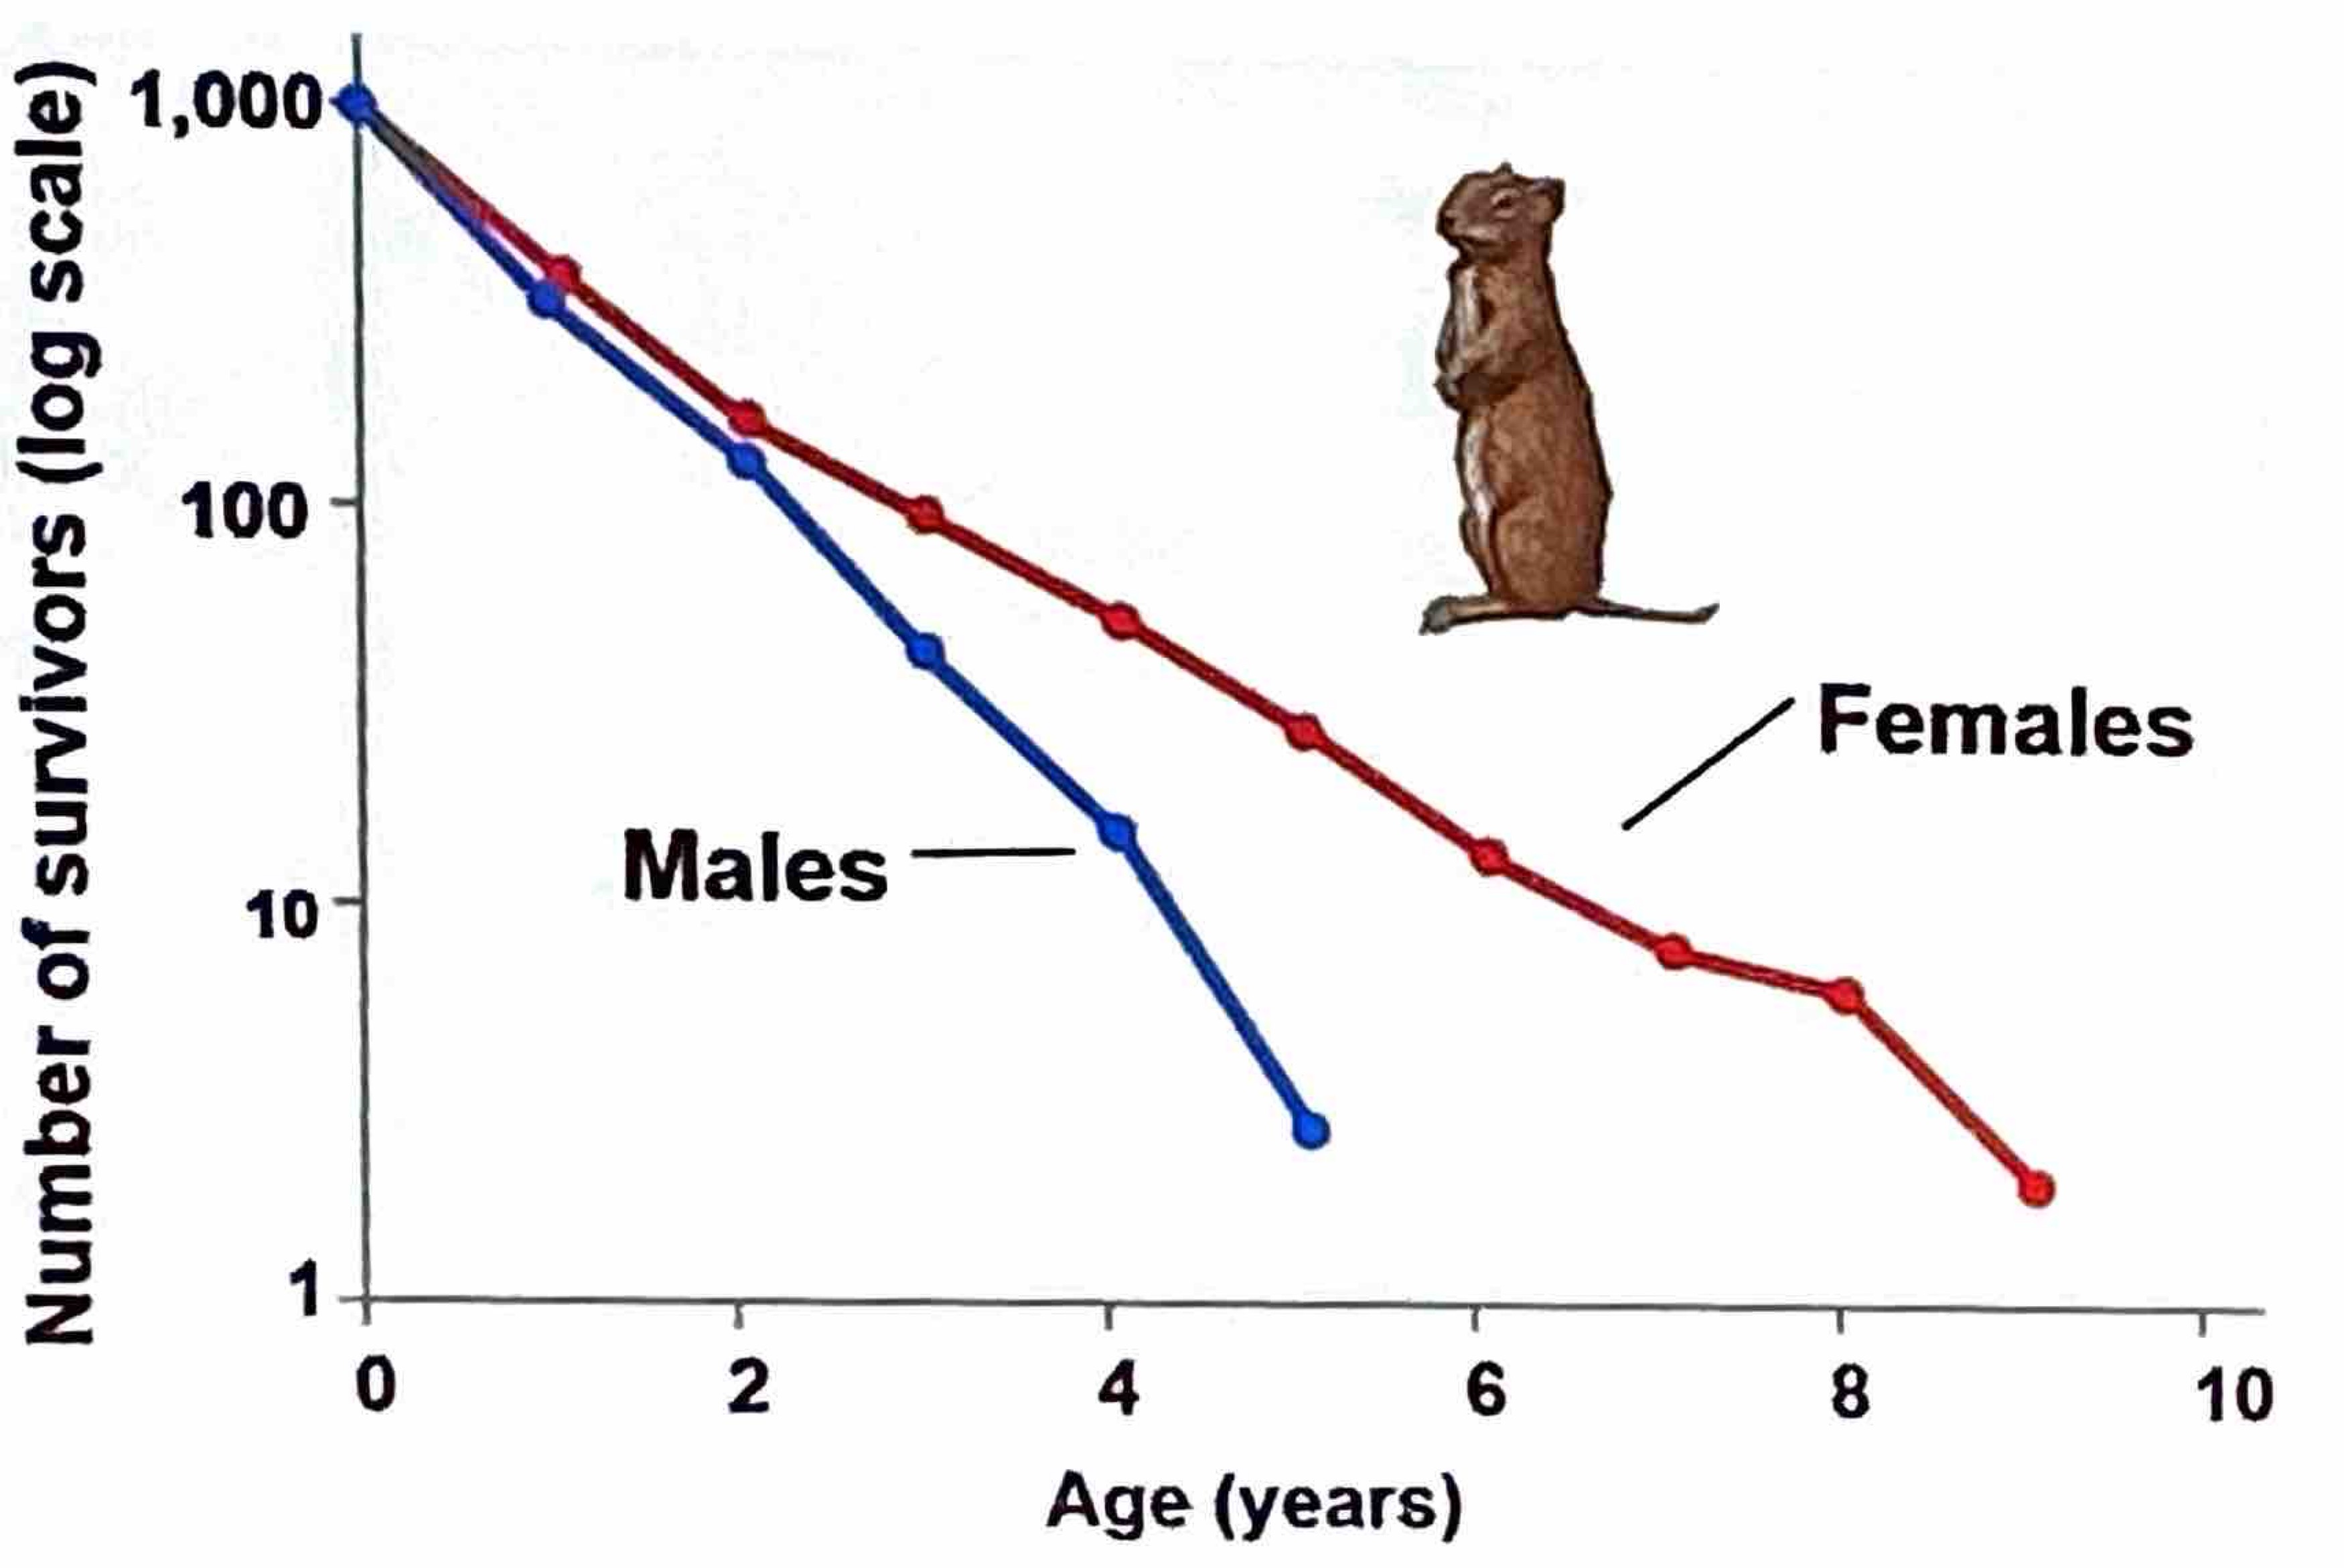
What is a Survivorship Curve?
a graphical way of representing the data presented in a life table
plot of Nx vs x (on log scale)
Is extrapolated to begin with cohort of convenient size (1000 individuals)
Has 3 classifications
What are the three general idealized types/classifications of Survivorship Curves?
Type I, Type II, Type III
Type 1 represents
Low death rates during early and middle life
Increase in death rates among older age groups
-Animals that provide parental care
-Examples include humans and many large mammals.
Type 2 represents
A constant death rate over the organism’s life span
-Birds
-Small mammals
-Crustaceans that molt/shed
Type 3 represents
High death rates for the young
Lower death rate for survivors
-Larvae
How to calculate rate of increase per capita (change in population)?
Births
+
Immigrants entering population
-
Deaths
-
Emigrants leaving population
If immigration and emigration are ignored, how is a population’s growth calculated?
Births minus Deaths
How can births and deaths be expressed as the average number of births and deaths per individual over a specified time frame
B = bN = where b annual per capita birth rate
D = men = where m annual per capita death rate
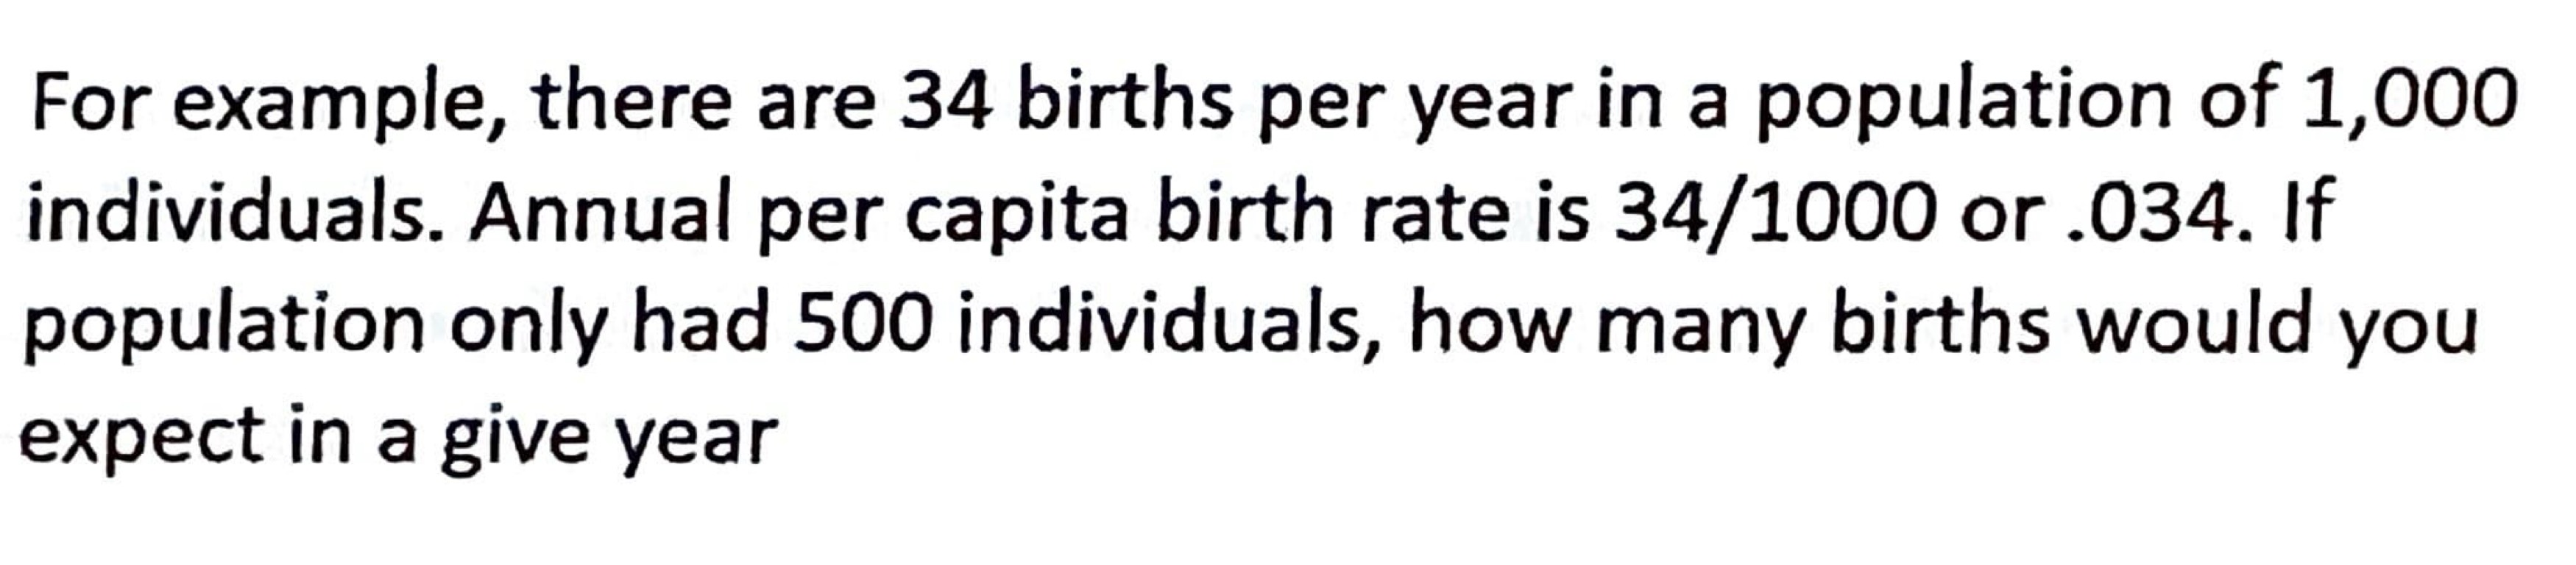
Calculate
B = bN = (annual per capita birth rate) multiplied by population size
(0.034) * 500 =
17 births per year

Zero population growth occurs when r is equal to?
zero, indicating no net population increase or decrease.
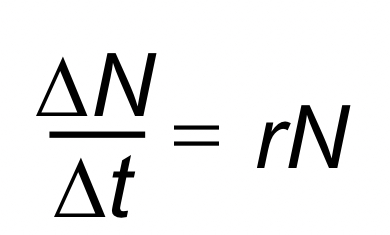
When all members of a population have access to unlimited resources and are free to reproduce at their physiological capacity, that population will experience what?
Exponential Population Growth
*This is the maximum per capita rate of increase
Examples of species whose population size grows exponentially (increasing at a constant rate)?
Species introduced to new environments
Rebounding species from catastrophic number loss
example: elephant population
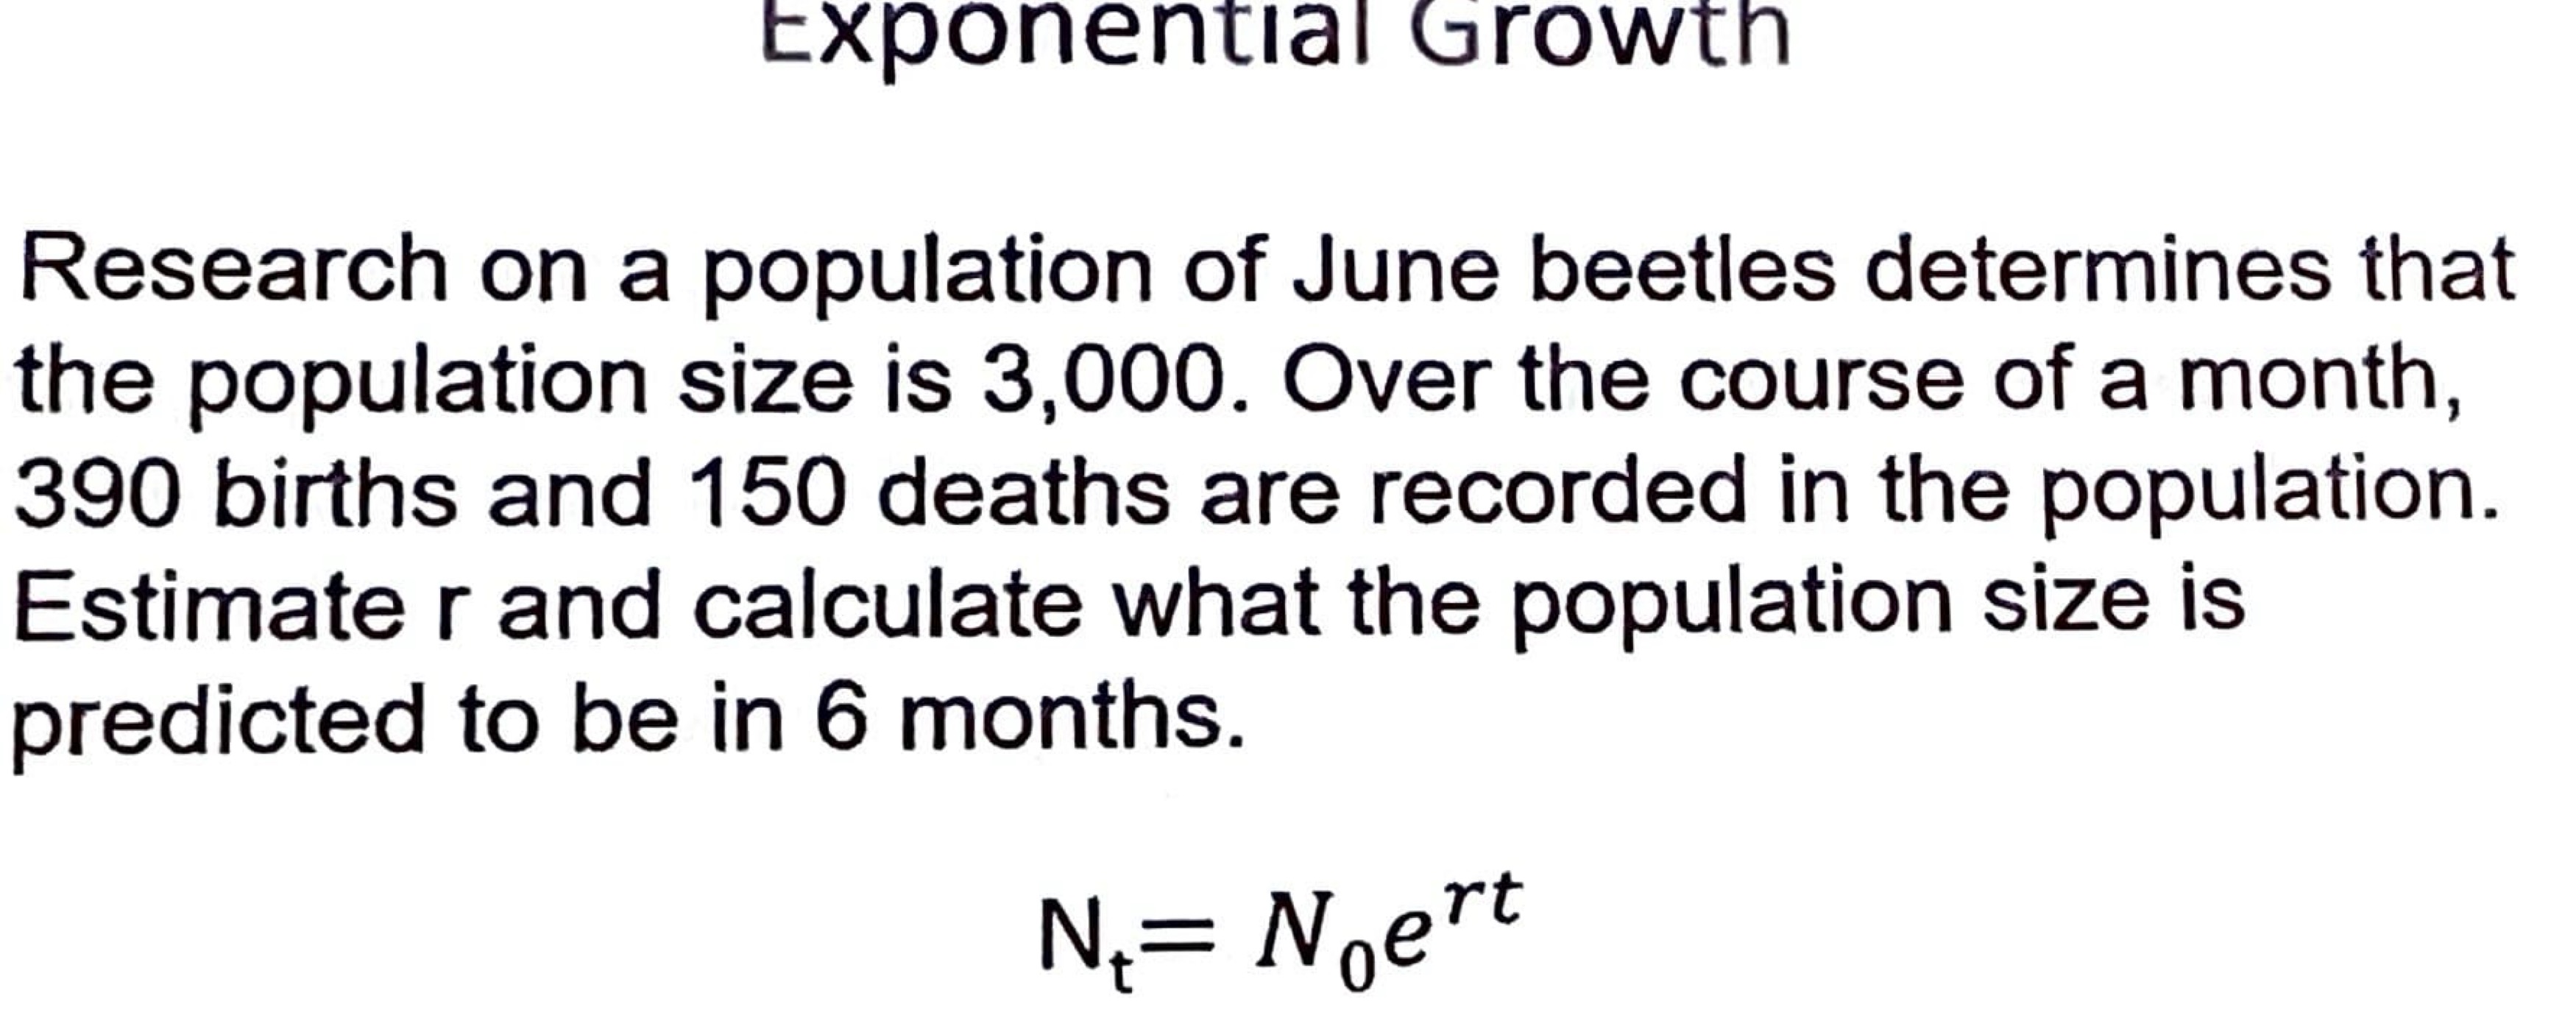
When there is continuous exponential growth, how is the population size it calculated at any given time (t) ?
Nt = N0ert
Nt = population size at time t
N0 = the original population size
R = Per capita rate of growth
Example of how to solve for population size at the given time
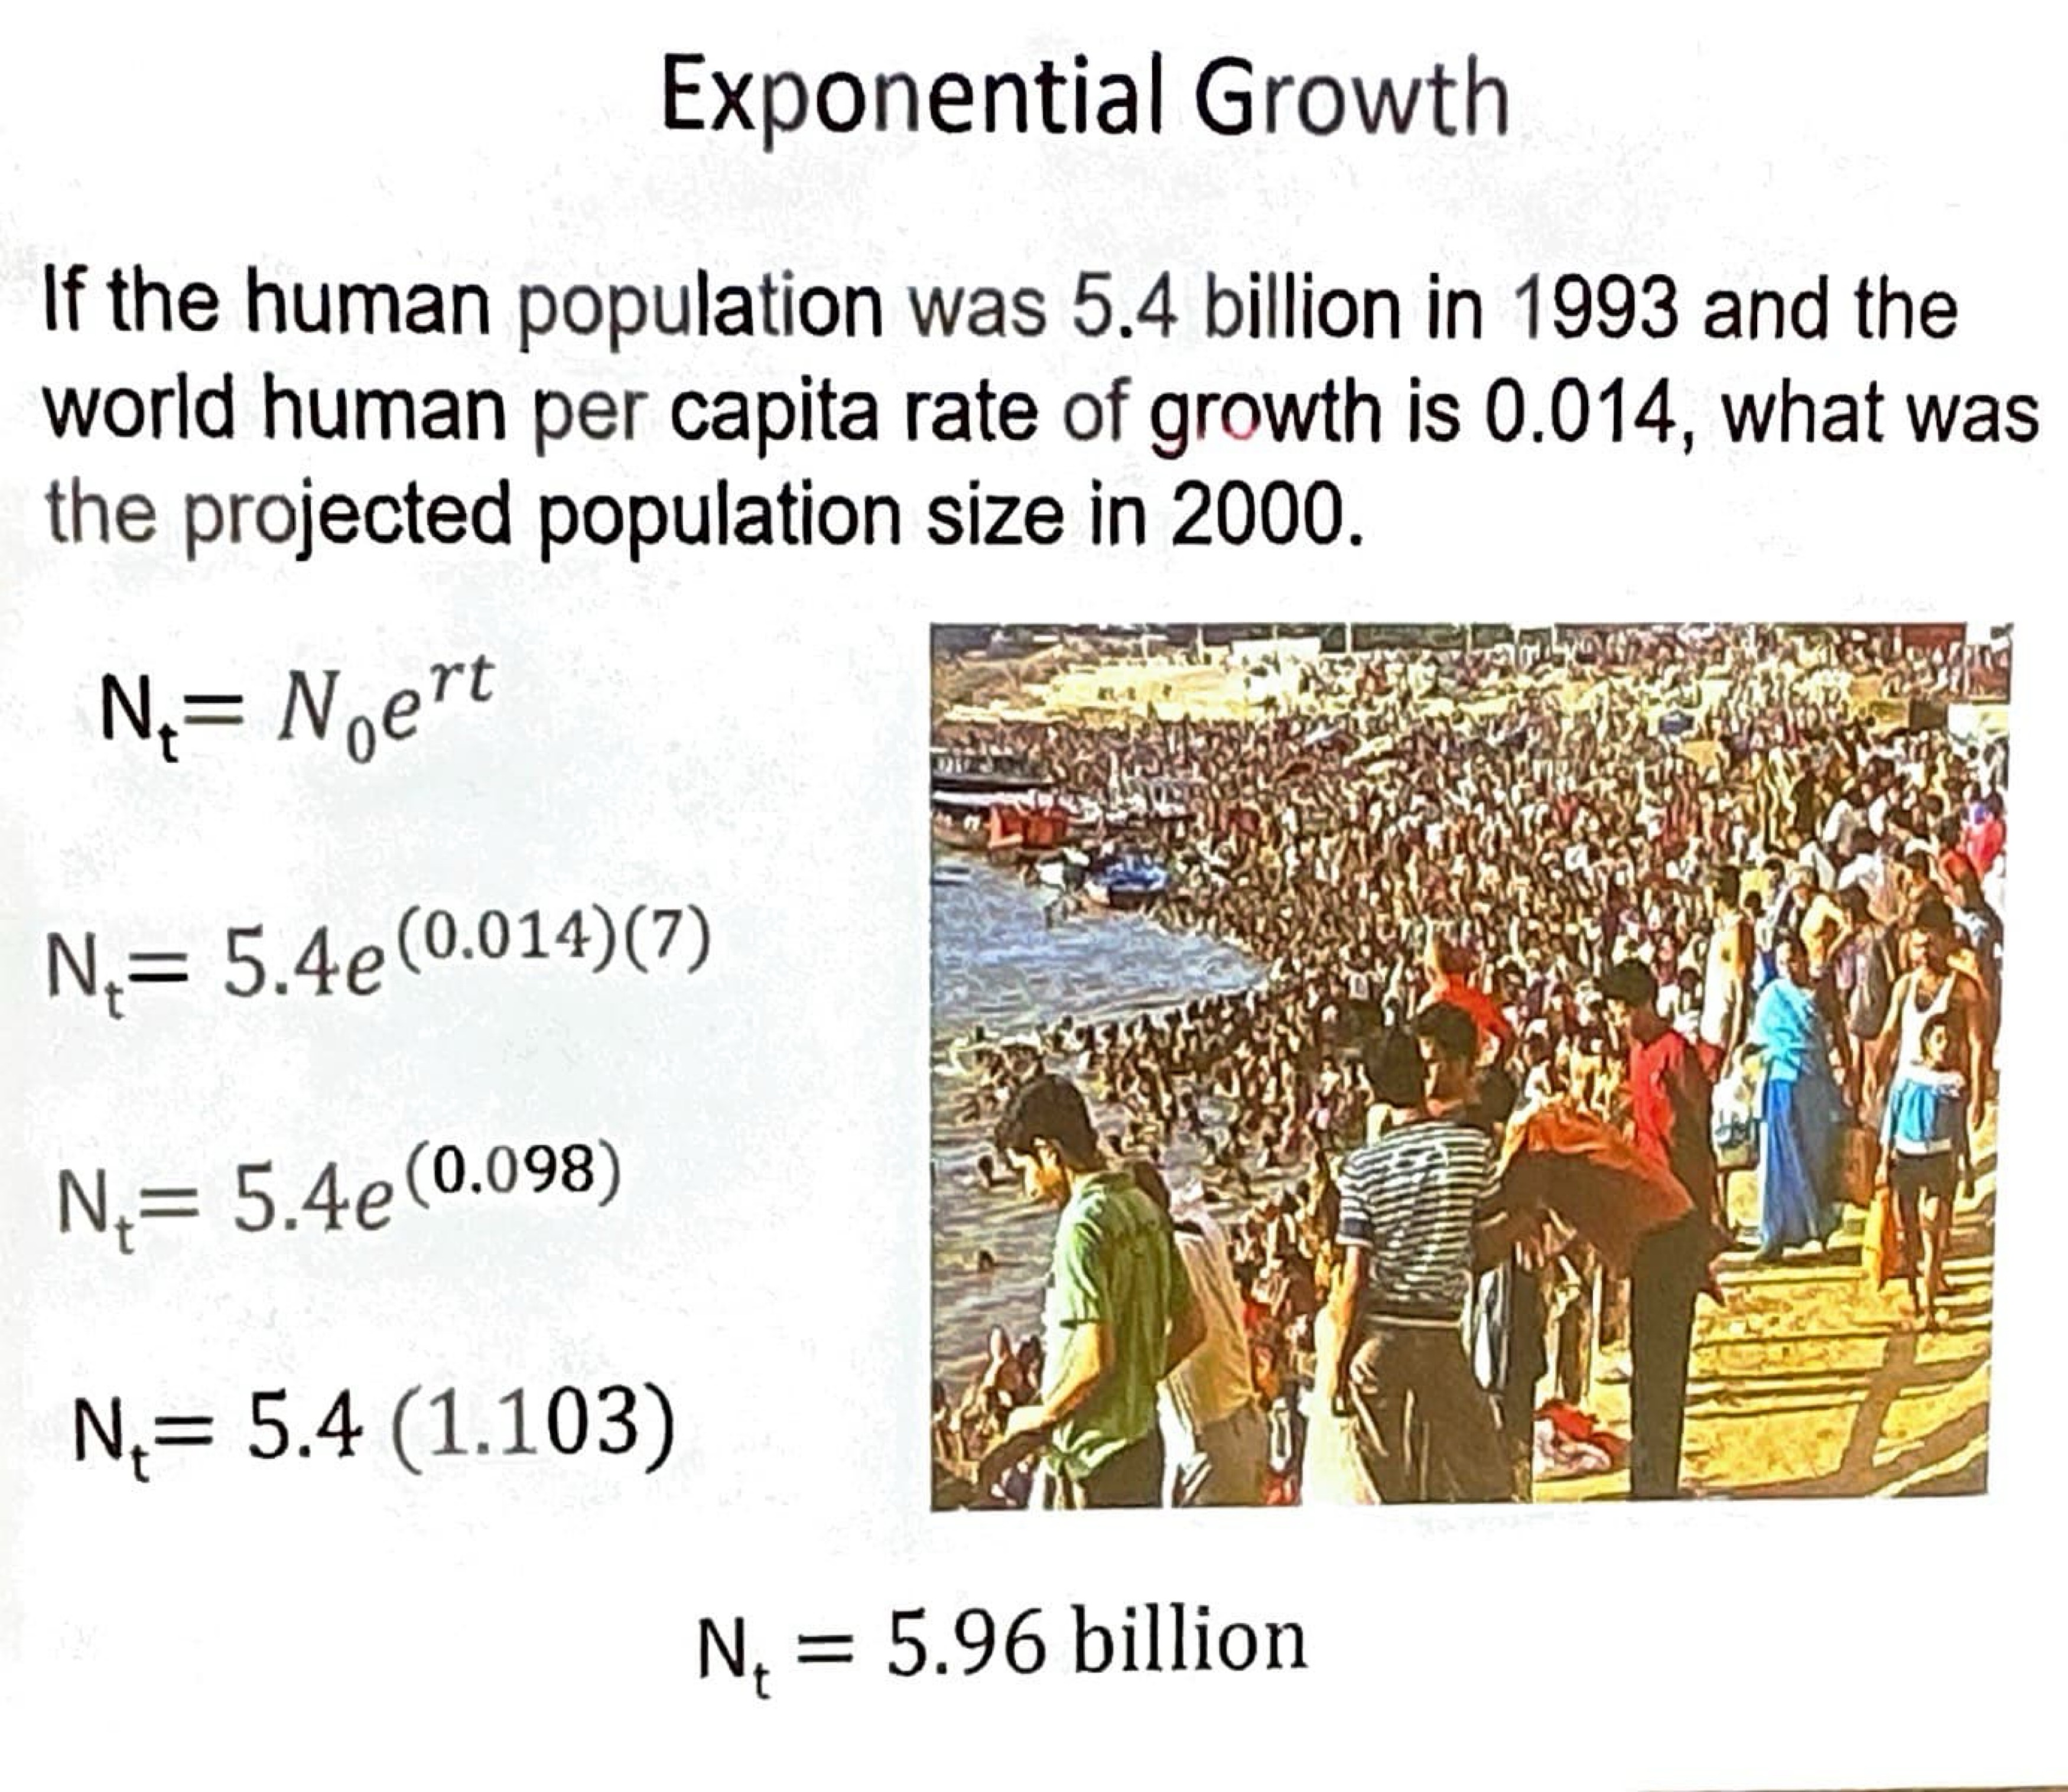
Solve this example
Calculate r first → brith rate - death rate
???????
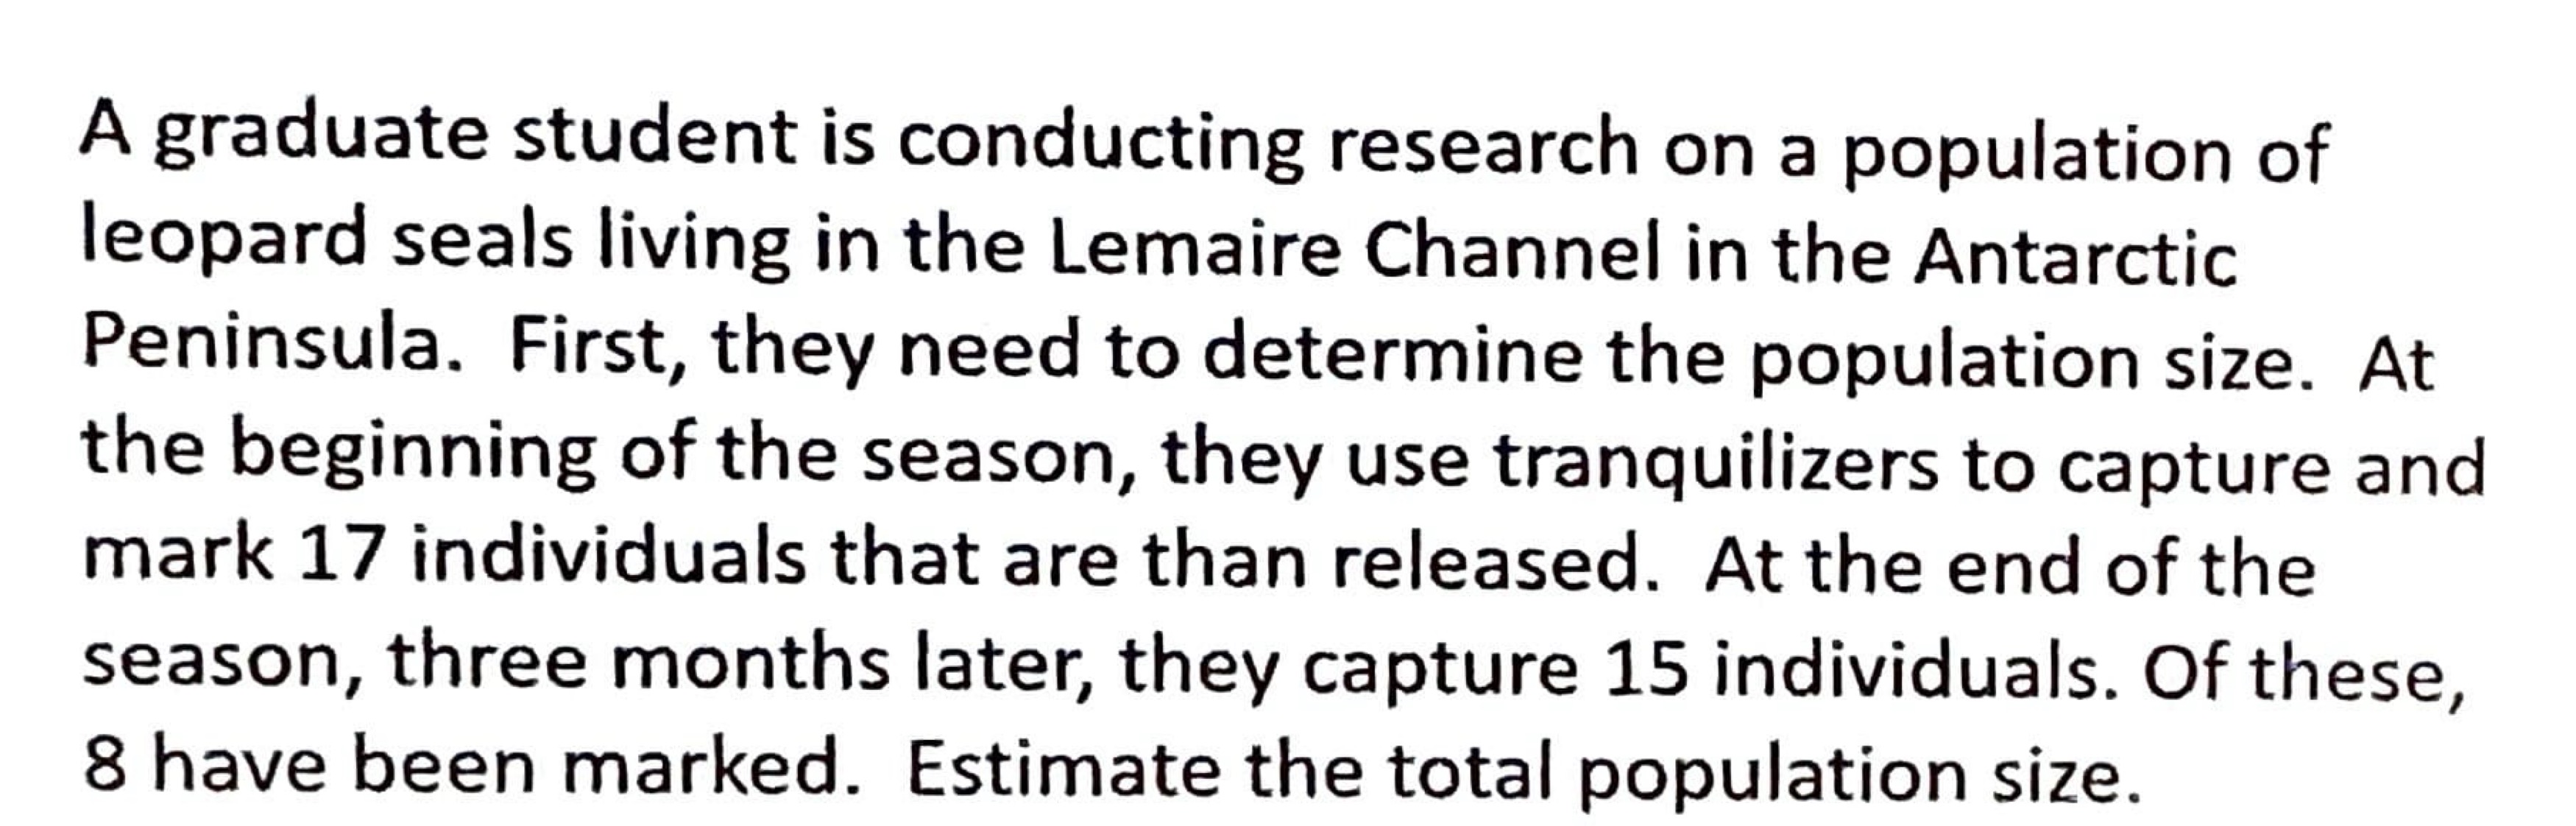
Solve this
(17×15) / 8 =31.875 = ~32 individuals

Is greater than zero (0)????
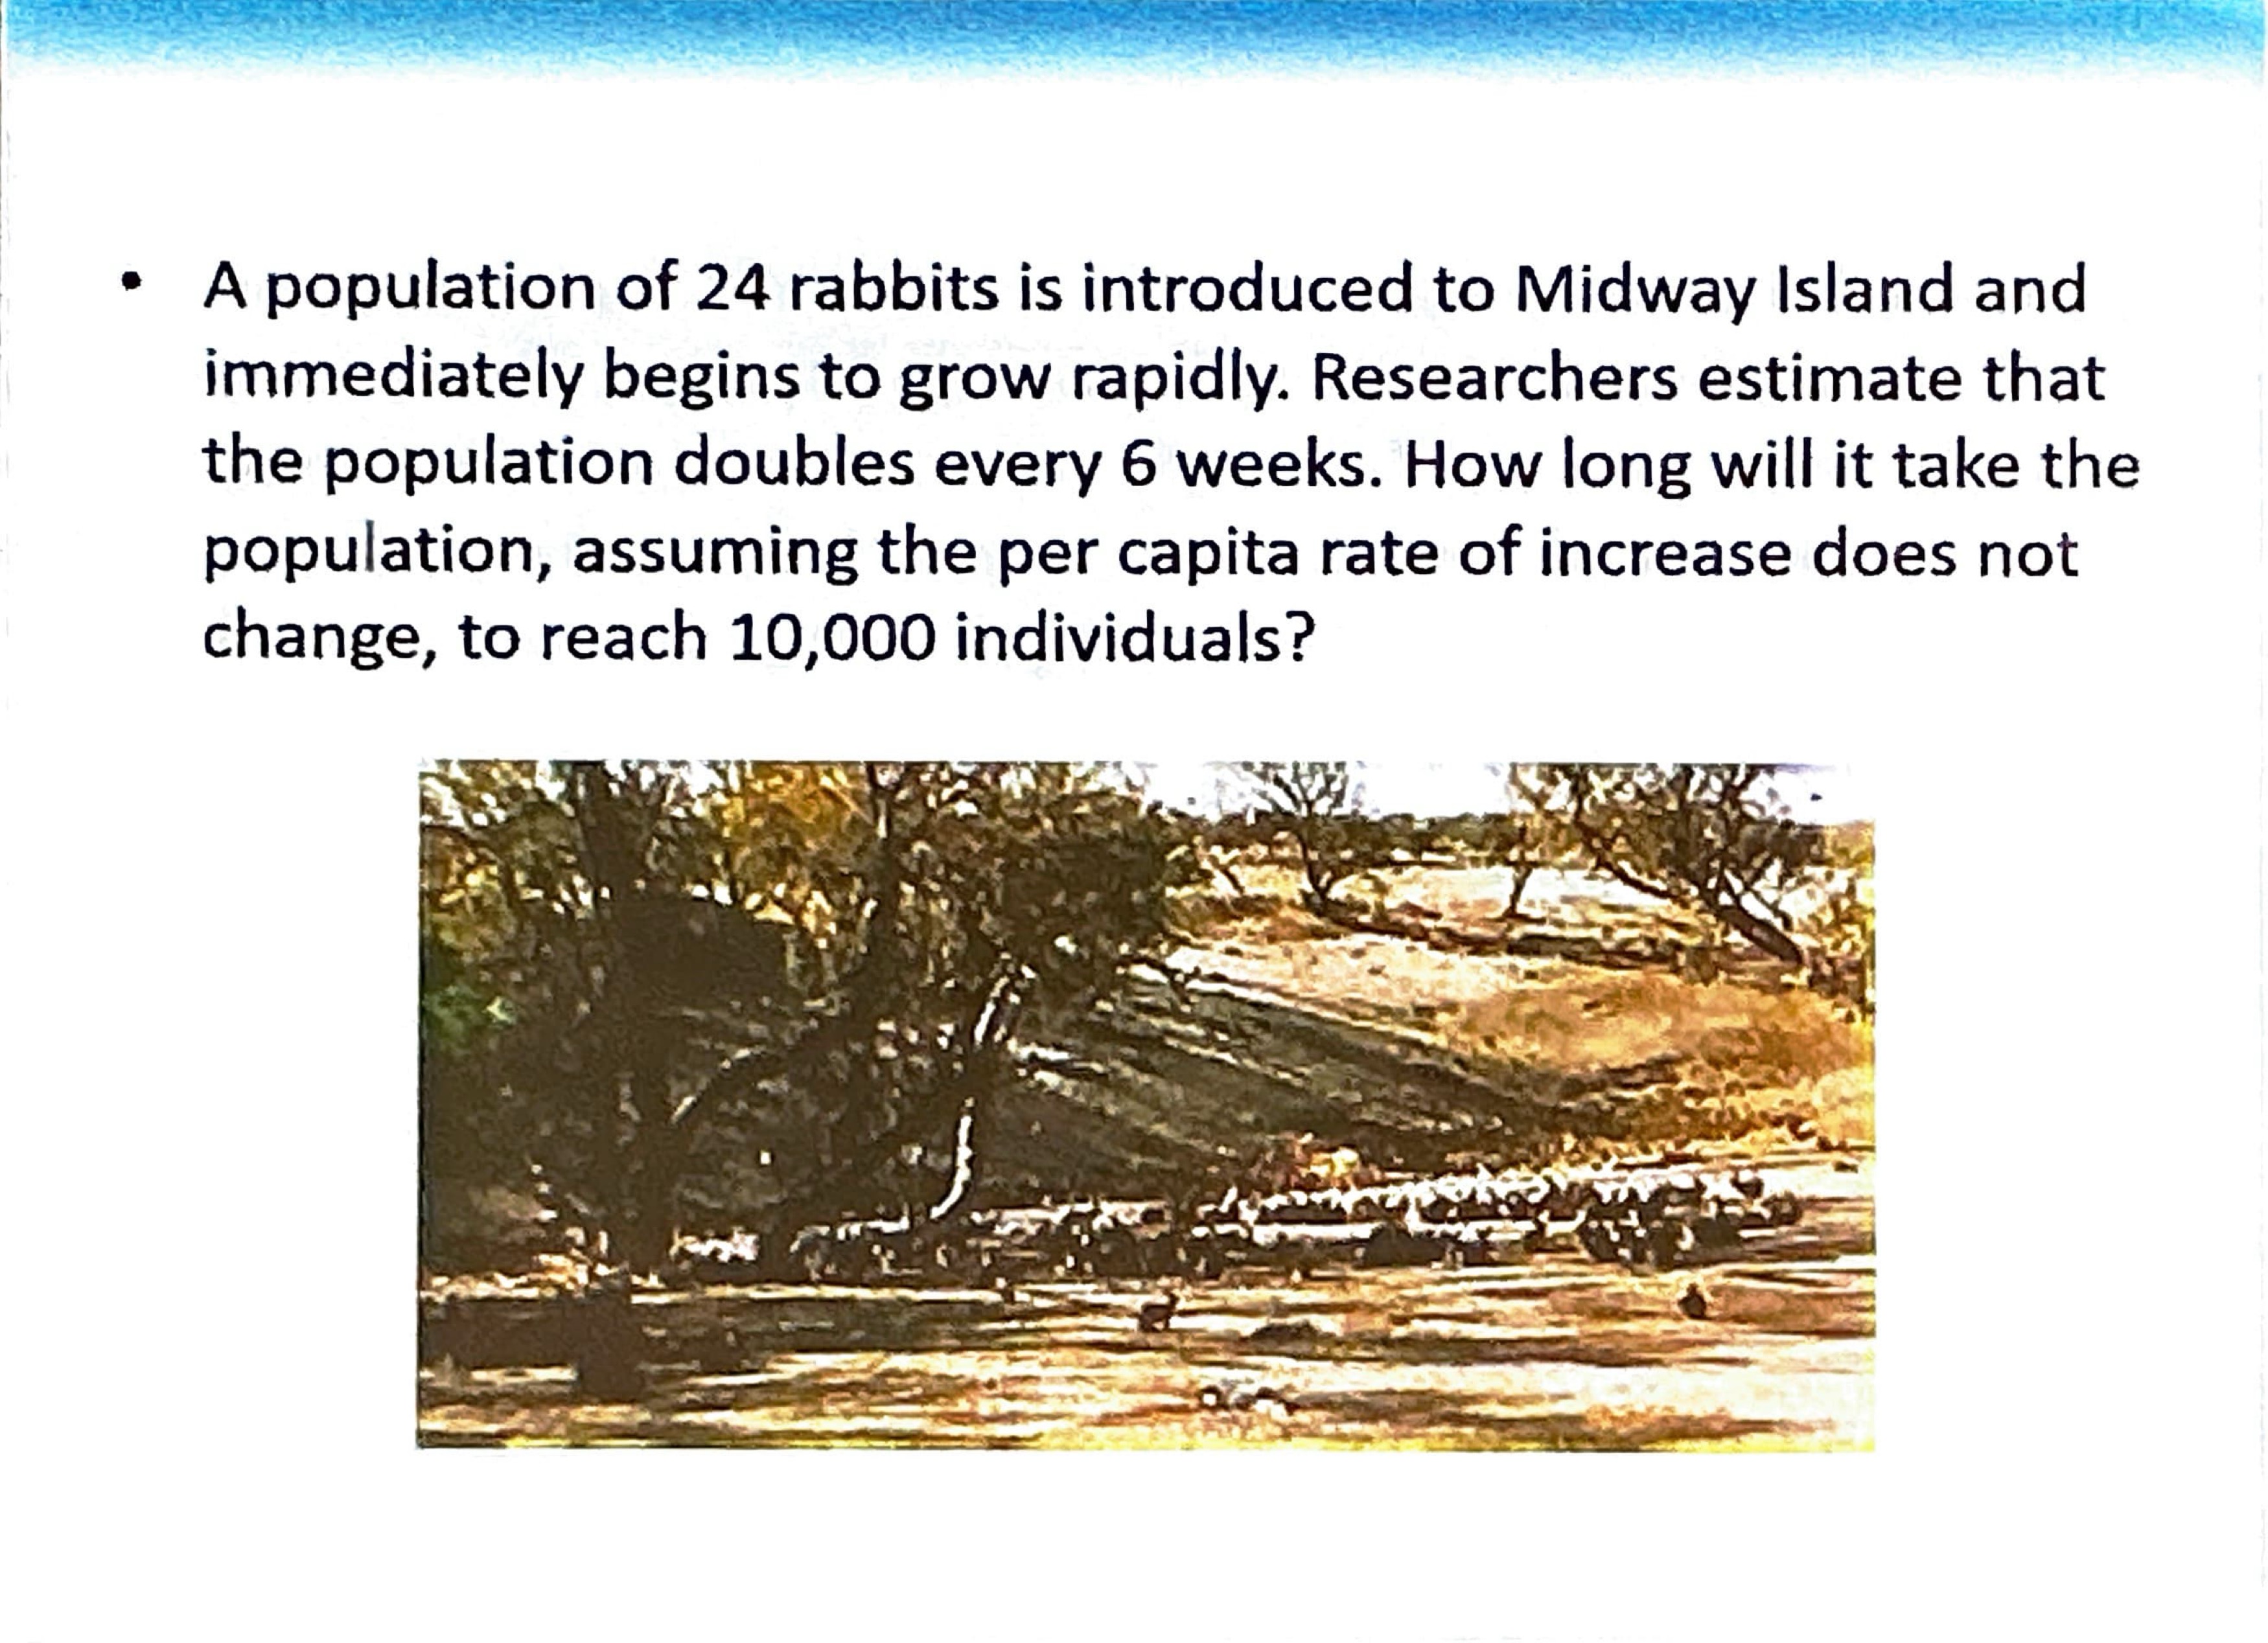
Solve:
Nt = N0e^rt
10,000 = 24 e^r(t)
r = 0.116 so,
(In[10,000/24]) / 0.116 = t
~52 weeks = t
Solve for r to plug into the equation above:
Nt = n0e^rt
is the intrinsic growth rate, indicating how quickly a population can grow.
2 = 1e^r(6 weeks)
In (2) =In (e^6r)
0.693 = 6r
r=0.116
True or false? Resources rarely remain abundant enough for exponential growth?
True
Define carrying capacity (K)
Always changing - Can increase or decrease depending on availability of resources
The closer a population get to reaching the max capacity (density) = mortality (death) increases, birth rates decline
R will decline until it reaches zero
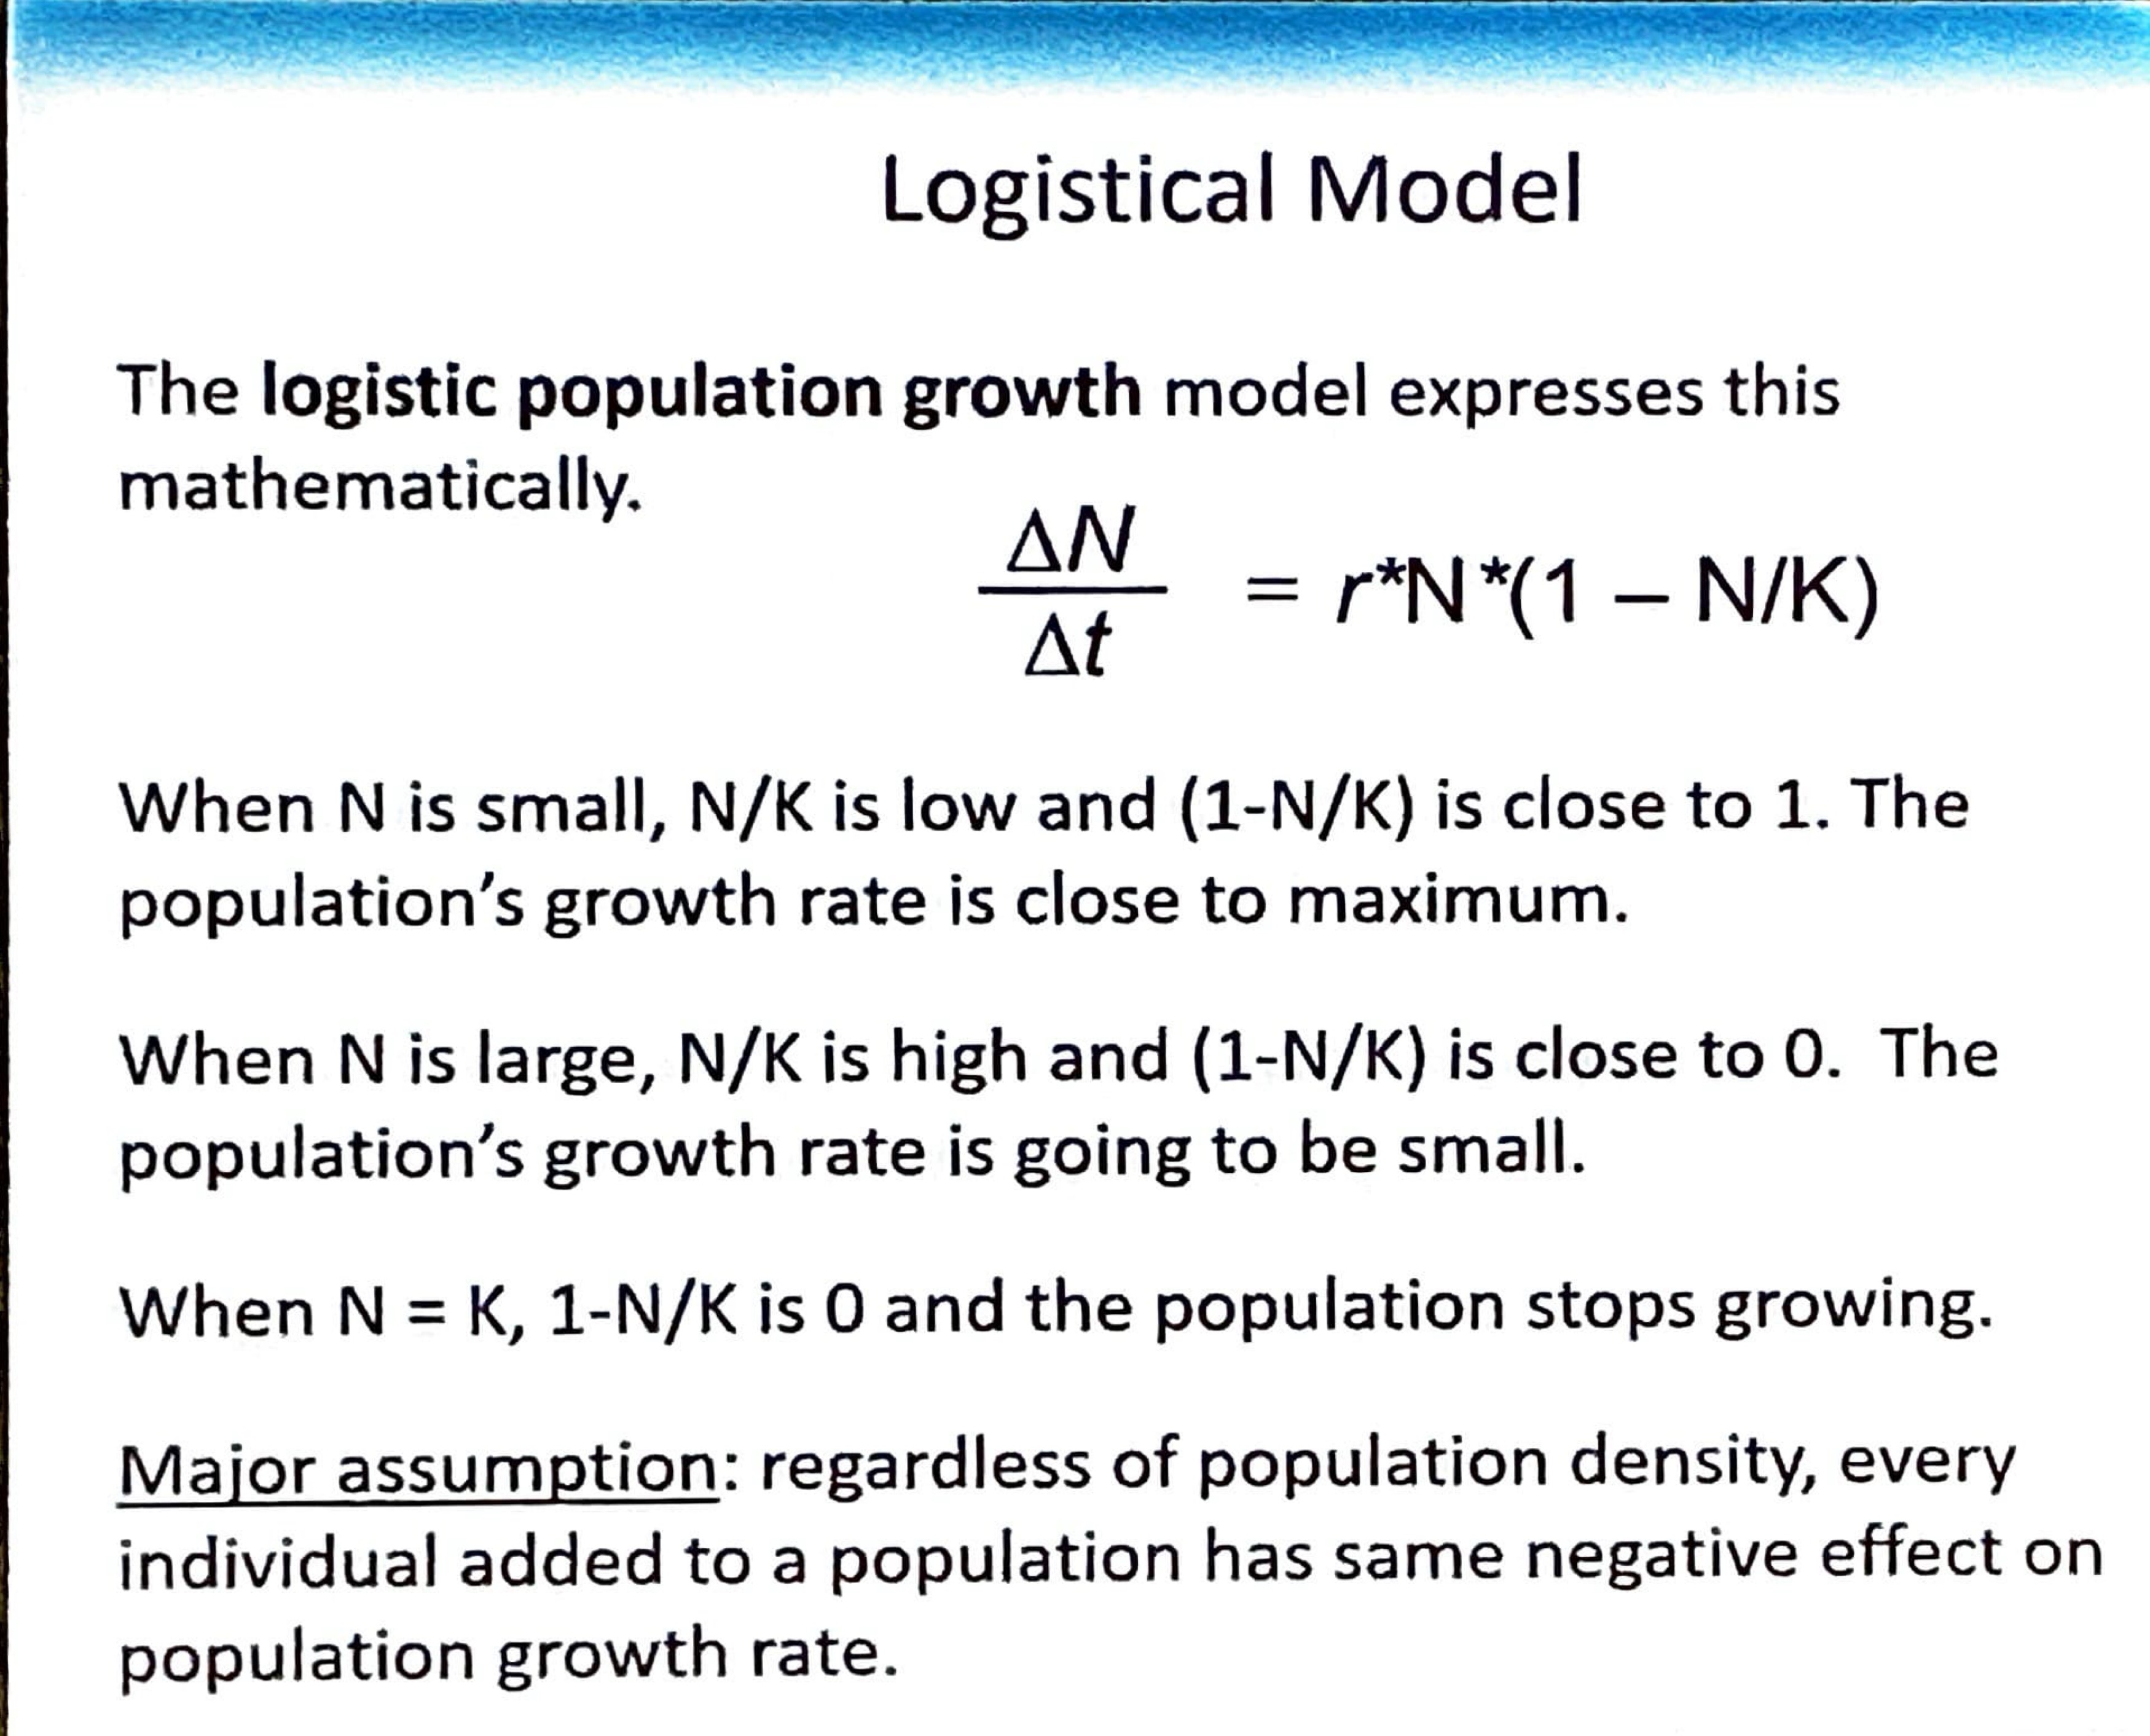
Switch from exponential to logistical occurs at what point on a Logistical Model?
Half of the exponential growth?????
Logistic Population Growth model expressed mathematically
Best used when the population is beyond half of the carrying capacity
The logistical model assumes that populations adjust instantly to changes in resources.
In some species, there is a delay in this adjustment.
This delay can cause a population to grow beyond the environment's carrying capacity for a short period.
The images show examples of species that might be studied in this context, including a water flea, a sea urchin, beetles, and a human crowd.
N small —> N/K is LOW
N large —> N/K is HIGH
Solve this
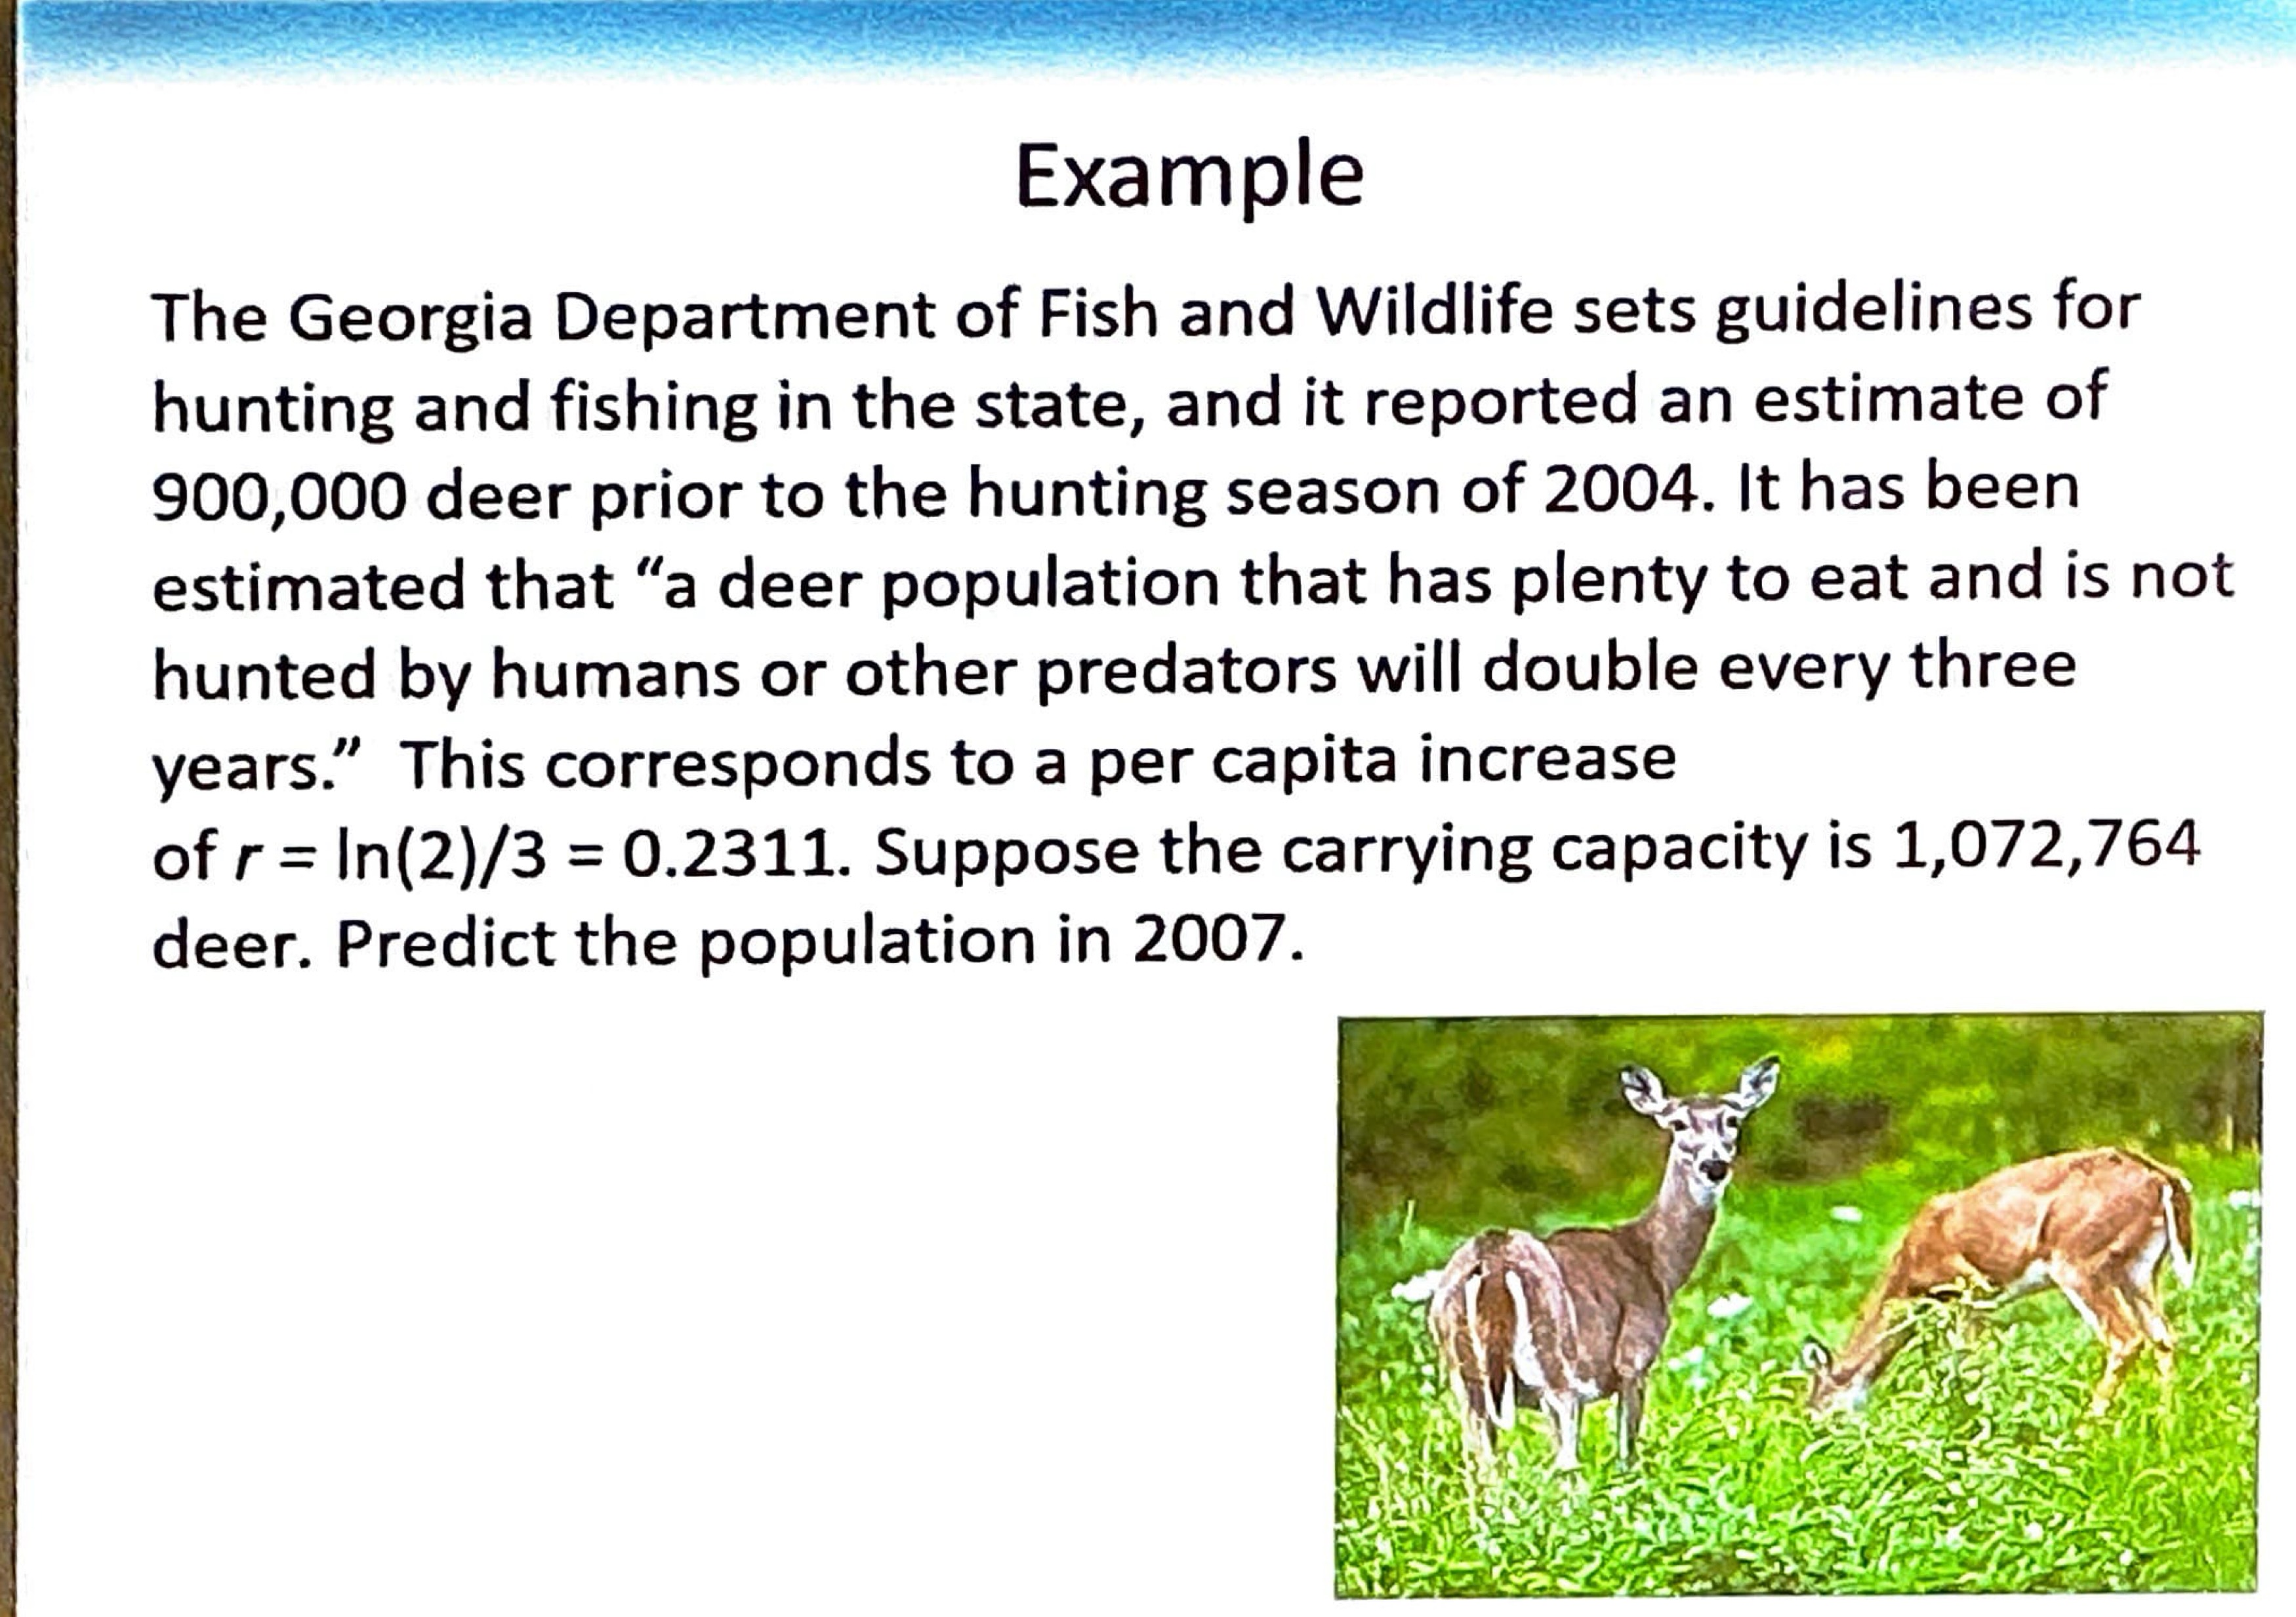
Change in population / Change in time = r x N x [1-N/K]
= 0.2311 × 900,000 x [1- (900,000/1,072,764)]
= 33,496 deer added to the population (THIS IS POSITIVE # = increase in population)
Pop size in 2007 = 933,496
![<p>Change in population / Change in time = r x N x [1-N/K]</p><p>= 0.2311 × 900,000 x [1- (900,000/1,072,764)]</p><p>= 33,496 deer added to the population (THIS IS POSITIVE # = increase in population)</p><p>Pop size in 2007 = 933,496</p>](https://knowt-user-attachments.s3.amazonaws.com/b82d2ccb-5bbd-4010-8a59-ed0d23436857.jpg)
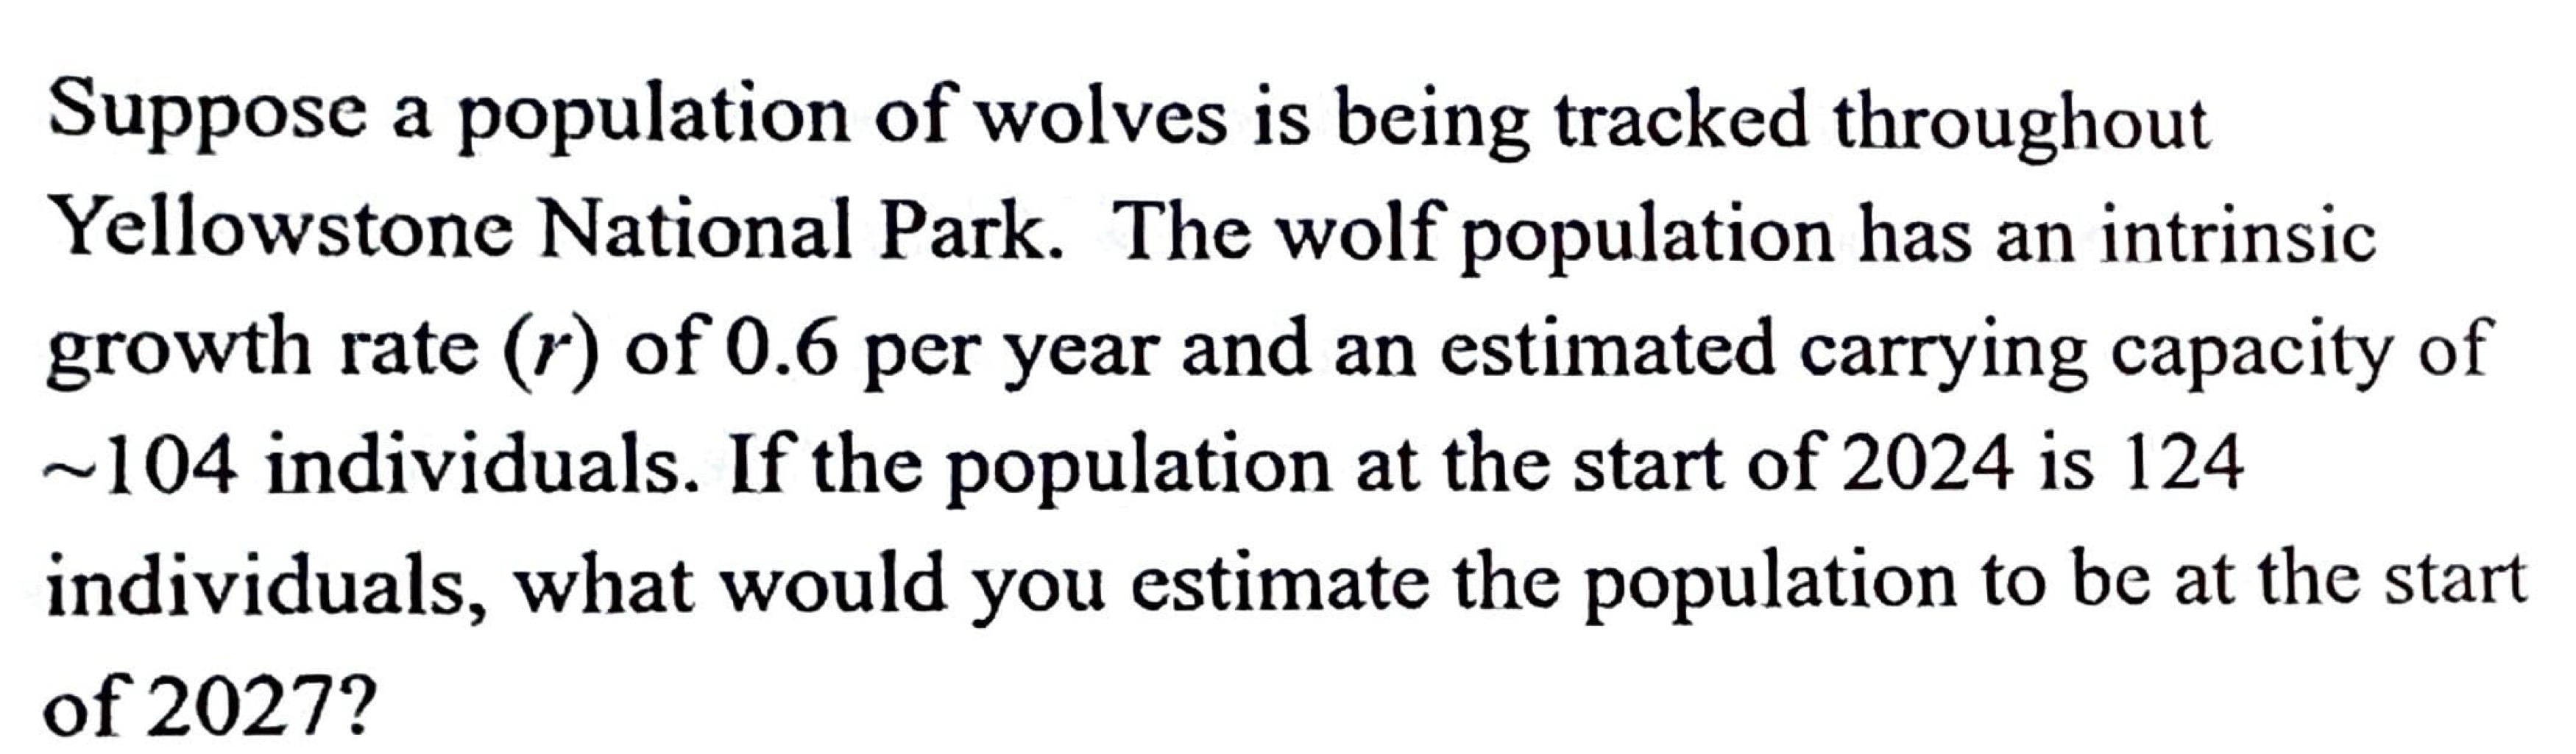
Solve
*NOTE: the population in 2024 (124) is greater than the carrying capacity (~104) meaning there will be a DECLINE in the population size
2024 —> Change in population / Change in time = r x N x [1-N/K]
= (0.6) x (124) x [1- (124/104)]
= about negative 14 (decline)
124 -14 =110
2025–> Change in population / Change in time = r x N x [1-N/K]
= (0.6) × (110) x [1- (110/104)]
= - 3.8
= about negative 4 (decline)
110 - 4 = 106
226–> Change in population / Change in time = r x N x [1-N/K]
= (0.6) x (106) x [1- (106/104)]
= about negative 1
*NOTE: Decline in population becomes small every year (year one–> ~ -14, year two–> ~ -4, year three–> ~ -1
R is measured in “per year”
What model do species in laboratories fit (Beetles, crustaceans, paramecium, etc) ? Exponential or Logistical?
Logistical Model
Define K-selection
Density-dependent selection, selection for traits that are sensitive to population densities
Lots of parental involvement
Examples: Humans, large mammals usually
Typically follow the Logistical growth model
When is K-selection most favorable?
In populations living at a density near the limit imposed by resources (carrying capacity = K)
Define r-selection
Density-INDEPENDENT selection, selects for life history traits that maximize reproduction
Little parental involvement
Typically follow the exponential growth curve
Fast growth, mature quickly
Examples: weeds, many plants
When is r-selection most favorable?
Occurs in environments in which population densities are well below carrying capacity or face little competition
Define Life History
The traits that affect an organism’s schedule of reproduction and survival
3 Main Variables that impact an organism’s schedule
Often dependent on semelparity vs iteroparity
What are the 3 main variables that impact an organism’s schedule of reproduction and survival?
The age at which reproduction begins
How often the organism reproduces
How many offspring are produced per reproductive episode
What environmental conditions and organisms favor semelparity and iteroparity?
Highly variable or unpredictable environment likely favor semelparity (Have only ONE reproductive event in their lifetime) —> R selected organisms
Dependable environments favor Iteroparity (Capable of multiple reproductive events) —> K selected organisms
Are there trade-offs between survival and reproduction?
Yes
Define Allee Effect
a population's growth rate decreases at low population densities (small pop size) due to difficulties in finding mates or cooperative behaviors.
-mate limitation
-cooperative defense
-cooperative feeding
-environmental conditioning
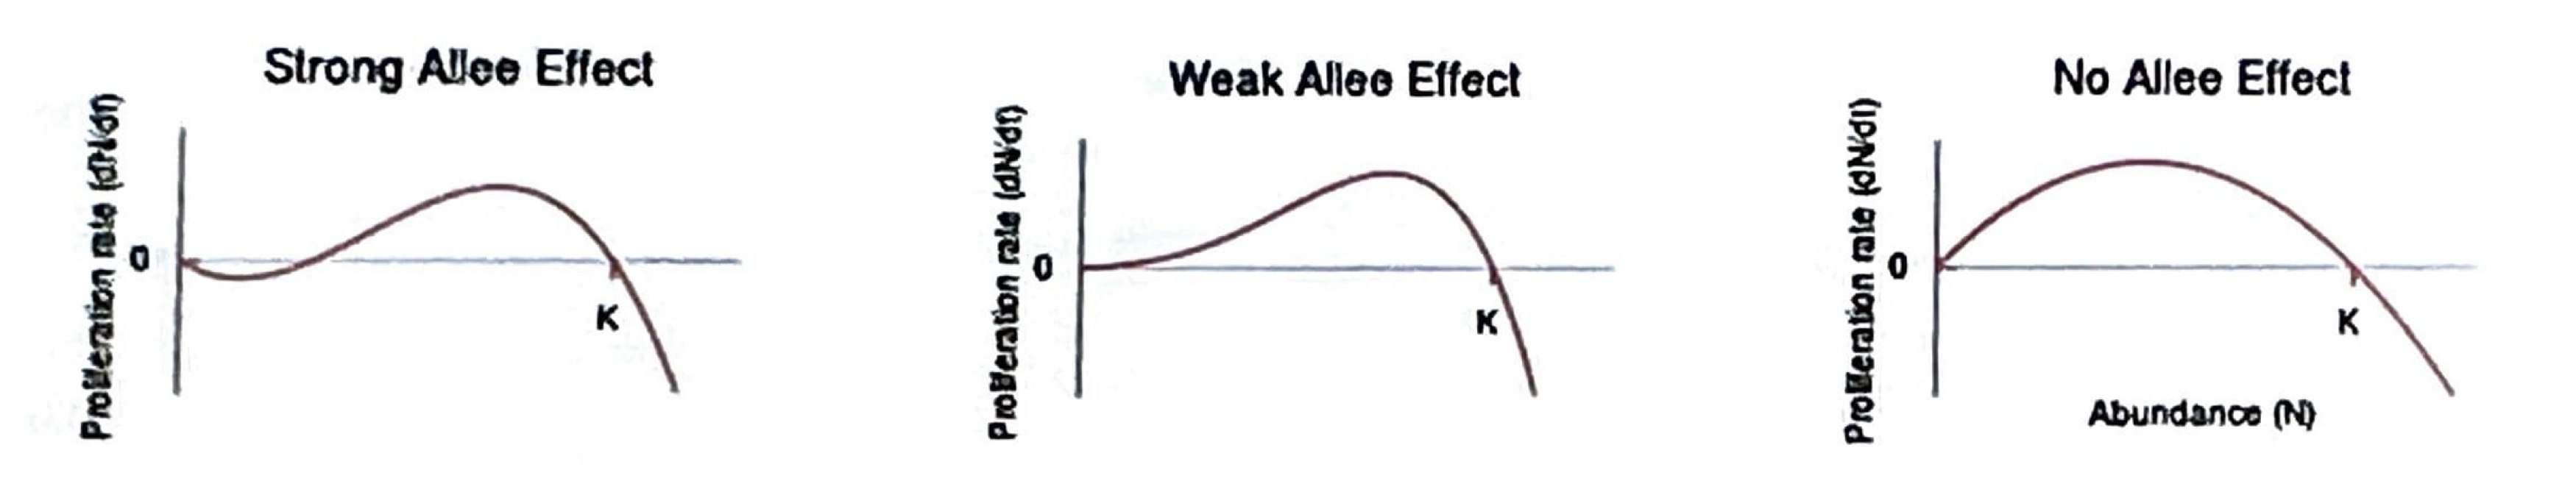
Allen Effect impacts which distribution type?
Organisms that are Clumped Distribution
Many factors that regulate population growth are density dependent. True or false?
True
Density-independent populations
birth rate and death rate do not change with population density
Some physical factor which kills similar portions of the population regardless of its density

Density-dependent populations
birth rates fall and/or death rate rates increase with population density
Limiting resource, behavioral changes, biotic control
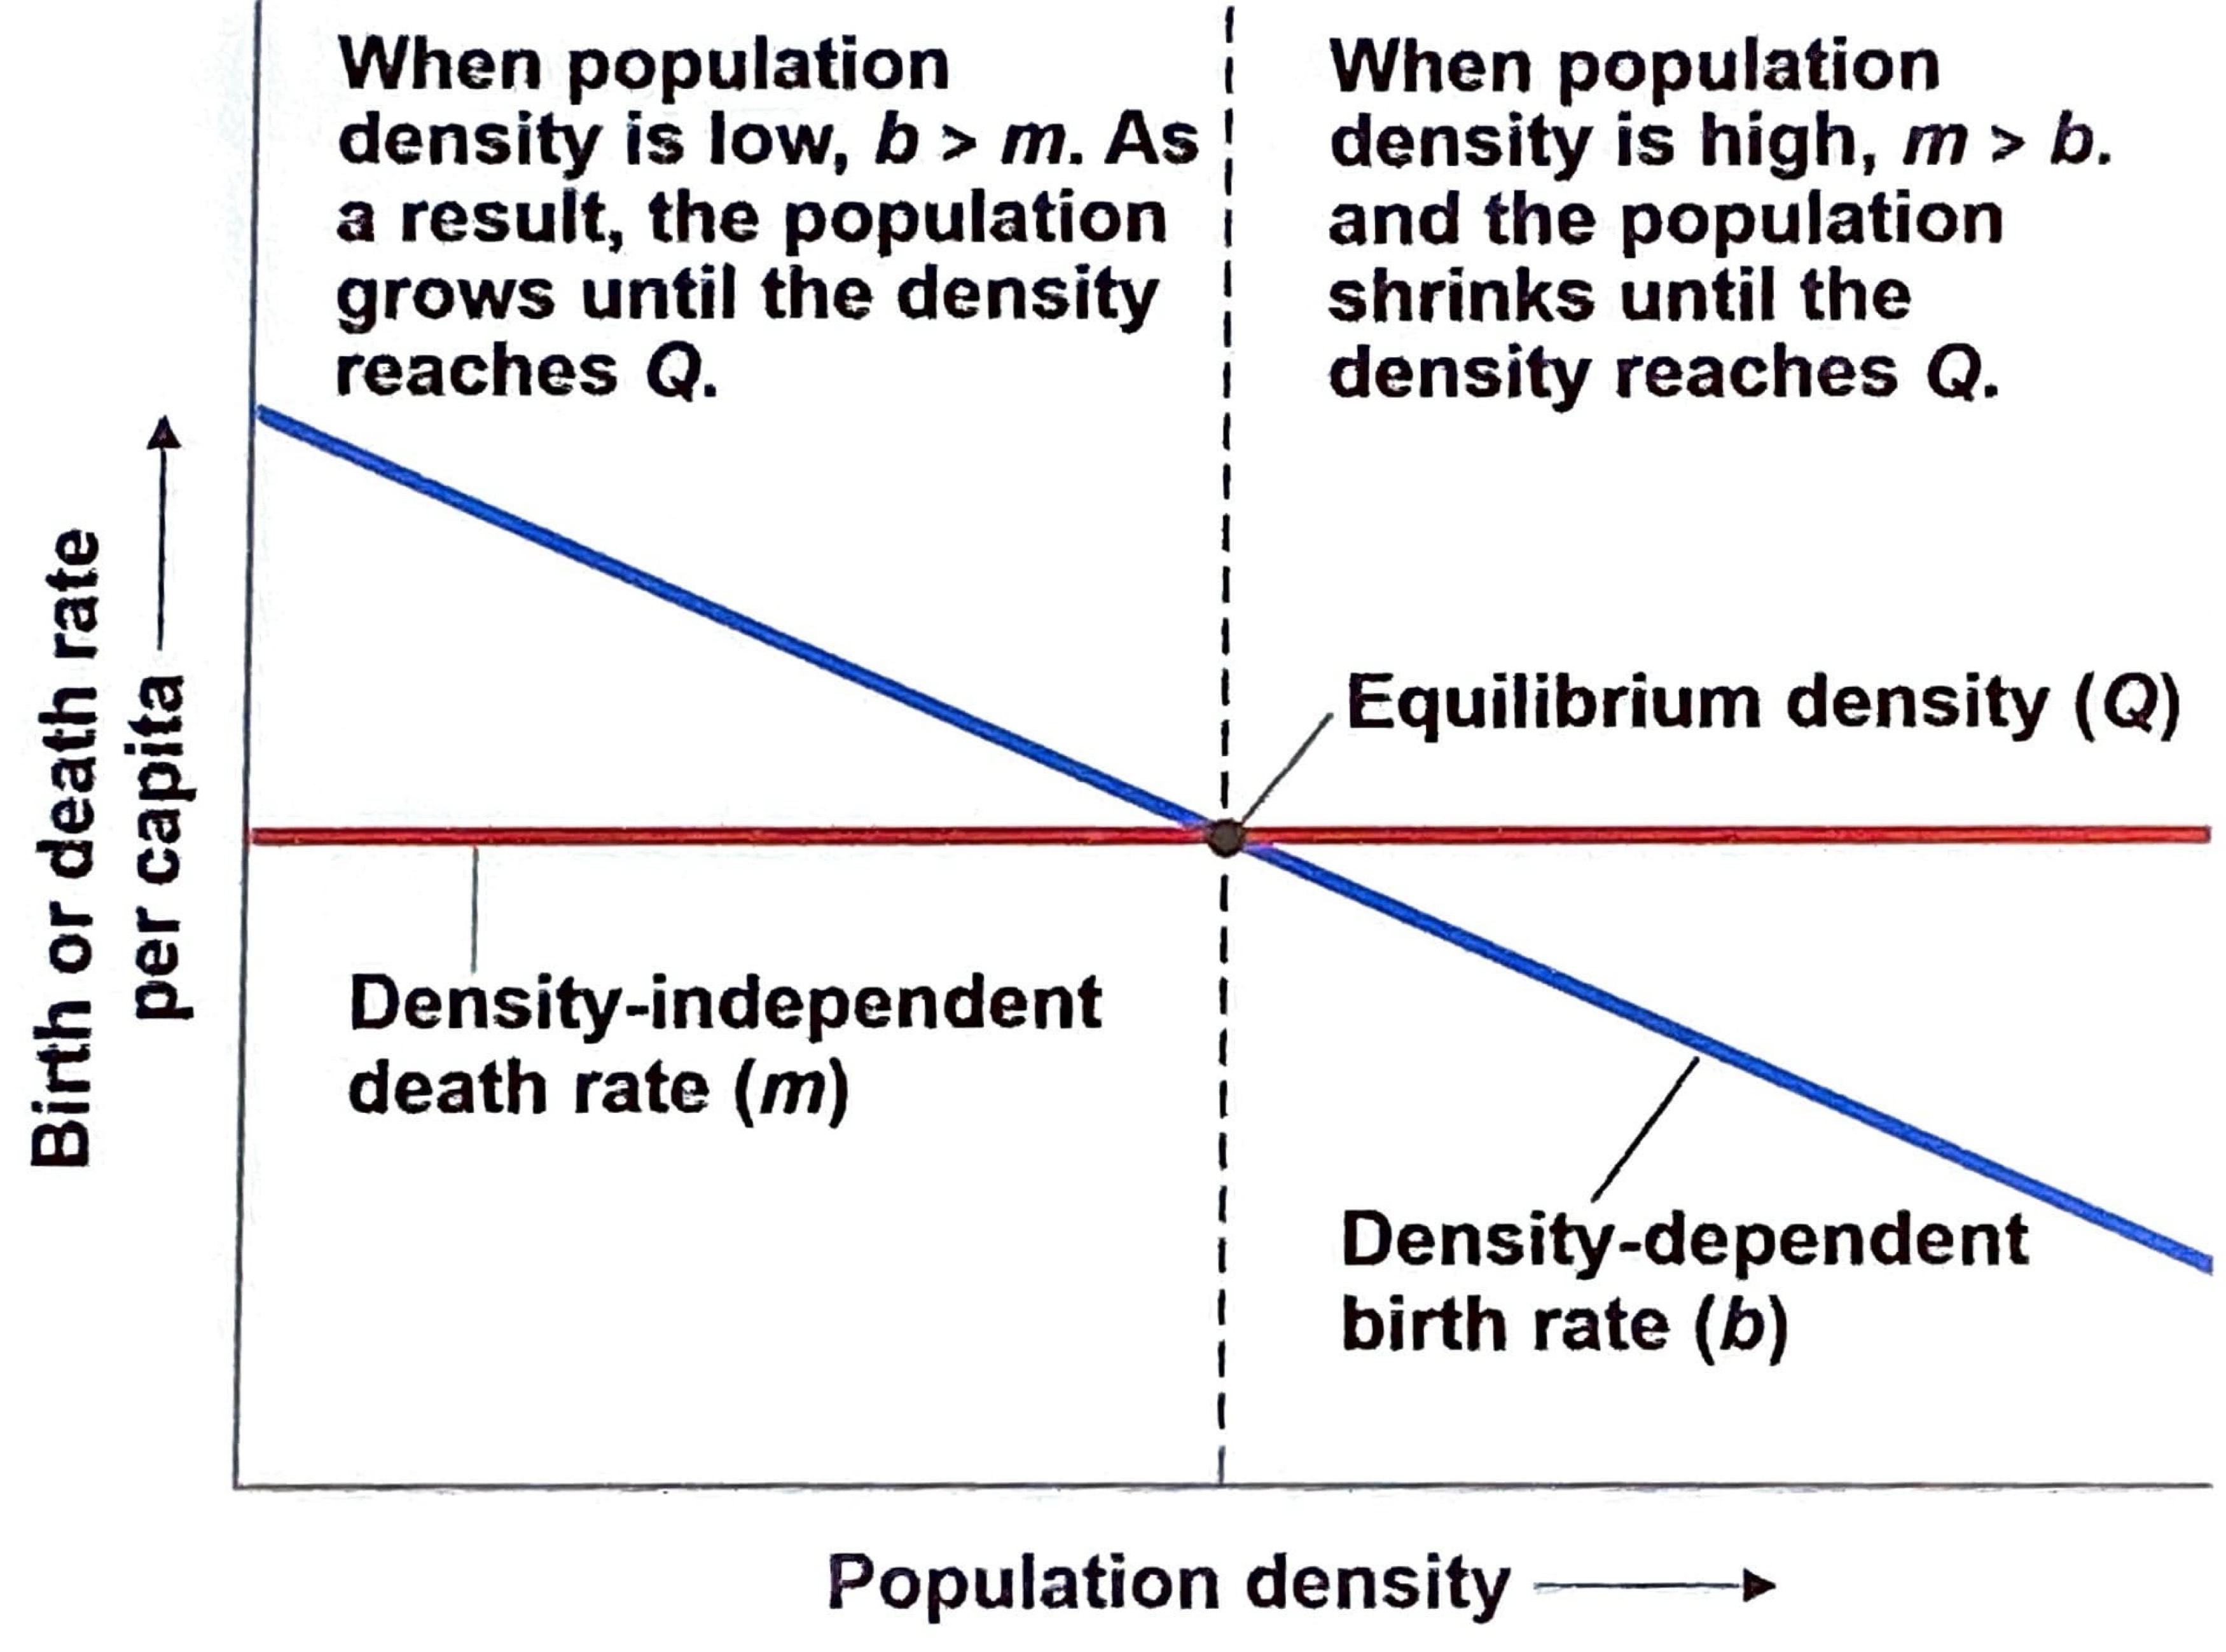
Can you have a mixture of both?
Yes
Population Dynamics focuses on what?
Focuses on the complex interactions between biotic and abiotic factors that cause variation in population size
Long-term population dynamic studies have challenged the hypothesis that…
populations of large mammals are relatively stable over time. The scientists found that large mammals ACTUALLY exhibit significant fluctuations in response to environmental changes and human impacts.
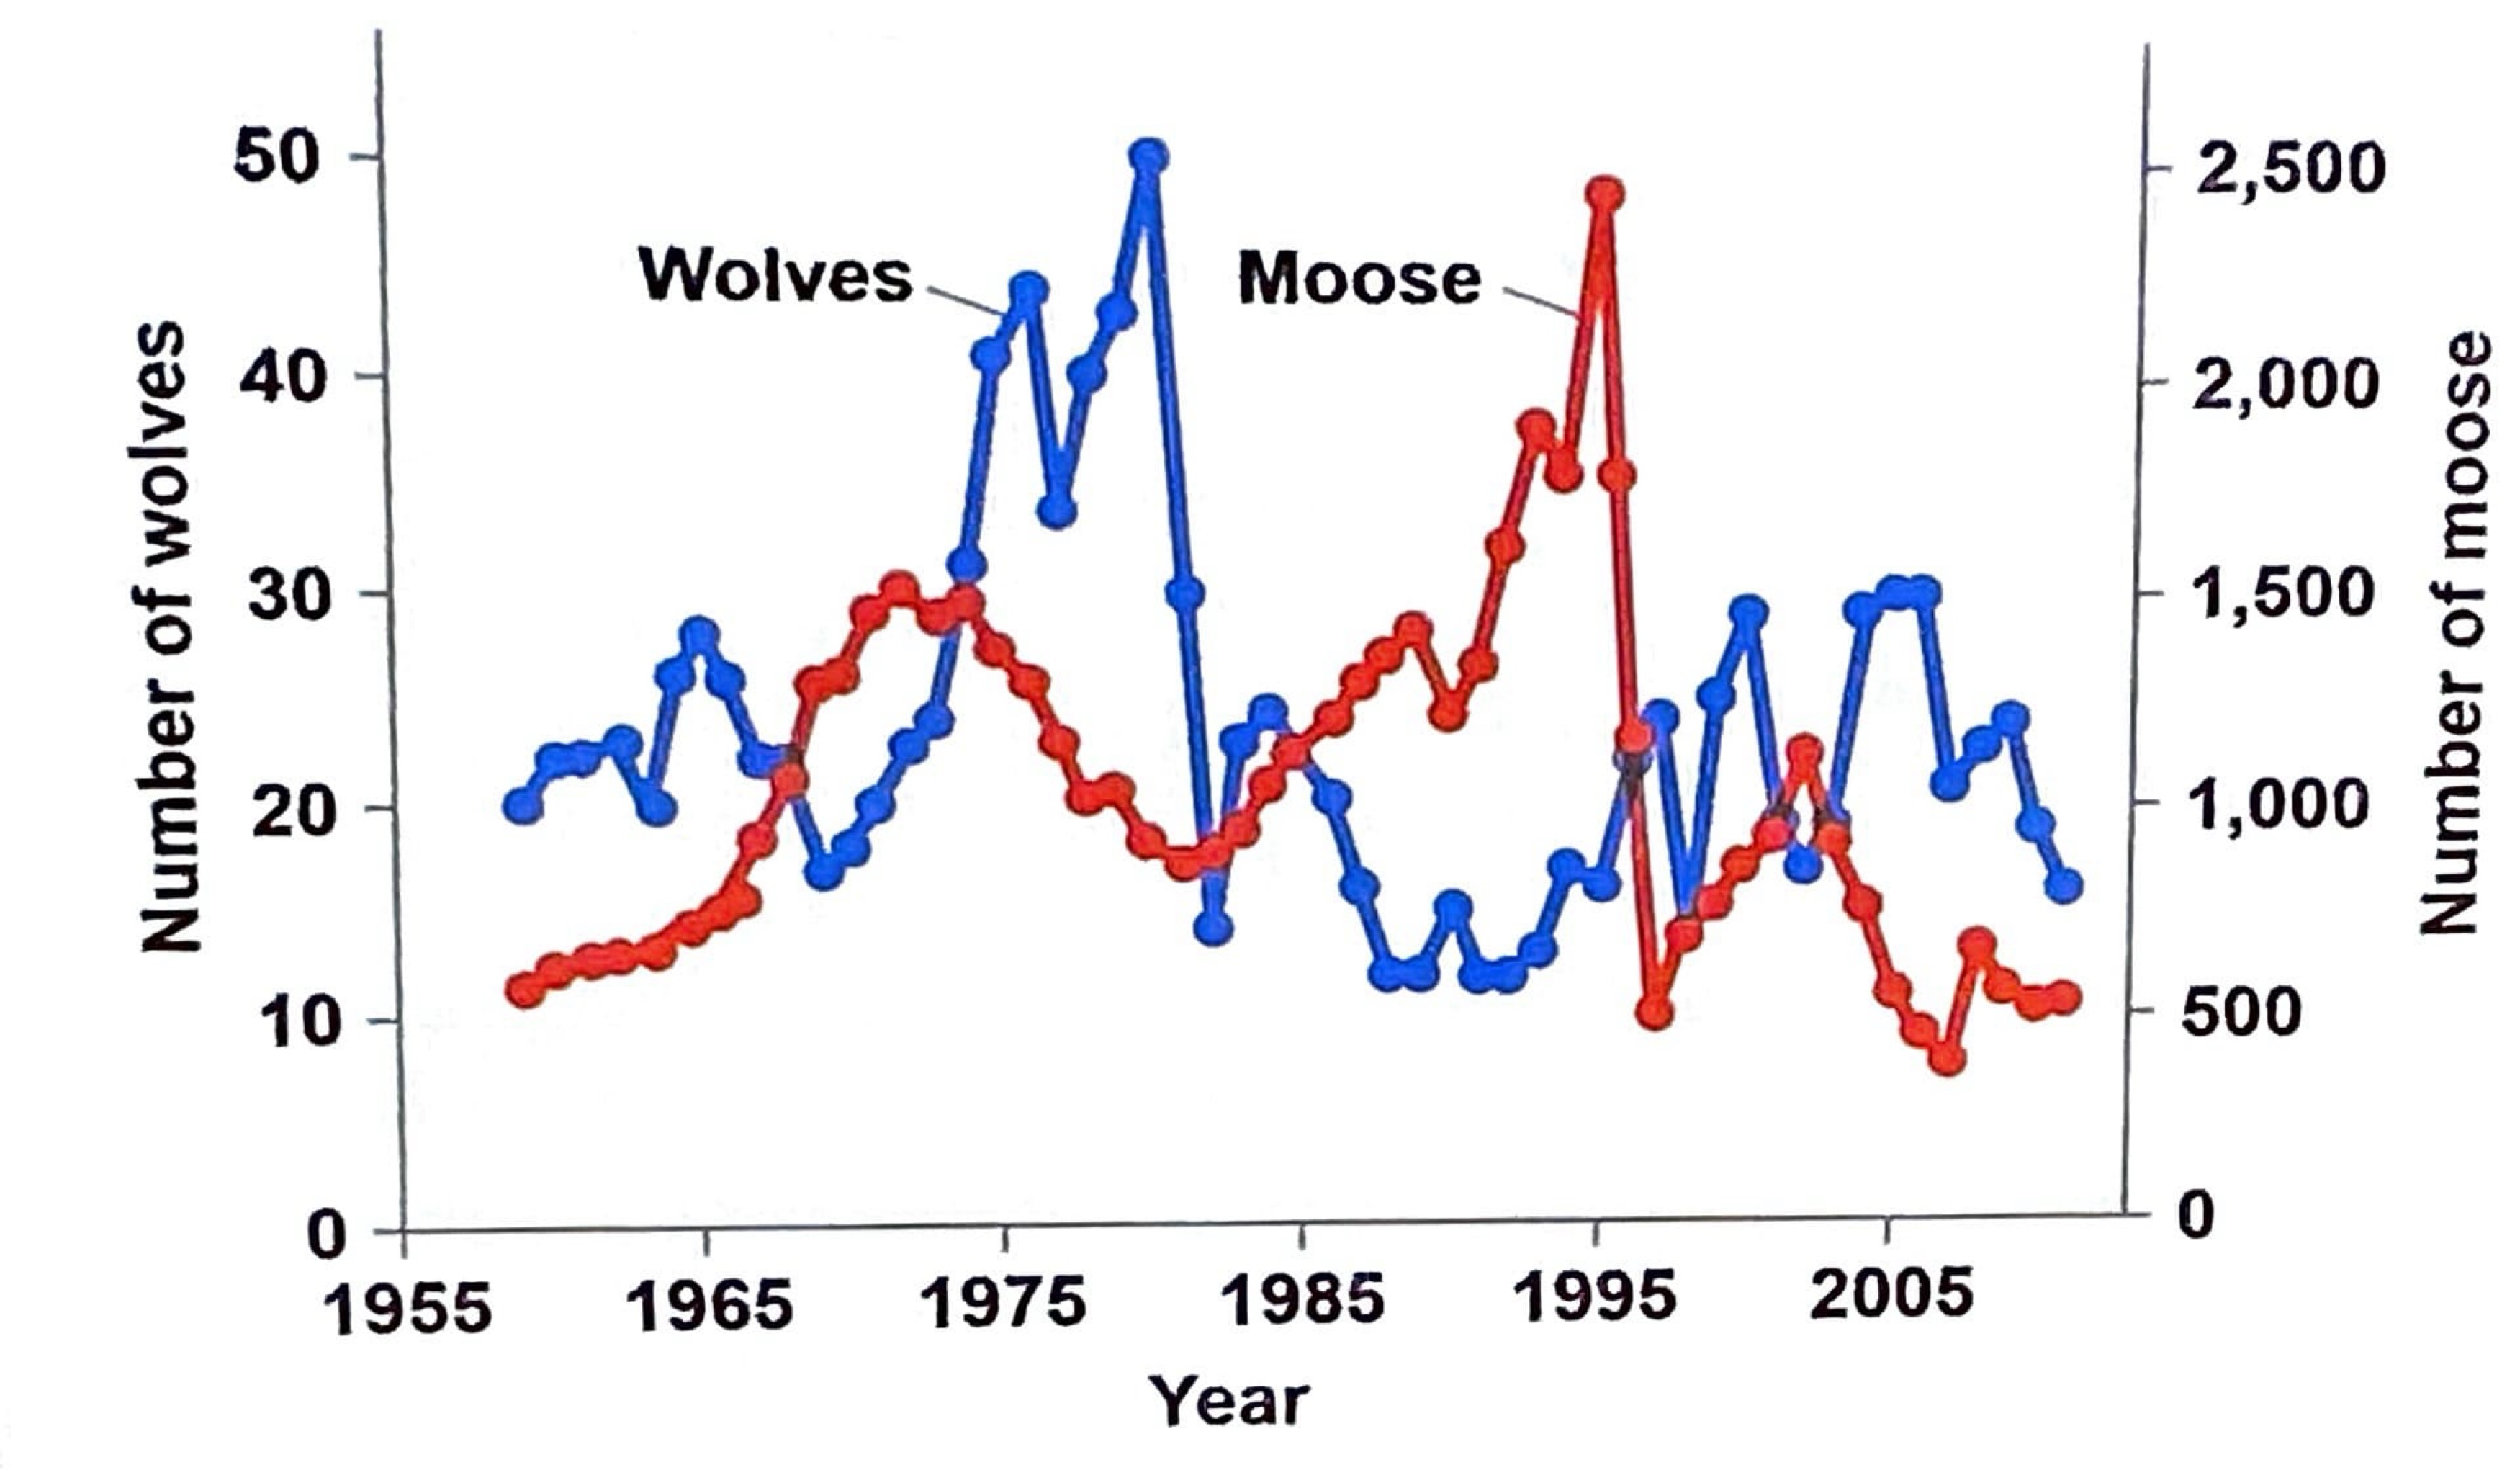
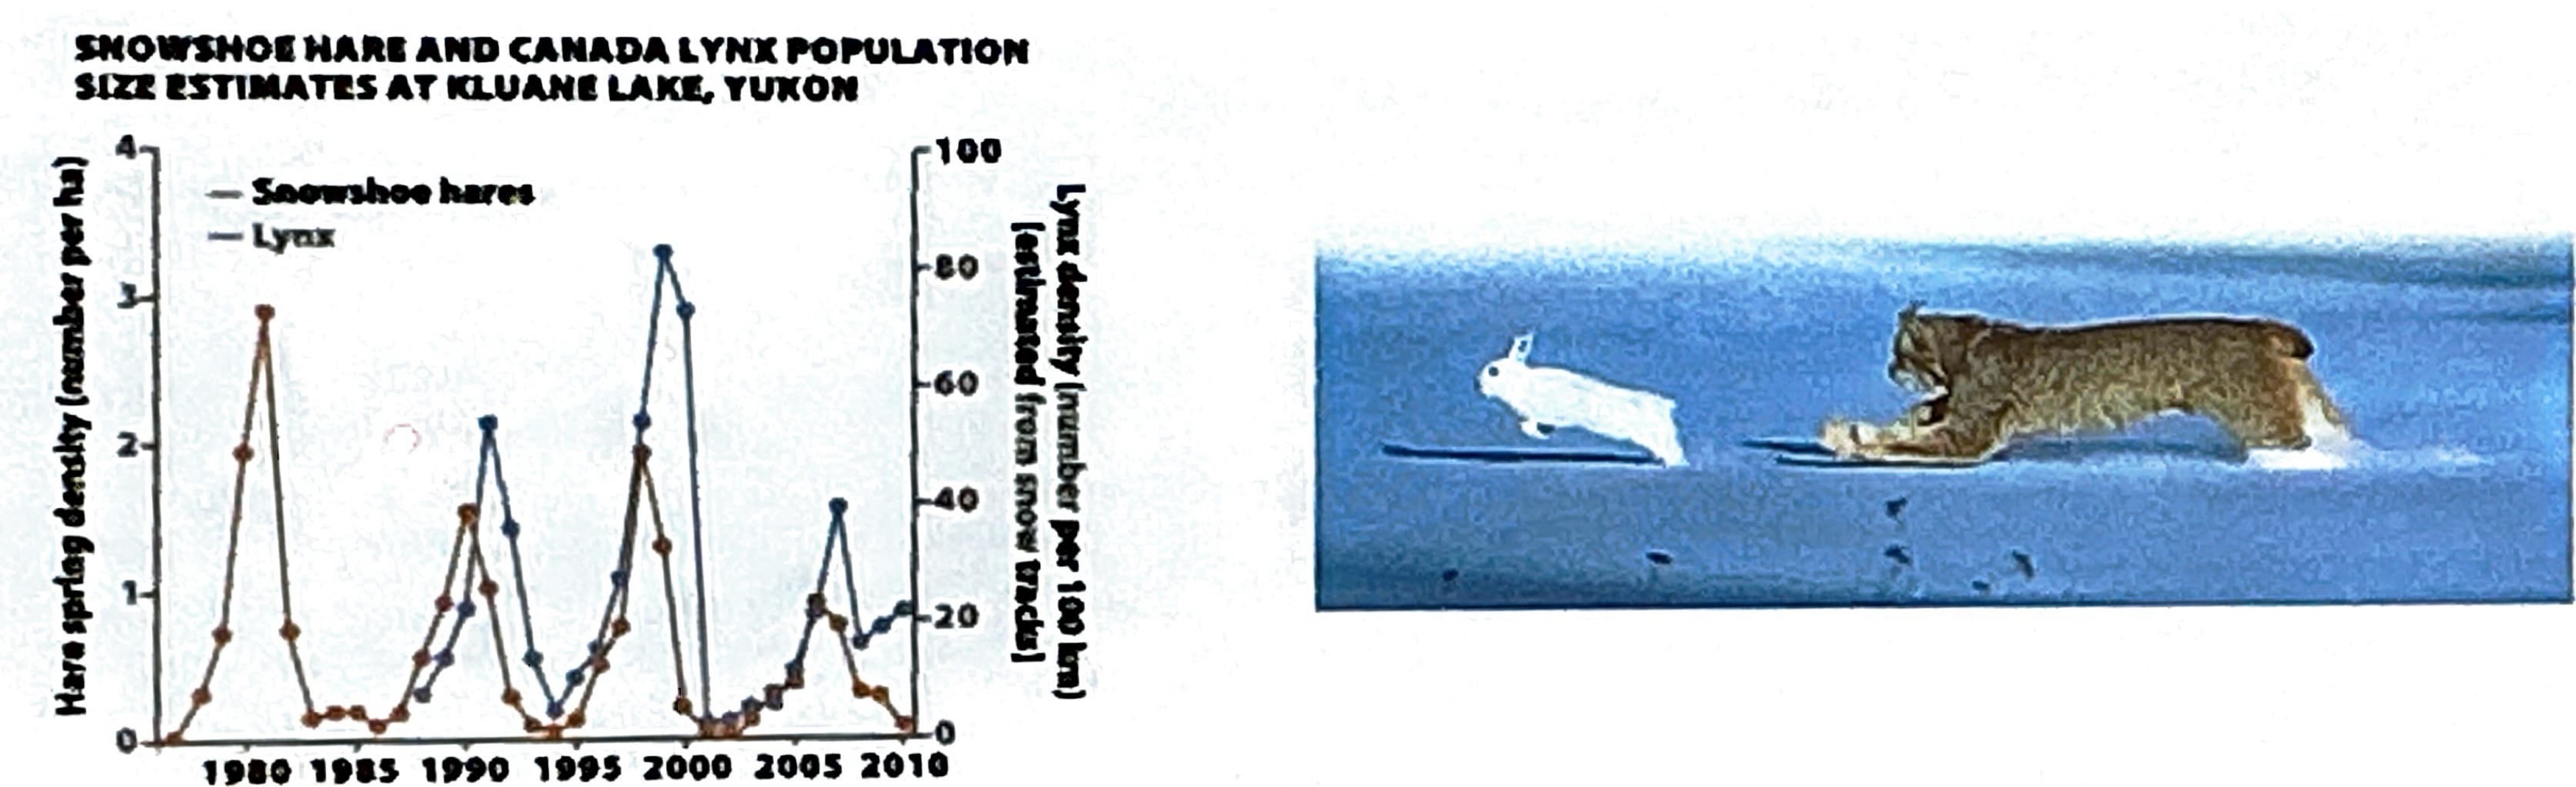
Define Boom-and-Bust Cycles
Fluctuations in population size characterized by rapid growth (boom) followed by dramatic declines (bust), often due to resource availability and environmental changes.
Predator and Prey relationship
Exampls: Zooplankton(predator) and phytoplankton(prey)—>the more zooplankton the more fish
Define Metapopulations
are groups of populations linked by immigration and emigration
Usually local populations are surrounded by both suitable and unsuitable habitats
Local Population becomes extinct but can be recolonized by another patch in a suitable habitat