PBSI 301: Factorial ANOVA
1/16
There's no tags or description
Looks like no tags are added yet.
Name | Mastery | Learn | Test | Matching | Spaced | Call with Kai |
|---|
No analytics yet
Send a link to your students to track their progress
17 Terms
Conditions of Factorial ANOVA
examining the difference between two or more groups of one or more variables
different participants in each groups
dealing with more than one factor
Factorial Design Notation
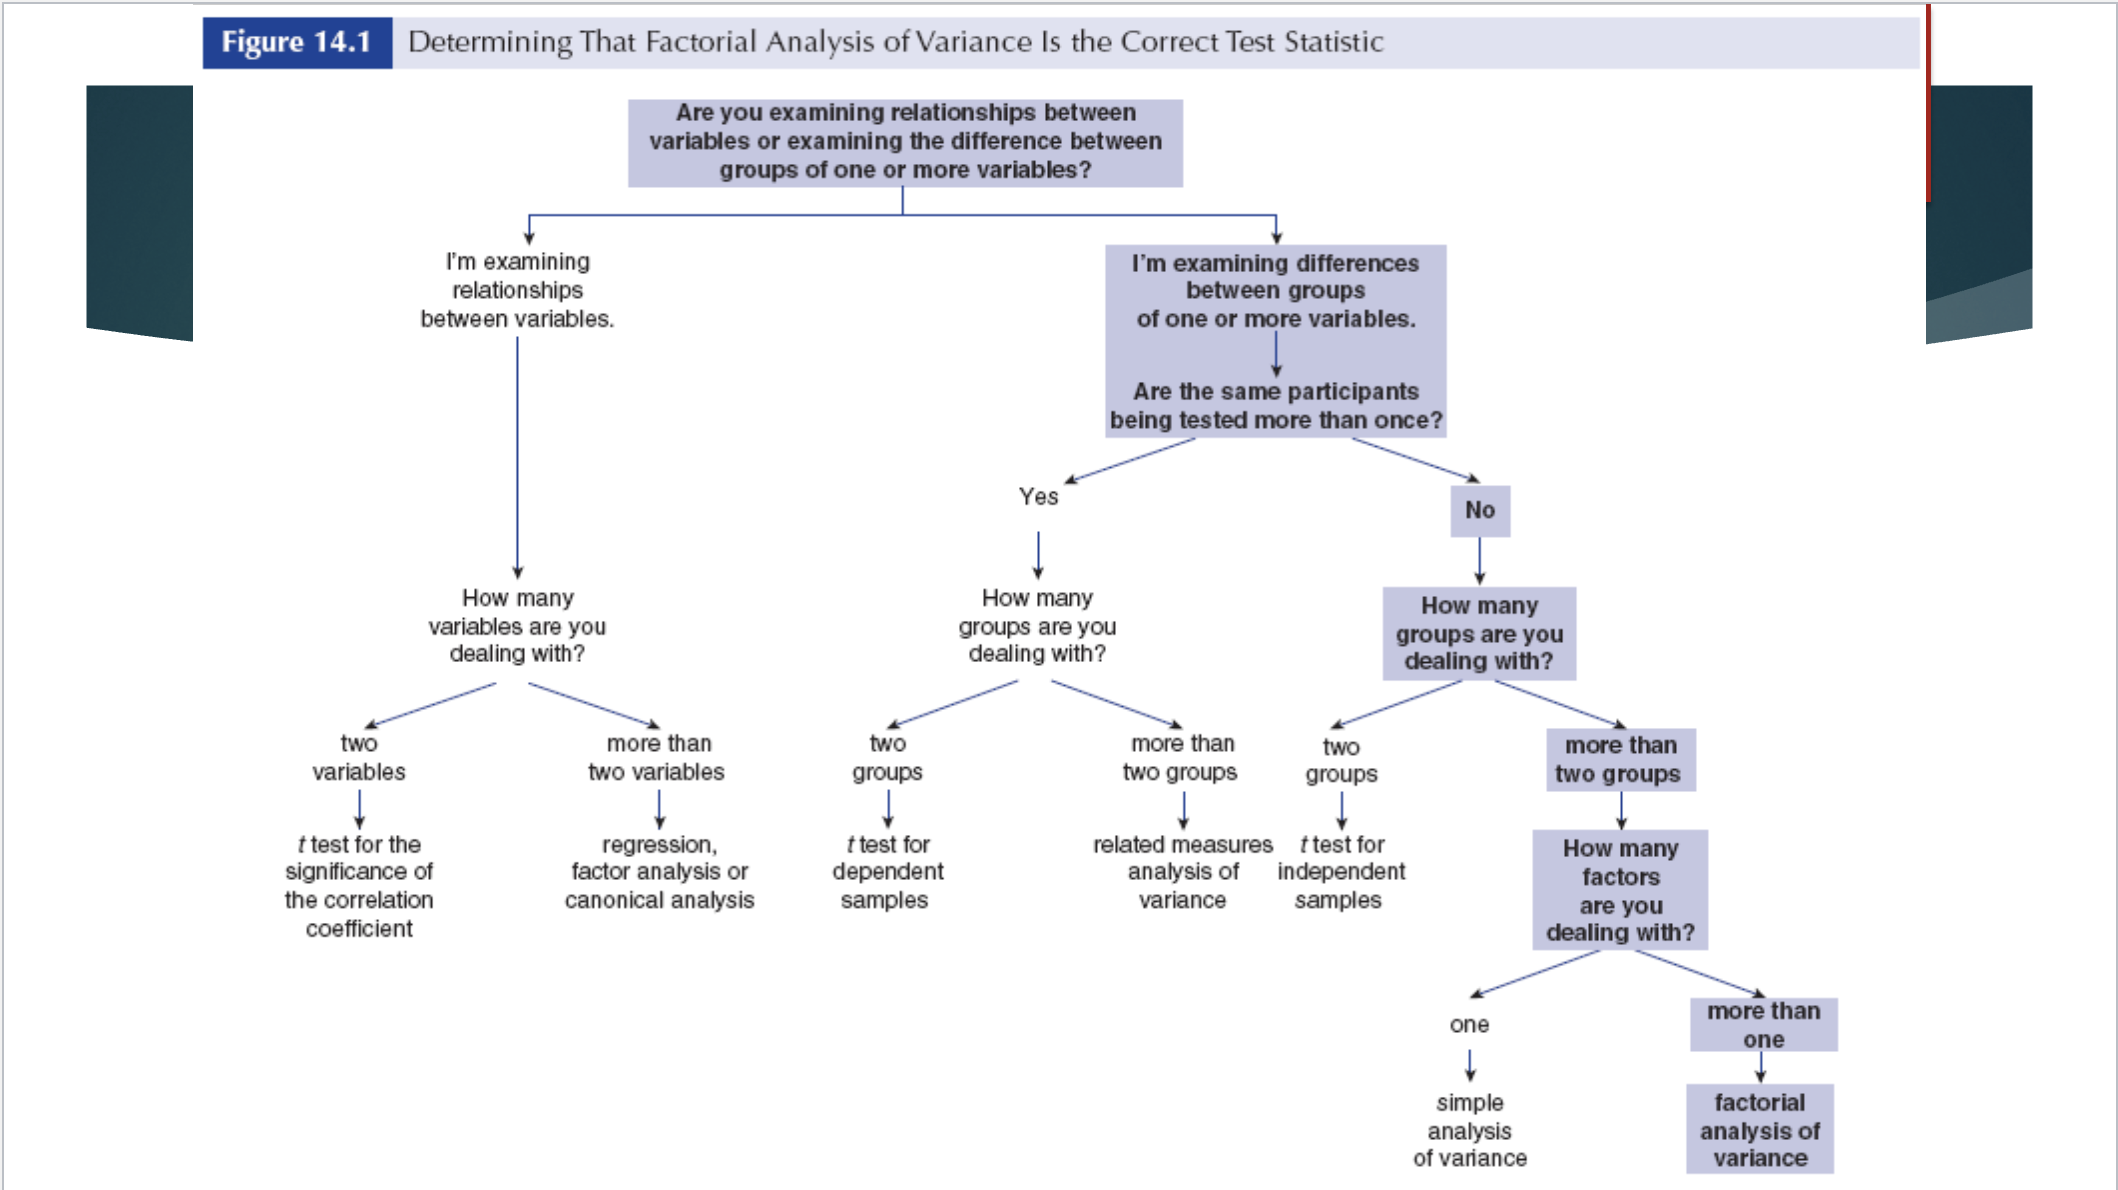
2 × 2 design
2 × 3 design
3 × 4 × 5 design
What does 2 × 2 design mean
amount of numbers = number of factors (IV)
value of numbers = number of levels
therefore, 2 factors with 2 levels of each
conditions = 4 ( 2 × 2)
what does a 2 × 3 design mean?
2 factors
one factor with two levels and another with three
conditions = 6
what does 3 × 4 × 5 design mean?
3 factors one with 3, another with 4 and another with 5
conditions = 60
Factors v. Levels
Factors are a categorical independent variables, while levels are the different categories within the factor
e.g the factor is Public Universities and the levels are Texas A&M, University of Florida and Penn State.
Example: We recruit younger and older adults to
participate. We give half of each age group
testosterone shots and half placebo shots.
how many factors?
how many levels?
what would this be called?
2 factors: age and testosterone usage
2 levels: young and older adults
2 levels: testosterone shot and placebo
called: 2×2 design
Example 2: Students are asked to point to 3 unseen locations:
one near campus, one a nearby city, and one a distant city. All
participants are in a windowless room. Half use a compass,
half do not.
how may factors?
how many levels?
what would the notation be called?
2 factors: compass and location distance
2 levels: students that use a compass and those that do not
3 levels: one near campus, one in a nearby city, one in a distant city
2 × 3
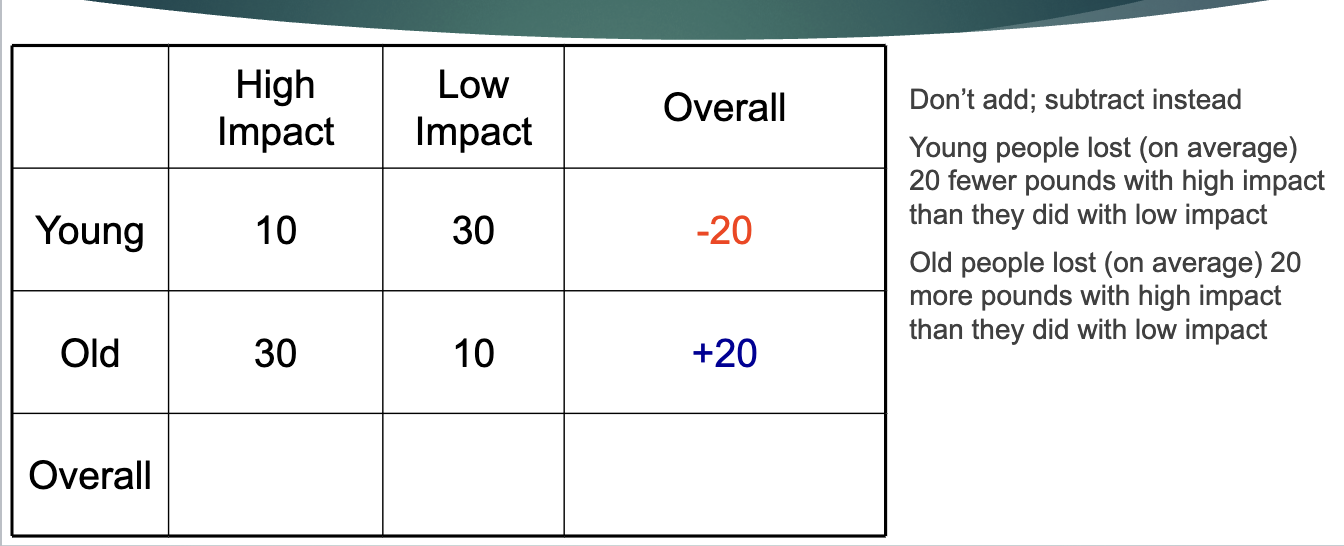
two things to look for in factorial design
main effects: overall effect of a factor, ignoring the others
interactions: if the effects of one depends on the other
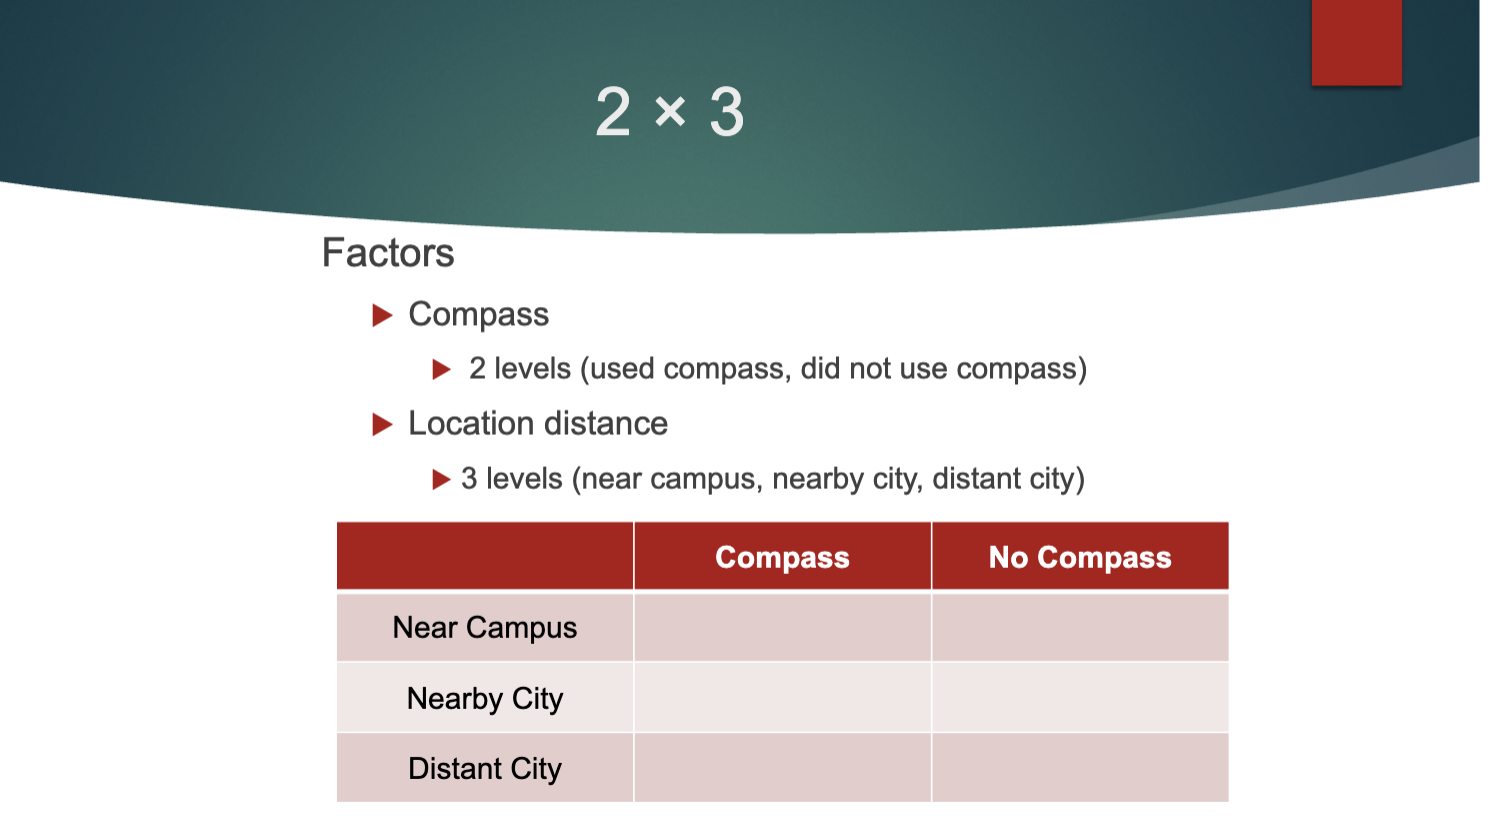
Main effect
overall effect of a factor, ignoring the others
as many possible as there are factors
Interactions
the effect of one factor depends on another
detected by calculating the differences within rows/ columns
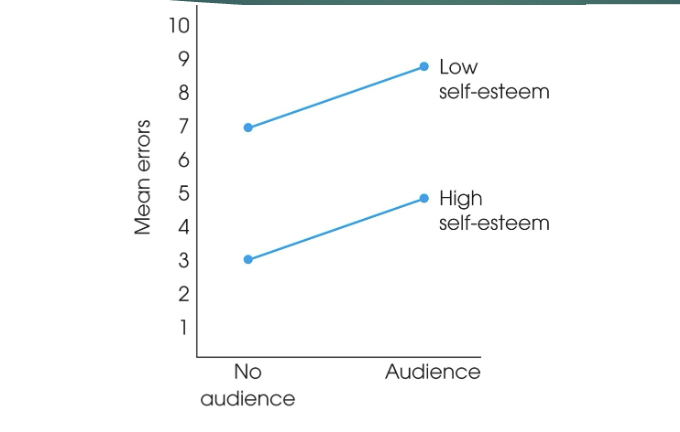
If the graph looks like this, what does it suggest about the interactions
Types of total variance
within treatment variance
between treatment variance
If we have 3 factors variances which type of total variance would they be under
between treatment variance
How to interpret this graph about weight loss in overweight compared to normal weight people?
Although overweight people tended to lose more weight than
normal weight people, the nature of the interaction suggested that overweight people tended to lose more weight on a low carb diet, while normal weight people tended to lose more weight on a low fat one.
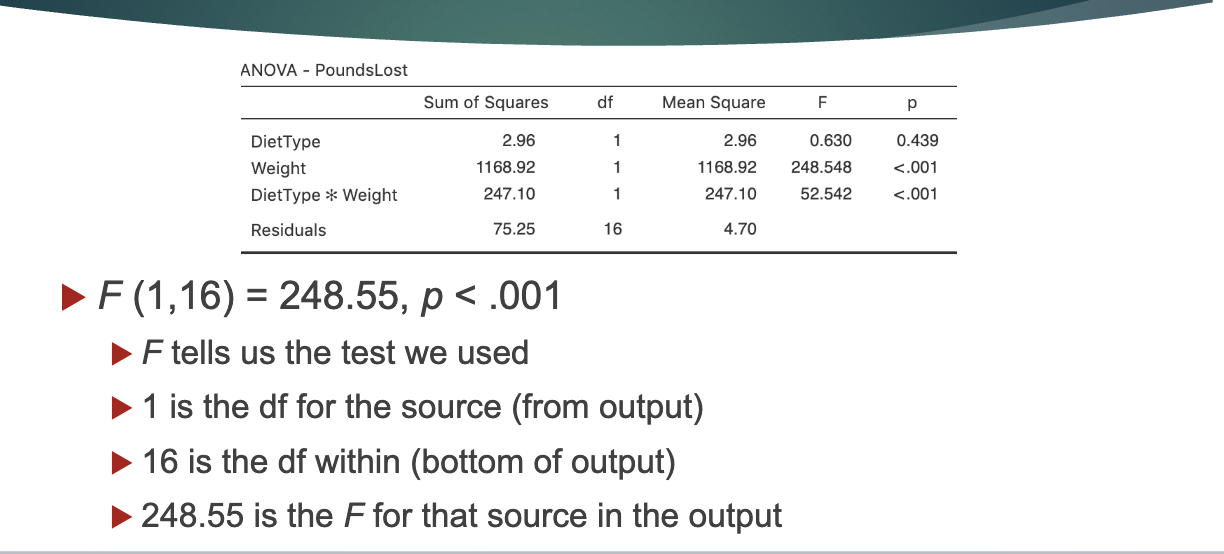
Factorial ANOVA write up;
A factorial ANOVA revealed a significant main effect of
weight, F(1,16) = 248.55, p < .001, and a significant
interaction between weight and diet type, F (1,16) = 52.52,
p < .001. The main effect of diet type was not significant, F
(1,16) = 2.96, p = .44.