Stats MDR + Stats Equations
1/33
There's no tags or description
Looks like no tags are added yet.
Name | Mastery | Learn | Test | Matching | Spaced | Call with Kai |
|---|
No analytics yet
Send a link to your students to track their progress
34 Terms
Types of Data
Categorical (nominal)
Qualitative
Quantitative
Ordinal - characterizations of data that have an inherent order
Numerical - observations for which the differences between numbers have meaning on a numerical scale
Types of Numerical Scales
Continuous (interval or ratio)
Has values on a continuum (e.g. age)
Discrete
Has values equal to integers (e.g. number of fractures)
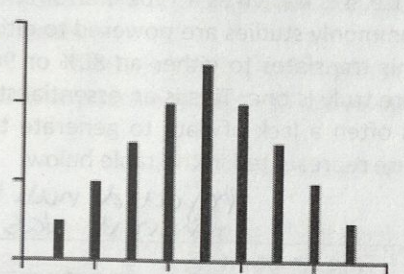
Normal distribution of data
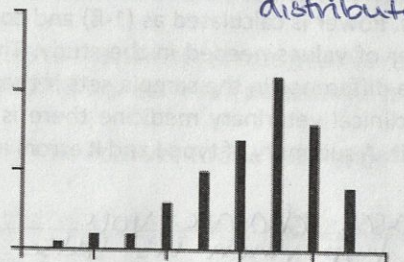
Positively skewed data
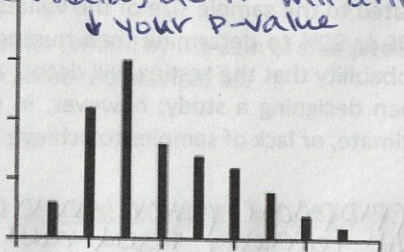
Negatively skewed data
What happens if you run parametric tests on nonparametric (not normally distributed) data?
It will artificially decrease your p value
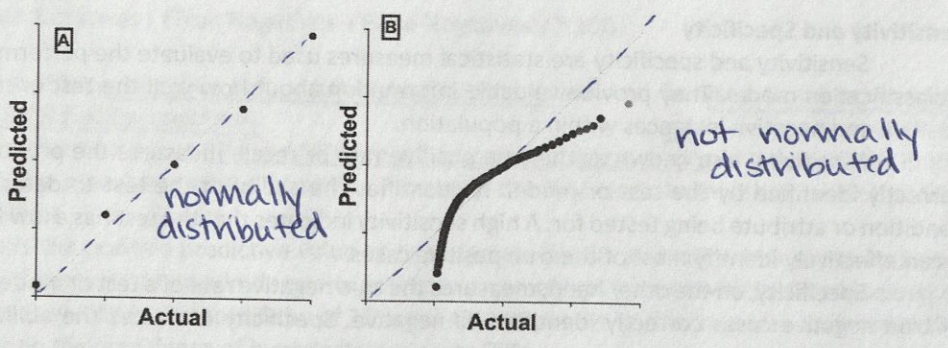
QQ Plot
Quantile vs quantile plot
The data is plotted in theoretical vs actual quantiles of the data being analyzed
Dotted line shows an exact Gaussian distribution
What statistical tests can be used to determine normality?
Shapiro-Wilk
D’Agostino-Pearson
What is the central tendency of normally distributed data reported as?
Mean value
Arithmetic average of the observations
What is not normally distributed data reported as?
Median value
Middle observation
What is the spread of data for a normally distributed dataset presented as?
Standard deviation
When the data is not normally distributed, what is the spread opften reported as?
Either the 25-75th percentiles (interquartile range), the range, or both
Interquartile range is used when trying to display the central 50% of data regardless of shape
Range is used when the purpose is to emphasize extreme values
Null Hypothesis
A statement claiming that there is no difference between either an assumed value or between groups
P Value
The probability that the null hypothesis should be rejected
If the P value is less than 0.05 then those results are considered “significant”
Accepting there is a less than 5% chance that rejecting the null hypothesis was the wrong decision
The lower the P value, the less change that rejecting a correct null hypothesis has occurred
Type 1 Error
Rejecting the null hypothesis when it is correct
Power
The probability of rejecting the null hypothesis when it is false
The ability to detect a true difference
Powered to 80-90% means 80-90% probability that the testing will detect a difference in the sample sets if there is truly one
Type II Error
Accepted the null hypothesis when it was actually false
Sensitivity
True positive rate
Measures the proportion of true positive cases correctly identified by the test or model
Quantifies the ability of the test to detect individuals who have the condition or attribute being tested for
What does high sensitivity indicate?
The test has a low false negative rate
It can effectively identify most of the true positive cases
Good screening test
Specificity
True negative rate
Indicates the proportion of true negative cases correctly identified as negative
Evaluates the ability of the test to accurately exclude individuals who do not possess the condition or attribute being tested for
What does a high specificity suggest?
A low false positive rate
The test can effectively rule out most of the true negative cases
Good for diagnosing
Sensitivity Equation
True positives/(true positives + false negatives)
Specificity Equation
True negatives/(true negatives + false positives)
When is a higher sensitivity desirable?
When the consequences of false negatives are severe
When is higher specificity desirable?
When the consequences of false positives are significant
Positive Predictive Value (PPV)
Measure of the probability that individuals with a positive test rest truly have the condition of interest
Proportion of true positives among all the individuals who tested positive
What does a high PPV indicate?
A positive test result is highly indicative of the presence of the condition
Suggests that a positive test result is highly reliable and can be used to make accurate predictions regarding the presence of the condition
PPV Equation
PPV = (true positives/(true positives + false positives)) x 100
Negative Predictive Value (NPV)
Measure of the probability that individuals with a negative test result truly do not have the condition of interest
Determines the proportion of true negatives among all the individuals who tested negative
What does a high NPV indicate?
A negative test result is highly indicative of the absence of the condition
Suggests that a negative test result is highly reliable and can be used to make accurate predictions regarding the absence of the condition
NPV Equation
NPV = (true negatives/(true negatives + false negatives)) x 100
What influences PPV and NPV?
The prevalence of the condition in the population
As the prevalence of the condition increases, the PPV tends to increase, while the NPV tends to decrease, and vice versa
1 Sided Tests
Assume difference between groups occur only in one direction
Rarely used
2 Sided Tests
Difference between groups could occur in either direction