U3AOS2 ECO
1/142
Earn XP
Description and Tags
Domestic Macroeconomic Goals
Name | Mastery | Learn | Test | Matching | Spaced | Call with Kai |
|---|
No analytics yet
Send a link to your students to track their progress
143 Terms
Economic Activity
Economic activity refers to the actions of individuals, firms and governments such as the buying, selling and producing g/s, that help to generate the production of goods and services, employment and incomes.
What are Annualized Growth better than Annual growth?
Annual growth
Used to assess long-term trends and compare performance over full years.
Less sensitive to short-term volatility.
Annualised
Helps show the momentum of current growth trends.
More sensitive to temporary shocks or volatility in a single quarter.
What is the difference between the cash rate and the exchange rate?
Cash rate
The cash rate is a domestic monetary policy instrument, that targets interest rate set by the Reserve Bank of Australia (RBA)
Serving as a primary tool for managing inflation and economic activity
The RBA directly sets this rate, influencing borrowing costs and saving incentives for households and businesses within Australia
Exchange rate:
The exchange rate represents the value of the Australian dollar in relation to other currencies and is predominantly determined by market forces in the foreign exchange market
While changes in the cash rate can indirectly influence the exchange rate, the exchange rate itself directly impacts Australia's international trade and financial flows by affecting the relative prices of imports and exports
What are leakages and injections
Leakages = cash outflow out of the country (reduced AD)
Imports (OS)
Saving (FS)
Tax (GS)
Injections = cash inflow into the country (increases AD)
Exports (OS)
Investment (FS)
Government spending (GS)
Why might the participation rate in the graph be above the unemployment rate?
A reason for the participation rate falling and the unemployment rate increasing could be as people lose their jobs, some may become discouraged job seekers and become classified as hidden unemployed
These people do not form part of the labour force anymore as they are not actively seeking employment and therefore reduce the participation rate (reduce the numerator; labour force)
How is headline inflation measured?
The Headline inflation rate is measured using the Consumer Price Index and it measures the percentage change in prices over quarters
A basket/regiment * of goods and services are analysed, 100,000 prices of 1000 goods and services from 11 categories
The goods and services are weighted according to their importance (proportion of household income and degree of necessity)
What are some of the consequences of high inflation rates?
Students can discuss any 2 of the following referencing the impact of a high inflation rate eg above the government’s goal of 2-3% per annum.
erosion of purchasing power
redistributive effects
resource misallocation
savings and investment
international competitiveness
What does productivity growth mean?
An increase/decrease in output per unit of input
What are some aspects of the labour market?
Increase/decrease supply of labour
Price of labour/wage
Skills shortages
The competition between potential employees
Reduction in employment due to upward pressure on wages
NOTE: “decrease in the supply of labour in the labour market” not “decrease in the labour market”
What is the difference between headline and underlying inflation
The headline rate of inflation includes the price movements of all goods and services included in the CPI
However, the underlying inflation rate ultimately excludes volatile/temporary price changes, including the one off energy prices increases
Thus, the underlying rate of inflation would remove the price increases/decreases from its calculation, and thus the underlying rate, would not change, leading to the headline rate of inflation being higher than the underlying rate
How to analyse and WRITE a graph question?
Between [Sep][2022] and [2024], there is a/n [cyclical, upward, downwards] trend in the [ ], from approximately [X] units in [Sep][2022] to approximately [Y] in [2024].
*Put a ruler at the start month and the end month and measure the general direction or growth
*Each box is a whole year
The level of Economic Activity
The level of economic activity simply describes the general pace or speed at which productive activity is occurring nationally.
speed at which productive activity is occurring → measured through GDP
2 reasons Economic Activity Impacts LS
Society can only satisfy growing needs and wants through increased production. → Relative Scarcity→ Favourable AS conditions needed
Higher levels of economic activity are not sustainable long term due to limited non-renewable resources.
Material Living Standards
Refers to the access of physical things we have which improve our economic wellbeing.
E.g. money in the bank, a house, car, laptop, a ridiculously large TV.
Refers to access to G/S
Non - Material Living Standards
Refer to the non-tangible aspect of life that impact on our overall quality of life.
E.g. crime rates, stress levels, leisure time, education rates, trust in government
How can Environmental Quality affect LS?
Material living standards (economic well being or access to goods and services) —> may increase as the deterioration of environmental quality may be due to increased production. If there is increased production then derived demand for labour may increase, if this happens then unemployment decreases and income levels increase as more people are employed and earning a salary which they can spend on goods and services.
Non-Material LS —> if production increases causing a deterioration of environmental quality, the non-material living standards may decrease due to lower air quality and unclean drinking water decreasing the quality of life for people
The Business Cycle
Looks art the economics activity that takes place over an extended time frame.
Refers to the wave-like ups and downs in a nation's level of production or economic activity.
The short- mid- term cyclical swings in economic activity ← Affected by AD (short - term)

What happens when the business cycle meets the dotted line?
When the graph meets the dotted line (the average growth trend) we are at domestic economic stability.
Expansion/ Recovery Phase
Signalled by rising GDP growth
falling unemployment ← Increased derived demand
inflation gradually rises. ← close to productive capacity
The Peak/ Boom Phase
Unemployment reaches its lowest level
inflation is a high
GDP is high - high economic growth above the sustainable rate of economic growth. (3%>)
BC and CC is high —> encourages spending —> reduction in savings
Strong demand —> more production —> more labor
Leakages < injections
Shortages —> inflation
Demand for borrowing increases (in order to spend more) —> interest rates increase
*Side note: not all peaks are considered booms
Why is boom unlikely to last a long time?
Unsustainable due to the amount of resources the economy has access to and uses
Inflation will be too high —> purchasing power decreases —> demand decreases/ or gov intervenes
All the resources are used (at productive capacity)
The slowdown/ Contraction Phase
GDP slows, and in severe cases production falls. (severe production falls)
After a time lag, unemployment will rise
inflation eases.
More saving
The Trough/ Recession Phase
Slowdown in the rate of economic growth
unemployment rises further.
Inflation at a low
Leakages > injections
Spare capacity or excess —> lower prices for g/s and labor
*Side note: not all troughs are considered recessions
What is Stagflation?
Periods of low economic growth, high unemployment rates and high inflation rates
*boom —> strong production, high inflation and low unemployment
recession —> weak production, low inflation and high unemployment
When does a Technical Recession occur?
2 successive quarters of negative economics growth
Hence why an economy can be in a trough but not reach a recession (e.g. 2008-9 aus economy)
Prolonged period or recession is referred to as a depression
State 2 reasons how Economic Activity impacts LS?
Society can only satisfy growing needs and wants through increased production. → Relative Scarcity→ Favourable AS conditions needed
Higher levels of economic activity are not sustainable long term due to limited non-renewable resources
Factors that influence LS?
Access to goods and services, Real GDP
If it increases it means people have more access to g/s
Environmental quality - If resources depleted at an excessive rate, then MLS can decline, as in the future it may difficult to extract resources, mincrease COP, reduced Purchasing power, - ppl feel energised from green spaces & Happier
Physical and mental health
Life expectancy
Crime rates
Literacy rates
Domestic Economic Stability
Domestic economic stability is a desirable or ideal level of economic activity where, simultaneously, there is low inflation, a solid and sustainable rate of GDP and low unemployment.
Long-Term Trends for Economic Activity
Over time, rises in economic activity should outweigh the falls so that the average growth can trend upwards on the business cycle.
What is Affluenza?
The idea that the addictive pursuit of more and more goods and services is damaging to the mental health of an individual, as their desires can never be satisfied→ Also referred to as the ‘hedonic treadmill’
Productive Capacity
Productive capacity is the potential level of national production of goods and services dictated by the quantity and efficiency of a nation's resources. This determines the sustainable rate of economic growth in the long term.
Economy only grows if Productive Capacity grows→ driven by AS
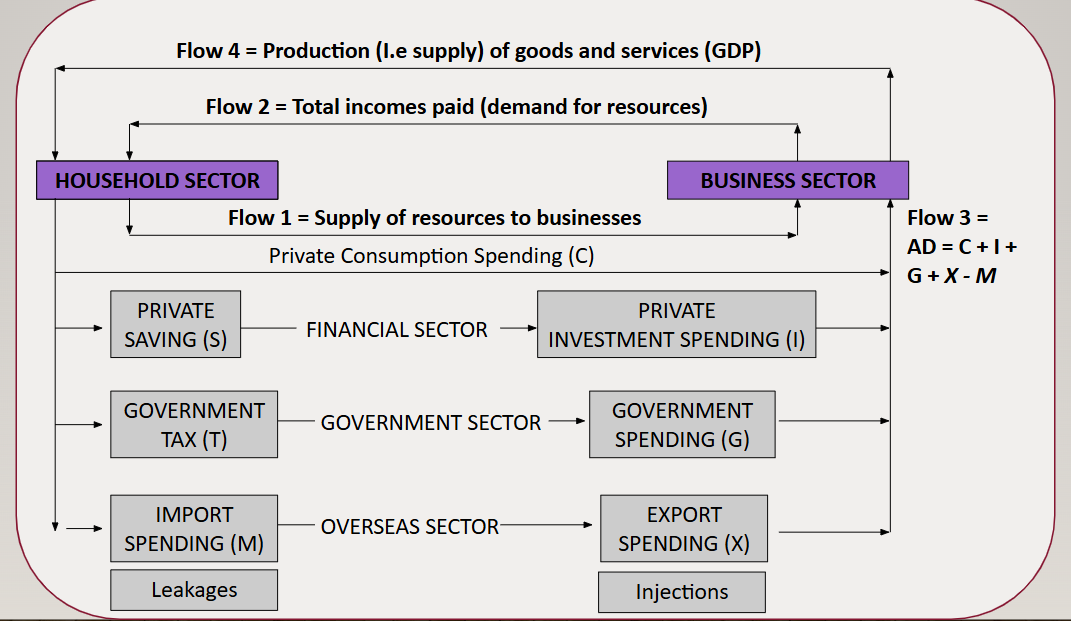
What is the Circular Flow Model?
The circular flow model of income shows the flow of money, resources and goods/services in an economy
Illustrates how the Australian economy works and how it's parts are interrelated.
Additionally, it identifies some of the macroeconomic variables affecting our country's economic conditions.
PRIVATE g/s
What is the Household sector?
Some members sell their resources (natural, labour and capital) to business firms and use the money received to demand or buy finished goods and services.
What is the Business sector?
Purchases or demands resources from households, which are then converted into finished goods and services.
What is the Financial sector?
Banks, building societies, stock exchange, credit unions and finance companies.
These organisations borrow household savings (S) and lend these to creditworthy customers to finance investment spending and business expansion (I).
What is the Government sector?
Collects revenue from taxation (T) and other sources, and uses this to pay for government spending (G) and other outlays that help to provide collective goods and services for society to use.
What is the Overseas sector?
The amount we spend on imports (M) compared to what gain from selling exports to people overseas (X).
What is Flow 1
The supply of resources: When the household sector supplies, or makes available, resources for use by the business sector.
What is Flow 2
Total incomes paid or the demand for resources: where the business sector purchases or demands resources by paying different types of incomes to the household sector.
Eg. Income and wages, rent and interest payments.
What is Flow 3
Total expenditure or aggregate demand.
Households
Financial sector
Government sector
Overseas sector
AD is influenced by the total value of leakages (S + T + M) relative to the total value of injections (I + G + X)
What is Flow 4
The flow of final goods and services supplied (GDP)
Is the total value of finished goods and services produced or supplied by the business sector over a period of time.
This flow reflects the overall level of Australian economic activity and is commonly measured by GDP.
What is Aggregate Demand?
Aggregate demand is the total value of all expenditure on goods and services in an economy over a period of time.
Provides incentive for business to increase production —> generate income growth in the country

What is Aggregate Demand made up of?
Private consumption expenditure – total household spending on goods and services.
Durables (car), semi-durables (clothes), single-use (food), services
Private investment expenditure – business investment in plant, equipment, building and vehicles are are used in the production process
Purpose is to expand productive capacity and productivity
Quite volatile as businesses are continually changing their forecasts about future profitability
Government expenditure – infrastructure spending and government outlays
G1 - Gov. current expenditure (metro tunnel)
G2 - Gov. investment expenditure (to long-term projects and provide on-going benefits) - infrastructure
Exports – foreign nations purchasing Australian goods or services.
Imports – Australians purchasing goods and services from other countries.
Savings and Tax are not included in the calculation because although they are not contributing to AD currently they will in the future.
Investment spending is also not included in private investment spending, as a transfer of investment does not lead to any change in AD.
Don’t use welfare payments as an example of government expenditure
Why are Imports deducted from the AD equation?
Import spending is actually included in each of the other components of AD
E.g. When a TV is purchased at a retail outlet, the total value of the TV will be included in the C component of AD.
The retailer will pay the importer an amount and then add a profit margin. The profit represents the value ‘leaked’.
Therefore no need to pay ‘leakages’ twice.
The import component therefore needs to be deducted (because it is included in C) so we can calculate the true value added (contribution to production) in Australia.
What factors affect Aggregate Demand?
Disposable income (C)
Interest rates (C)
Consumer confidence (C)
Business confidence (I)
The exchange rate (X and M)
Rates of economic growth overseas (X only)
*Think about what is impacted
How to structure an Aggregate Demand question?
Describe the changing factor (Increase/ decrease)
Outline how it impacts (Increase/ decrease) a component of AD (C, I, G, X or M)
Can’t just say C —> “Private consumption expenditure”
State how it then impacts AD overall.
What is Aggregate Supply?
Is the total supply of goods and services that a nation can potentially produce. It is especially affected by the availability of a nation's resources and the efficiency in which these are used.
This then limits our potential for growth in the short term.
What is the point of focusing on AS as well as AD?
AD might be increasing but if businesses and the government cannot increase their production levels to meet this demand then growth is likely to stagnate.
Therefore governments have, over time, focused their attention not only on AD but also on factors that influence the level of AS.
To expand the economy over time, the nation’s AS must rise so that growth in AD can be met with growth in the production of goods and services (i.e. AS)
Just in general, high prices in the economy tend to have a negative effect on the total spending because…?
Lvl of purchasing power decreased —>
Lvl of spending decreases
Negative impact on international competitiveness
Reduction in exports
Increase in imports (cheaper)
Leakages > injection = AD decreases
What is Business confidence?
Business confidence measures the general level of optimism (or pessimism) about the future state of the economy (from a firm’s perspective).
The level of business confidence can be influenced by:
Social trends (e.g. cancel)
Increased tariffs
The likelihood of increased competition
Changes in, or uncertainty surrounding, government policy (tax laws)
Future costs associated with the production of their products and the availability of inputs
Expected rates of inflation
What factors affect Aggregate Supply?
Quantity and quality of the factors of production
Costs of production
Technological change
Can impact the quality
Productivity growth
Usually labor
How much output can be achieved
Impacts technical efficiency
Exchange rates
To importing raw materials
This increases/ decreases cost of production
Climatic conditions
Other events including government regulations
NO TAX (not a cost of production)
Excise tax
Disruptions to international supply chains
*NOT necessarily stand alone
ASF: the difference between quality and quantity of factors of production
Quality
Quality of soil
Farmers may use artificial pesticides that are worse for soil in and negatively affects the ability of farmers to grow food in the long run and therefore reduces AS in the economy
Quality of labor
Improve their knowledge and skill, Health
Quality of Capital
Better technology, for example, access to a faster broadband network should increase the ability of firms to offer goods for sale in foreign markets.
AI may also result in less wasteful and more productive production methods that increase the ability and willingness of firms to supply.
Quantity
No. of inputs increase
Discovery of new resources
Increased pool of skilled labout
High
What does China get from AUS?
Coal and minerals
What is Consumer confidence?
Consumer confidence measures the general level of optimism (or pessimism) about the future state of the economy (from a consumer’s perspective), employment prospects and their future financial situation.
The level of consumer confidence can be affected by a range of sub-factors including (but not limited to):
Perceived employment prospects
Future prospects of the economy
Media reports on global economic conditions
Geopolitical events such as terrorist attacks or a decision by the two major economies in the world (the US and China)
Climatic conditions
Changes in the government or its leader
CURRENT: Increasing rate
What talking about Economics activity you have to…
Expenditure (increase/decrease) —>
Production (increase/decrease)
Productivity (increase/decrease)
Therefore a growth in economic activity
*You CANNOT say AD leads to an increase in economic activity, you have to talk about expenditure and economic activity
When talking about AS, you want to link the factors to…
Link - very specific
Always link to how the factors:
Are favourable/unfavourable
Increase or decrease willingness or ability to produce
Increase or decrease productive capacity (by referring to production costs and productive efficiency")
Real GDP increases/decreases
Improve labour efficiency, increase AS
In the simplest form, all of these factors either impact cost of production or efficiency for business.
Example: The article mentions several aggregate supply side factors that influence the producers willingness and ability to supply goods and services to the economy. “cheaper gas and electricity, a highly skilled workforce, reduced red tape, greater collaboration between research and industry, support to commercialise”.
All these suggestions allow the increase in productive capacity in the economy by lowering costs of production and increasing productivity and efficiency.
These factors will shift the AS curve to the right increasing economic activity (output) and easing cost inflation. The increase in GDP and reduction of the general price level enable the achievement of the government’s goal of strong and sustainable economic growth.
Graphs
Decide if it is a AS or AD shift
Remember AS is weird looking because it reaches productive efficiency
Describe price increases as accelerating and decreases as easing
What is Economic Growth?
Refers to any increase in the amount or level of national production that has occurred over time
What is the Goal of strong and Sustainable economics growth?
The Government’s goal for strong and sustainable economic growth is to achieve the highest growth rate possible consistent with strong employment growth, but without running into unacceptable inflationary, external or environmental pressures.
*HAVE TO WRITE THAT above
Environment Pressure - refers to natural resource depletion, pollution, climate change
External pressure - refer to overseas pressure
Why pursue strong rates of economic growth?
Growth of incomes allows more people to have access to more goods and services which improves MLS and improve their quality of life, hence improving NMLS.
High rates of economic growth —> more charitable
Lower unemployment to improve both MLS and NMLS. In addition, higher employment levels will involve a greater sharing of the income gains from economic growth, further contributing to material living standards or welfare.
Increased ability of government to provide essential services
What is the Sustainable rate of growth?
This sustainable rate is generally considered to be within the range of 3 to 3.5% GDP growth per year.
The Government also takes into account international growth rates when analyzing the acceptability of our growth rates.
The most up to date current measurement of the GDP annual growth rate is 1.3% as of December 2024 (???????????)
How can the sustainable rate of growth vary?
During periods when productivity growth is strong (such as during the 1980s), it is possible for growth to be above 4% and remain sustainable.
This is because the nation’s productive capacity is being expanded by productivity growth, allowing stronger demand and production to take place without inflationary or external concerns.
However, if productivity growth is slow, or if the nation’s productive capacity is being stretched, even growth rates below 3% may be ‘sustainable’.
Like during the 2020 downturn, economic growth was sometimes below 3%, but the government was reasonably happy with the outcome considering productivity growth was relatively low.
What happens when economics growth is LESS than 3% p.a.
If economic growth was less than 3% p.a. annually, then unemployment would soon ↑ → growing poverty and inequity in income distribution → ↓ material and non-material living standards.
What happens when economics growth is HIGHER than 3% p.a.
If rates of economic growth were consistently higher than 5% p.a., then the pressures created would make it hard for govt to achieve other objectives like low inflation.
What happens when the growth rate is TOO HIGH
The key term is sustainable where sustainability in this context is underpinned by three important considerations.
Growth cannot be so high that it:
Causes inflation to rise to unacceptable levels (e.g above the Govt goal of 2-3%)
Results in external pressures on the economy (creates an excessive Current Account Deficit or foreign debt)
Leads to environmental pressures which means an overuse of the nation’s natural resources (which unfairly burdens future generations)
How does Australia measure Economic Growth?
Using Annual Real GDP Growth
GDP figures are released each quarter by the ABS.
What does GDP mean?
GDP stands for Gross Domestic Product and represents the annual value of goods and services produced or sold in a nation over a period of time after removing the impact of price increases (inflation).
How do we calculate Real GDP
To calculate the value of Real GDP growth we need to take away the inflation that has occurred in the same period.
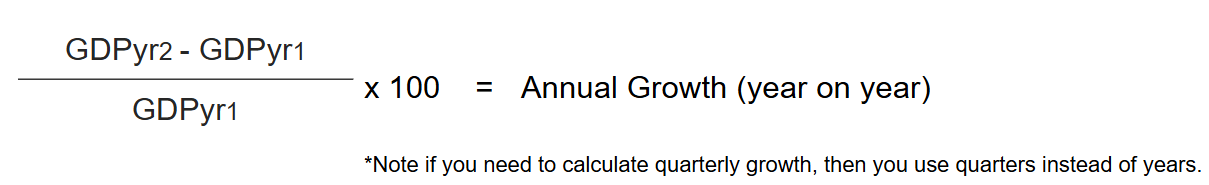
What is the difference between Annual and Annualized Growth?
Annual Growth figures: Year on Year growth rate takes the GDP figure for the latest quarter and compares against the same quarter one year earlier and the percentage increase or decrease is calculated
Annualised Growth: multiply the quarterly growth rate by 4. Annualized growth rate can tell us more about the volatility that is occurring in the economy.
What is jobless growth?
Jobless growth refers to when a higher output is achieved via greater productivity of existing inputs, negating the need to hire additional labour.
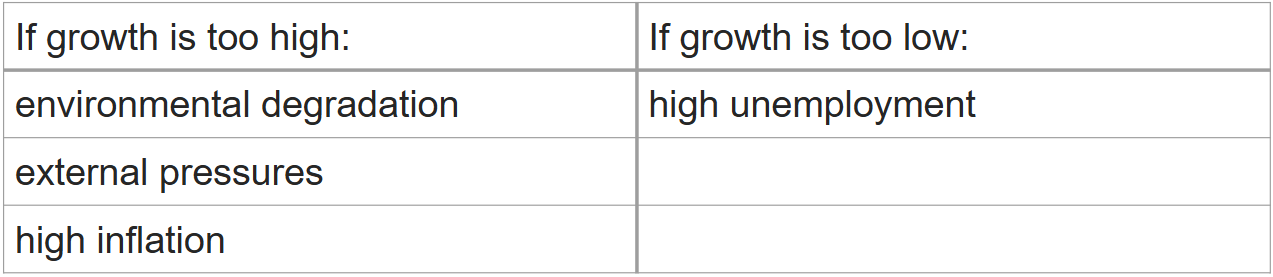
What are the consequences of not achieving Strong and Sustainable Economic Growth (SSEG)?
Consequences of not achieving the goal of strong and sustainable economic growth and its effect on living standards, including environmental degradation, external pressures, high inflation if growth is too high, and high unemployment if growth is too low
MEMORISE ABOVE
*When talking about living standards you must refer to NMLS and MLS
What are the consequences of not achieving SSED where economic growth is above the target rate on Inflation?
Demand inflation is likely to occur as widespread shortages occurs putting upward pressure on prices
Material living standards may decrease due to erosion of purchasing power leading to limited access to goods and services and a consequent decrease in economic well-being.
Non-material living standards may decrease due to the stress of the increase in cost of living and a decrease in quality of life.
*Refer to the colored texts whenever you speak about each LS
What are the consequences of not achieving SSED where economic growth is above the target rate on the Environment?
The environment is likely to be damaged rapidly as resources are depleted and higher rates of pollution occur.
Material Living Standards: access to goods and services may decrease due to unavailability of resources required to produce products.
Non-material Living Standards: air pollution and contaminated waterways may cause adverse health conditions and reduce quality of life.
What are the consequences of not achieving SSED where economic growth is above the target rate on the External Pressures?
External pressures can occur if our inflation rates rise faster than our trading partners.
This means that our exports become more expensive and therefore less attractive decreasing demand for exports and increasing demand for imports (as imports become relatively cheaper compared to locally produced products).
This may lead to a Current Account Deficit which may need to be funded by overseas debt. As these debt obligations increase, Australia’s financial position deteriorates.
Material Living Standards: if demand for exports decrease, less labour is required and average incomes may decrease reducing access to goods and services
Non-material Living Standards: decrease quality of life due to financial stress of becoming unemployed. OR as debt obligations increase, the government spends on interest and loan repayments and may not be able to afford spending on public services such as healthcare hence decreases the quality of life.
What are the consequences of not achieving SSED where economic growth is below the target rate on Unemployment?
Unemployment is likely to be higher as businesses lay off excess workers to protect profit margins.
Material living standards are likely to decrease due to lower average incomes and consequent decrease in access to goods and services and economic well being
Non-material Living Standards are likely to decrease due to financial stress associated with lower average incomes or due to ‘feelings of isolation and loneliness’ if a worker loses their job leading to a lower quality of life.
What is the goal of full Employment?
The goal of full employment is to achieve the lowest rate of unemployment without creating unacceptable inflationary or external pressures (measured by NAIRU to be around 4-4.5%). This is usually considered to be where around 4% natural unemployment exists and where cyclical unemployment is zero.
MEMORISE ABOVE
This means that if unemployment was 4% but inflation was outside of the target range, then technically the goal of full employment is not being achieved currently.
“Lowest rate” —> Means when most people are employed but does not lead to inflation
“Natural unemployment” —> there is always unemployment even when they economy is at its best
How does the government reach full employment (AD factor) template?
State AD factor
How does it affect unemployment and why (eg. less demand for products, less labour needed, producers signal reduce production, derived demand for labour decrease)
Define Full Employment Goal
Does it make it easier or harder to achieve the goal (what type of employment (cyclical) increases, (goal says 0), moving further away from achieving goal, therefore harder for government to achieve the goal) (can change around 3&4 )
Can talk about inflation
Therefore harder/easier for gov. to achieve their goal
How does the government reach full employment (AS factor) template?
State AS factor
favourable/ unfavourable, willingness and ability, productive capacity, economic growth increases
How does it affect labour (eg. increase demand for labour)
Type of unemployment (structural/ natural) and what happens
Need to know current, and say whether it moves closer or further away towards 4 %
Define goal of full emplyment
Therefore harder/easier for gov. to achieve their goal
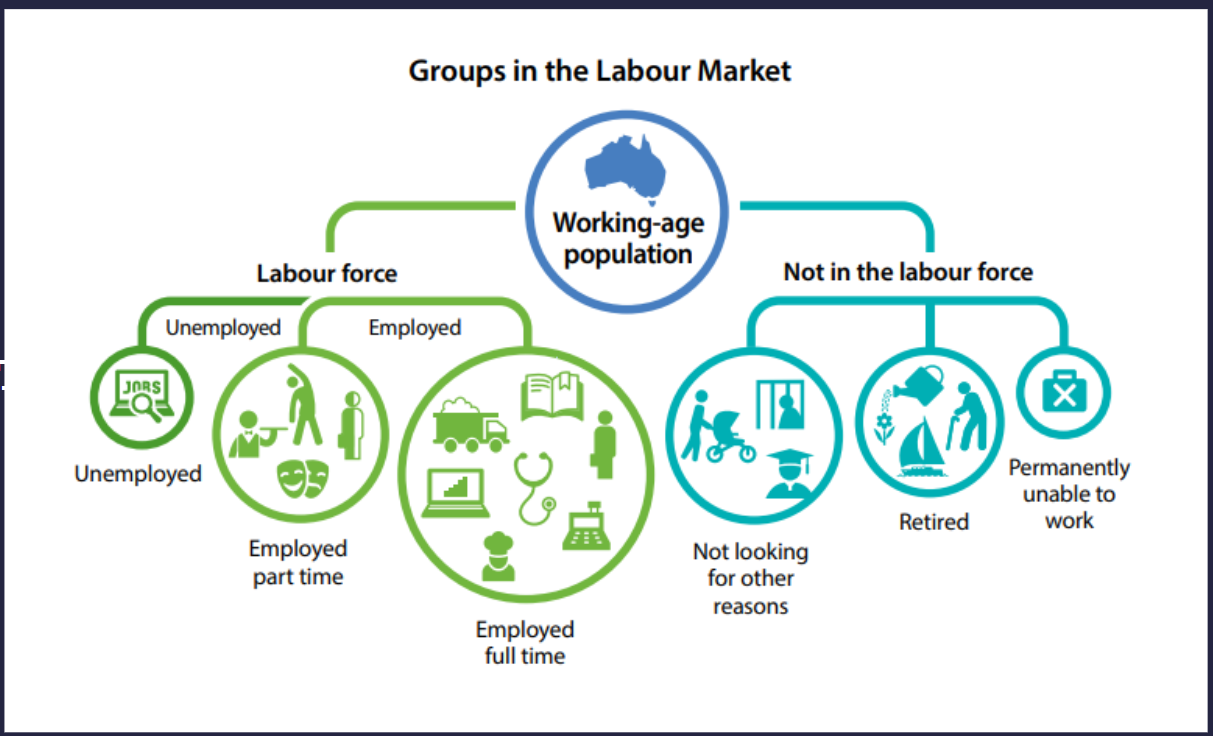
Employed
A person aged 15 or older who worked at least 1 hour in the survey week.
*The survey week refers to these monthly surveys from the ABS that survey the labor force
Unemployed
A person aged 15 or older who is actively seeking employment.
Underemployed
A person who is employed but is working less hours than they’d prefer. (Disguised Unemployment)
aka being underutilized, would be under the PPF
Hidden Unemployment
People who are not counted as employed or unemployed - are not actively looking for work - discouraged job seekers due unfavorable job prospects.
Not counted as part of the labor force
Long-term Unemployed
A situation where someone has been looking for work for 52 weeks or longer.
These are people willing and able to work but can’t find jobs, this is not desirable for the gov
Frictional Unemployment
Occurs when people move between jobs in the labour market, as well as when people transition into and out of the labour force.
Gov doesn’t mind as much
Indicates labor mobility due to demand and other factors
Are unemployed people any worth to society?
Can engage in ‘non-employment’ pursuits such as volunteers who are no less important to the welfare of our country than those statistically employed
Can be a stay at home parent or caring for others will illnesses full time, these people also preform valuable roles in society and neither considered employed nor unemployed
Explain why the existence of ‘discouraged job seekers’ makes ‘unemployment’ statistics misleading.
Discouraged job seekers are individuals who have stopped actively looking for work because they believe no jobs are available for them. Since unemployment statistics only count those actively seeking work, discouraged workers are excluded, making the official unemployment rate appear lower than the true level of joblessness.
What are the different groups in the Labour Market?
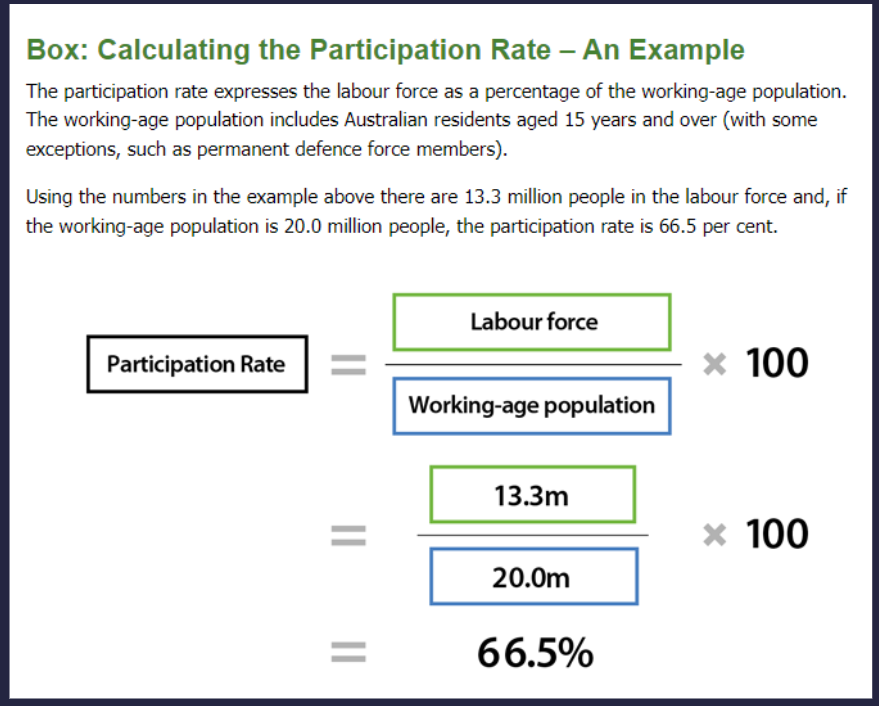
How to calculate the Participation Rate?
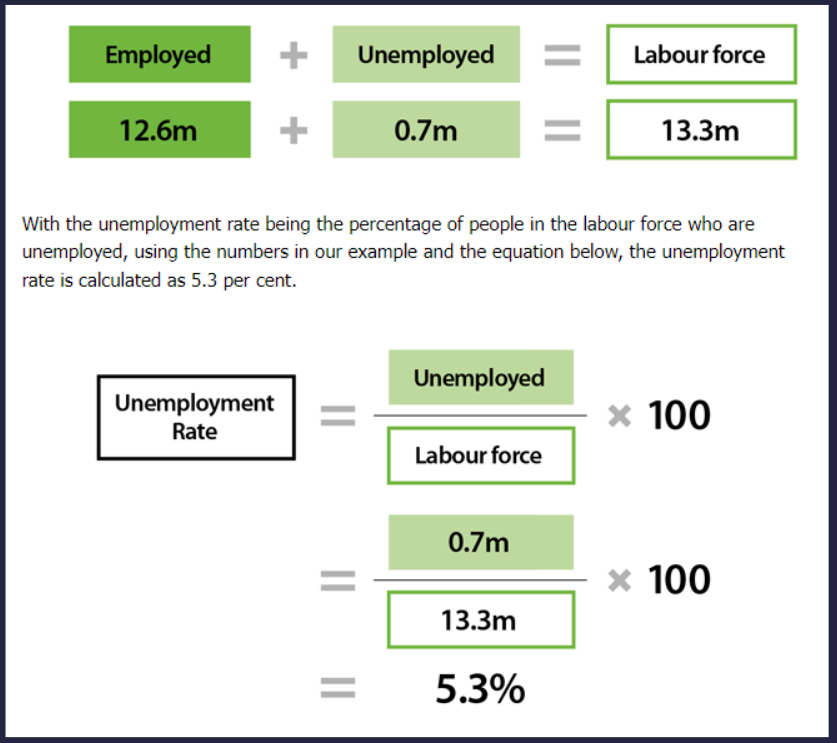
How to calculate the Unemployment Rate?
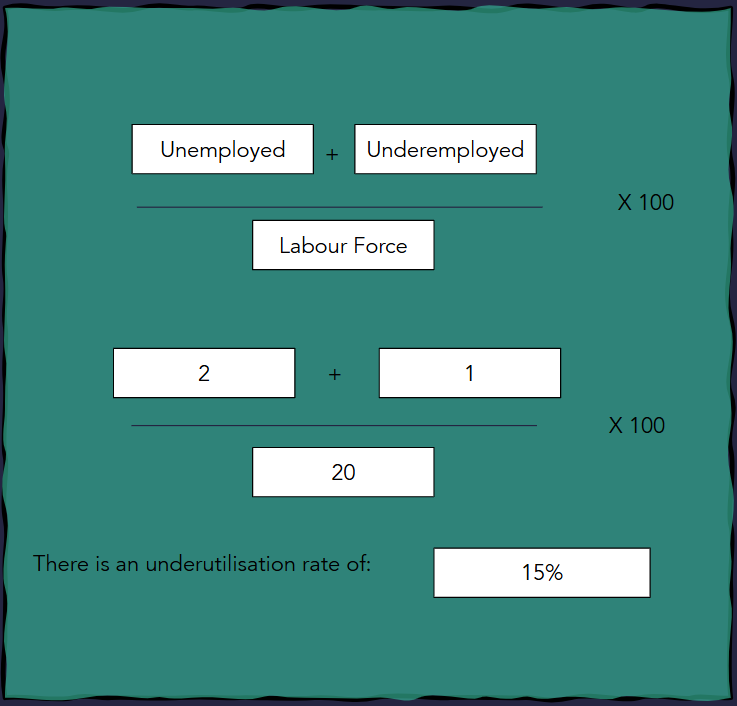
How to calculate the Underutilization Rate?
For example in an economy where 18 persons were employed, 2 were unemployed and 1 was underemployed.
When you count up the Labour force, the employed people includes the underemployed people, therefore do not double count the no. of underemployed poeple.
What is Cyclical unemployment (Demand driven)?
Refers to unemployment which is caused by short term fluctuations in the market caused by demand side conditions that impact AD and therefore derived demand for labour.
If aggregate demand is rising (e.g. due to discretionary incomes increasing):
This sends a signal to businesses to increase total production.
To increase production businesses are likely to require more labour which increases the derived demand for labour and therefore decreases cyclical unemployment
If aggregate demand is falling (e.g. due to interest rates increasing):
This sends a signal to businesses to slow production to prevent overproduction, this also means they can reduce their need for labour and therefore lay off workers. Increasing cyclical unemployment.
What is Structural Unemployment (Supply driven)?
Is due to longer term supply side factors where there is a restructure of the market and impacts the sustainable rate of economic growth.
It occurs when the skills of the workforce do not match what industry required, therefore some people are unable to find a job.
This can be due to cost cutting or productivity increasing by offshoring (moving operation overseas so labor is cheaper) or replacing labor with technology or business closures
*Gov may intervene by providing workforce with education
What are the different types of unemployment?
Structural unemployment – where the skills of the unemployed do not match the skills required by industry (i.e. the skills required for the jobs that are available).
Seasonal unemployment – where a person is unemployed because their skills are only demanded during certain times of the year. The most common examples are fruit pickers and ski resort workers.
Frictional unemployment - where a person is unemployed for a period of time while they are moving from one job to another.
Hard core unemployment - where a person is unemployed due to mental, physical or other characteristics that prevent them from receiving a job offer.
What are the goals of Full Employment?
Sustained full employment: ensuring that employment is as close as possible to the current maximum sustainable level of employment that is consistent with low and stable inflation.
Inclusive full employment: broadening labour market opportunities, by lowering barriers to work, and reducing structural underutilisation to increase the level of employment that can be sustained in our economy over time.
What is NAIRU
The lowest unemployment rate possible without causing unacceptable inflationary pressure in the economy. This is sometimes referred to as the Non Accelerating Inflation Rate of Unemployment (NAIRU).
Where there is no cyclical unemployment and about 4% natural
It is around 4-4.5%
What factors in the economy may contribute to a lower estimate for NAIRU?
Increasing labour market flexibility
Growth in casual/part-time work (due in part to growth in the gig economy)
Rising underemployment
The reduced bargaining power of workers
Greater competitive pressures in product and labour markets
In the presence of these influences, the unemployment rate in the economy has been able to fall before labour market tightness sets in and upward pressure is exerted on wages. In other words, spare capacity in labour markets (or excess supply of labour) now exists at lower rates of unemployment.
Define the underutilisation rate and explain the difference between underemployed and underutilised labour?
Define + state necessary calc
Underemployed labour refers to individuals who are employed but working fewer hours than they would prefer
Underutilised labour is a broader concept that includes not only the underemployed but also unemployed individuals who are actively seeking work
While underemployment reflects insufficient use of labour among the employed, underutilisation captures the total unused or underused capacity in the labour market
Casualisation of the work force
An increase in the amount of casual workers (inconsistent hours every week)