PBSI STATS 301 EXAM 1
 Call Kai
 Learn
Learn Practice Test
 Spaced Repetition
 Match
Match Flashcards
 Knowt Play
1/74

There's no tags or description
Looks like no tags are added yet.
Name | Mastery | Learn | Test | Matching | Spaced | Call with Kai | Chat |
|---|
No analytics yet
Send a link to your students to track their progress
75 Terms
3 goals on science
Description, prediction, explanation
Descriptive Statistics
used to organize/describe data
Inferential Statistics
used to make inferences about a larger group from a smaller group
Sample
group we’re getting data from
Population
group we want to draw conclusions about
Variable
smth that changed/varies for diff. individuals
Data
Info we collect from sample on variables we’re interested in
Continuous Data
data measured on a continuum Ex:) age, iq
Categorical Data
data that sorts people into a category Ex:) college major, eye color
3 measures of central tendency:
mean, median, mode
Mean
Average, sensitive to outliers, most common central tendency measure

Median
midpoint of scores, point where half scores are higher and half are lower, rearrange #’s lowest to highest and find middle, better represents central tendency
Mode
value that occurs most often in data set, most used in categorical data
Variability
tells us how different scores are from each other, helps us understand nature of samply
3 ways to calculate variability:
range, standard deviation, variance
Range
how far apart lowest score is from highest, r=h-l, ignores middle values and only considers extreme scores
Standard Deviation
most common, represents how far away scores are from mean,

Outlier cutoff
2 SD or more
Windsorizing
replacing extreme scores w next highest score + 1
Transformations
mathematical constant applied to all data to pull in ends of distribution
How to find outlier:

Variance
(standard deviation)²
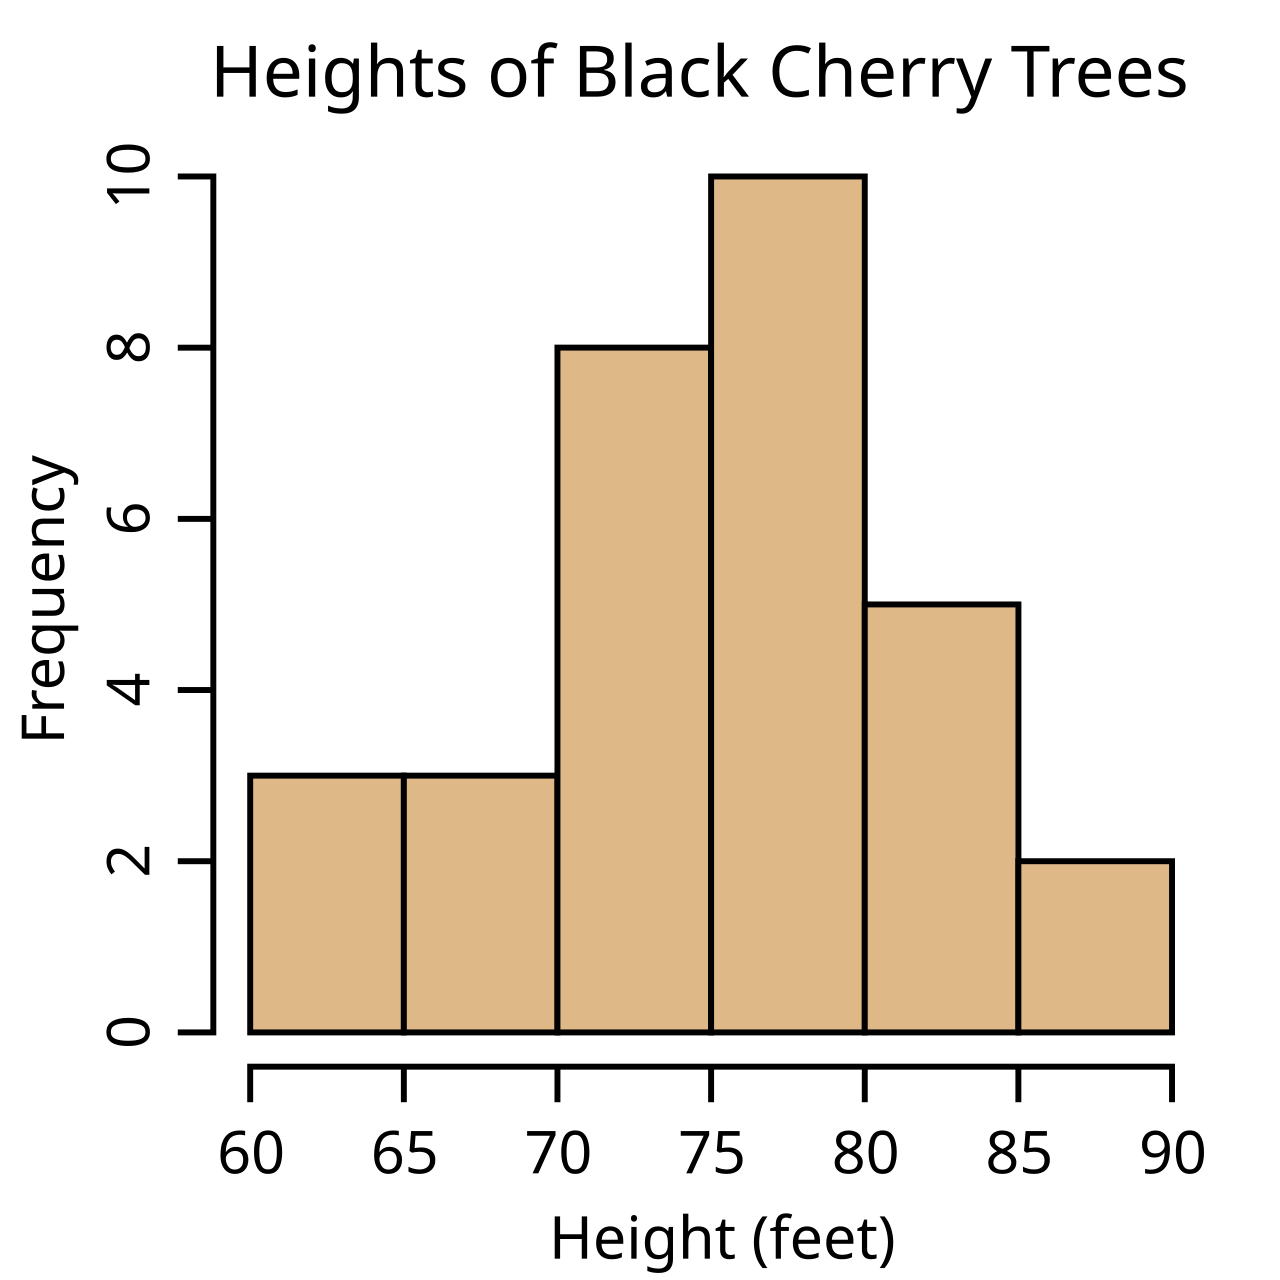
Histogram
represents continuous data
Bar Graph
categorical data

Skewness
lack of symmetry, positive skew= tail to the right, negative skew= tail to the left

Kurtosis
how peaked/flat a distribution is
Platykurtic
LOW kurtosis, flat, platy=playtpus=flat
Journal Article Sections
Introduction, method, results, discussion
Misleading graphs
Scaling Y-axis

Correlation
How do changes in one variable relate to another change?
Scatter plot
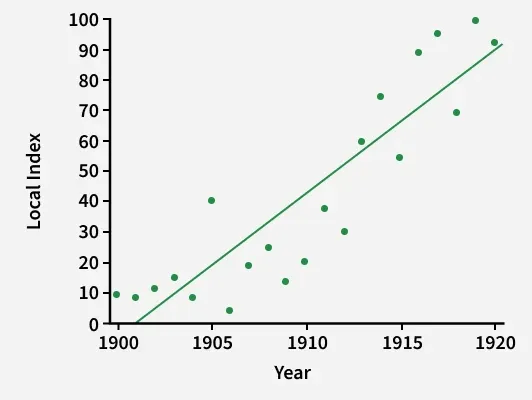
Direction of correlation
Positive=variables moving in same direction, Negative=opposite
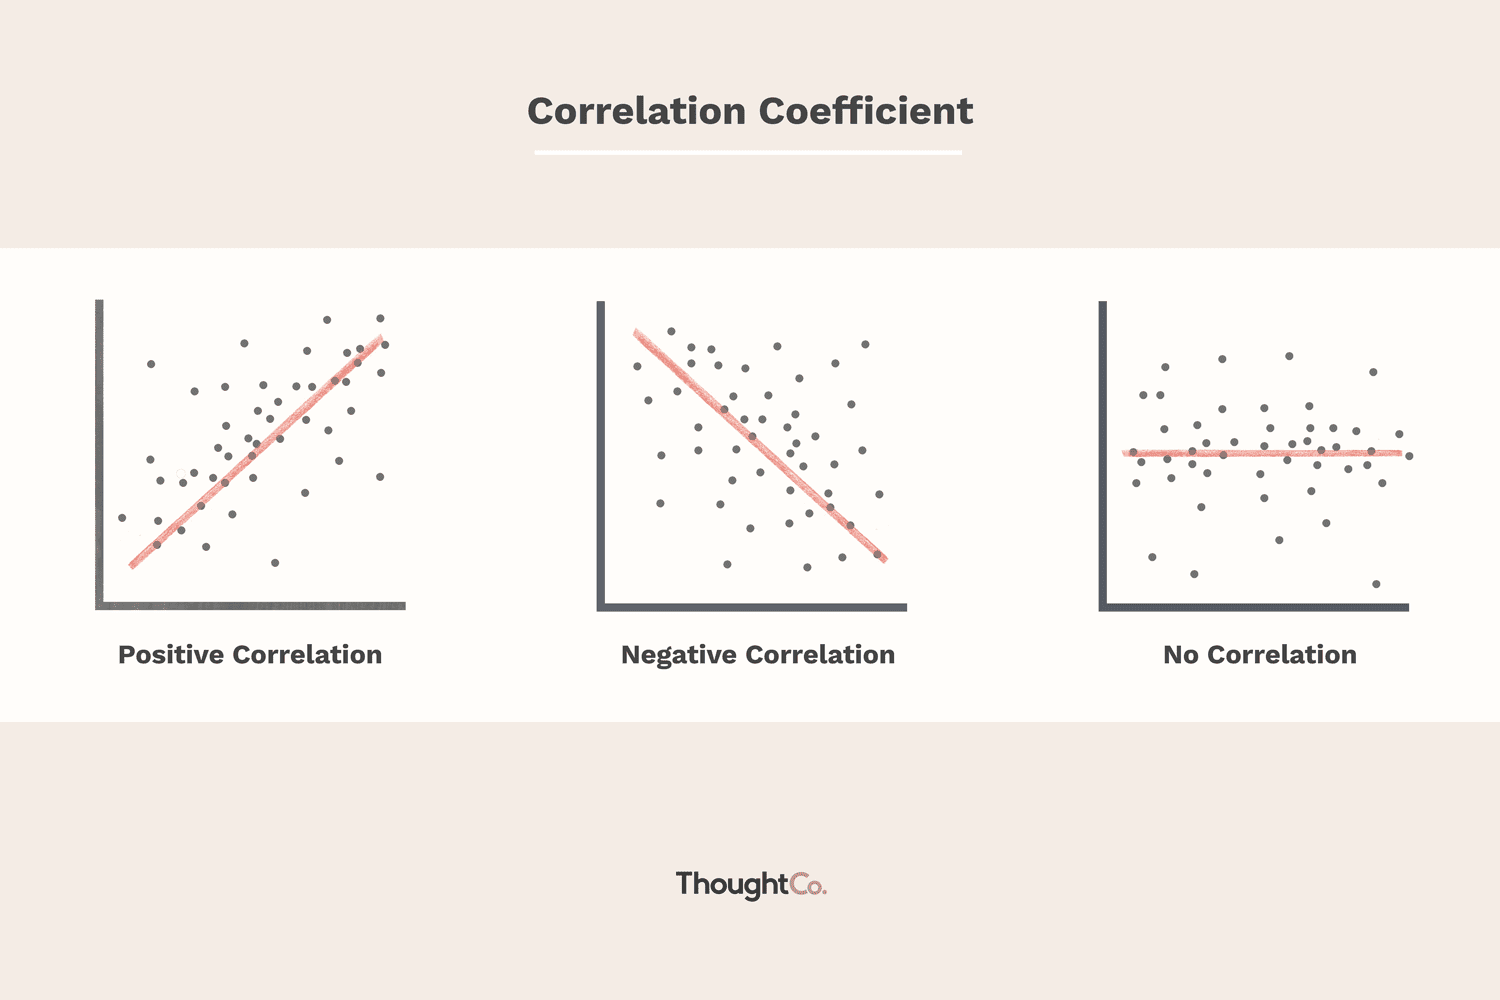
Strength of correlation
Magnitude of coefficient, r=0=none, r=-1 or 1=perfect, closer to 1= more strong

Limitations of correlation coefficient
Only detects linear relationships, restriction of range, outliers
Correlation coefficient formula
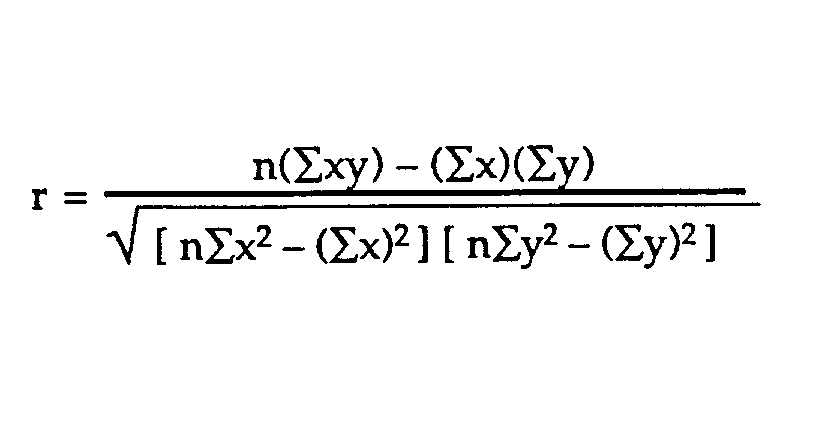
Reporting a correlation:
What we’re reporting ,actual result, conclusion
Coefficient of Determination
r², how much two variables have in common
Coefficient of Alienation
Remaining variance after determination
Measurement
Act of assigning numbers to phenomena according to a rule
Ex:) inches, pounds, GPA
Independent Variable
Creates conditions in experiment, we can change these
ex:) low dose, high dose, no dose
Dependent Variable
Outcome we are investigating
ex:) no change, high change, low change
Nominal Scale
Splits ppl into categories, must be mutually exclusive, nominal = nameable
Ex:) hair color, major, political party
Ordinal Scale
Number is a ranking, ordinal=ordering, not clear how much “distance” separates points on scale- how far is A-tier from S-tier?
Ex:) rank, tier lists
Interval Scale
Ordered events w equal spacing, most commonly used in psychological research, 0 has no meaning
Ex:) IQ test
Ratio Scale
Similar to interval, but 0 has meaning, uncommon (most precise)
Reliability
Consistency or reproducibility of measure/method
Validity
Accuracy of a measure
Observed score
actual number/value on a test
True Score
Exact score w zero error
Error Score
Discrepancy between true + observed score
Ex:) test anxiety, distractions, tired
Test-retest reliability
correlation between 2 assessments
Inter-Item Reliability
How similar are a person’s answers to different items meant to measure the same thing?
Cronbach’s Alpha, 0-1, closer to 1= better
Inter-Rater reliability
Observations made by 2 ppl
3 Types of Validity:
Content, Criterion, Construct
Content
Does the measure sample the entire universe of items that could be used to assess the construct
Criterion
Does our measure reflect/relate to outcomes it “should” w right now or in the future?
Concurrent Validity
Correlation right now
Predictive Validity
Predict outcomes in the future
Construct
Is the measure related other constructs it should be related or and not to ones it shouldn’t?
Convergent Validity
Is measure related to things it should
ex:) self esteem + depression
Discriminant Validity
Is measure NOT related to things it shouldn’t
ex:) self esteem + political party