Histograms and Distributions
 Call Kai
 Learn
Learn Practice Test
 Spaced Repetition
 Match
Match Flashcards
 Knowt Play
1/17

There's no tags or description
Looks like no tags are added yet.
Name | Mastery | Learn | Test | Matching | Spaced | Call with Kai | Chat |
|---|
No analytics yet
Send a link to your students to track their progress
18 Terms
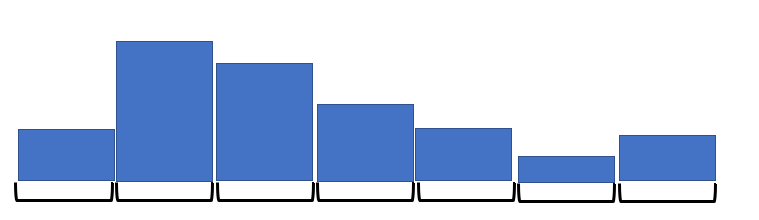
Historgram
A type of chart used to show the “shape” of data distribution
X-axis
the horizontal line on the chart that shows the variable or thing you are measuring
Y-axis
The vertical line on the chart that shows the number of occurrences (how often something happened)
Data Range
The distance between the highest and lowest points in your data (Maximum - Minimum)
Bin Width
The width of the bars on the histogram, calculated by dividing the Data Range by the number of bins (bars) you want. (7)
Normal Distribution Curve
A specific bell-shaped curve that represents a balanced set of data
Kurtosis
A measure used to describe the steepness of the number of outliers (data points far from the average) in a distribution
Mesokurtic
A distribution with a Kurtosis of 3, which is considered a normal distribution
Platykurtic
A distribution with a Kurtosis less than 3, meaning it has fewer outlier and looks flatter
Leptokurtic
A distribution with a Kurtosis greater than 3, meaning it has more outliers and a shaper peak
Skewed
A distribution that is not symmetrical and leans to one side
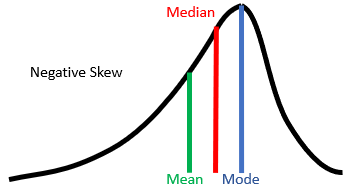
Negative Skew
When the “tail” of the data points toward the lower numbers (left). In the shape, the mean and median are typically smaller than the mode
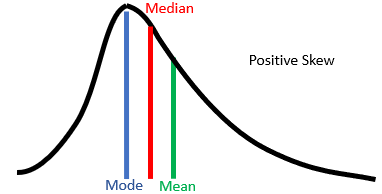
Positive Skew
When the “tail” of the data points toward the higher number (right). In this shape, the mean is typically larger than the median, which is larger than the mode
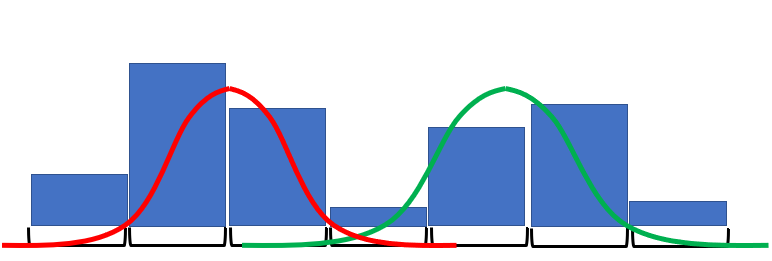
Bimodal
A distribution that has two distinct peaks (two “modes”) instead of one. Most frequently caused by two different populations.
Heart Cut
A specific pattern where data has been removed from the center or “heart” of the distribution. Frequently caused by filtering
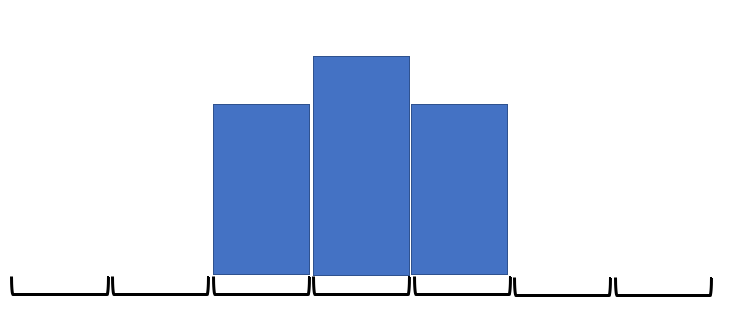
Dog Bowl/Dog Food
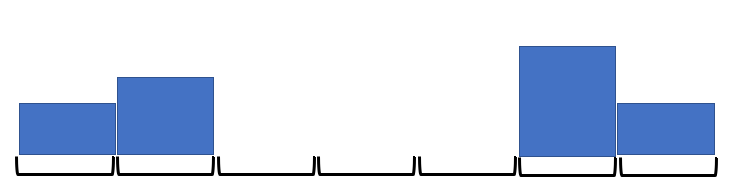
A U-shaped distribution that looks like a bowl, with peaks at the edges and a dip in the middle. Frequently caused by filtering where the low and high ends are only present
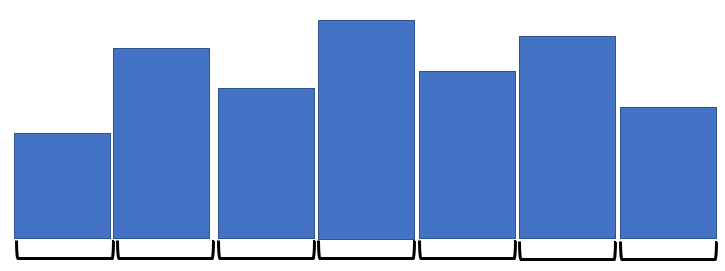
Comb
A distribution that looks like a comb, with altering high and low bars. An issue with data collection, rounding, or building of the graph. Solution to fix issues is to change bins
Edge Peak
A distribution where there is a large, unexpected peak at one of the very ends of the chart. Outliers