Laboratory Quality Control & Assurance
1/80
Earn XP
Description and Tags
Vocabulary flashcards covering key concepts in laboratory quality control, QC statistics, error types, and QC tools from the lecture notes.
Name | Mastery | Learn | Test | Matching | Spaced |
|---|
No study sessions yet.
81 Terms
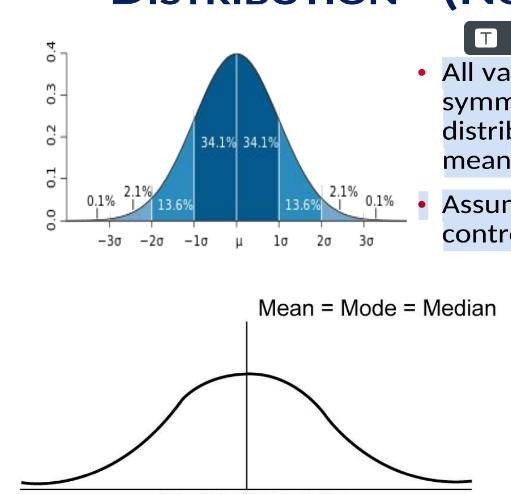
Gaussian distribution (Normal distribution)
A symmetric, bell-shaped distribution centered at the mean; in QC, many statistics assume data are normally distributed; mean = median = mode.
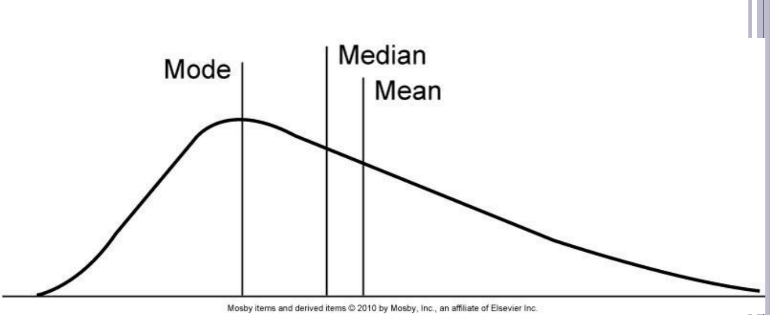
Non-normal distribution
A distribution that is not symmetric around the mean; may have skewness and different relationships between mean, median, and mode.
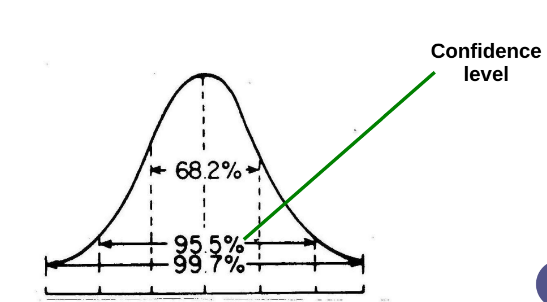
Confidence interval
The limits between which we expect a specified proportion of a population to lie
What is the confidence level in the clinical world?
95.5-99.7%
Confidence level
The probability that the interval contains the true value, e.g., 68.2%, 95.5%, or 99.7% for standard normal distributions.
Percent coefficient of variation (%CV)
Standard deviation expressed as a percentage of the mean; used to compare variation across data sets with different means.

What happens to the variation when there is a higher Percent coefficient of variation (%CV)
more variation
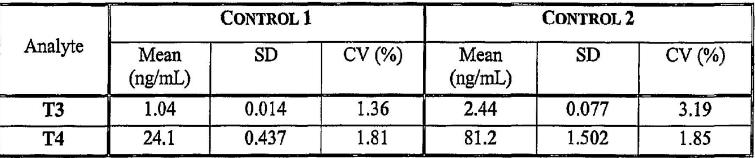
Explain this chart and its significance in quality control
In Control 2, the T3 measurements show greater process variation than Control 1, as indicated by the higher coefficient of variation. This suggests lower precision and potentially lower confidence in the consistency of T3 results for Control 2.
Prevalence
positive predictive value vs. negative predictive value based on population
Analytical sensitivity
The ability of a laboratory test to detect the target analyte, related to the limit of detection (LOD).
Analytical specificity
The ability of a test to detect only the intended analyte, minimizing cross-reactivity.
Limit of Detection (LOD)
The lowest quantity of an analyte that can be reliably detected by a method.
How does Limit of Detection (LOD) pertain to Beer’s Law?
refers to the minimum or maximum concentration of an analyte that can be accurately measured while still adhering to the linearity and absorbance characteristics described by Beer's Law.
True Positive (TP)
Diseased individuals correctly identified as positive by the test.
HIV has _____ sensitivity and _____ specificity in tests.
high, high

False Negative (FN)
Diseased individuals incorrectly identified as negative by the test.
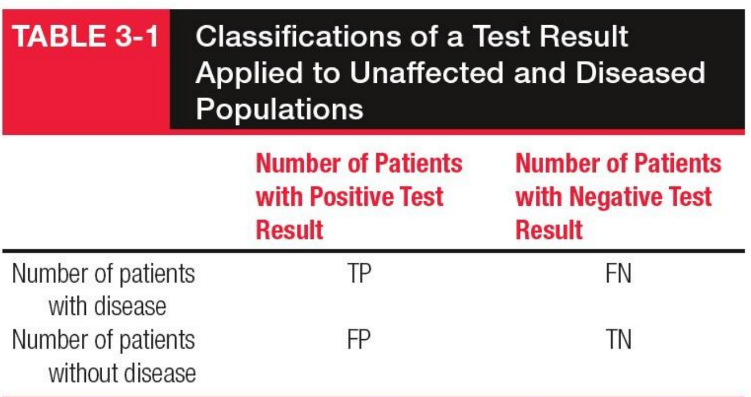
False Positive (FP)
Non-diseased individuals incorrectly identified as positive by the test.

True Negative (TN)
Non-diseased individuals correctly identified as negative by the test.
Clinical Sensitivity
The ability of a test to correctly identify individuals with the disease, reflecting the proportion of true positive results.
Formula for Clinical Sensitivity
Clinical Sensitivity = True Positives / (True Positives + False Negatives)
Better clinical sensitivity =
fewer false negatives
Clinical Specificity
The ability of a test to correctly identify individuals without the disease, reflecting the proportion of true negative results.
Higher clinical specificity =
fewer false positives
Formula for Clinical Specificity
Clinical Specificity = True Negatives / (True Negatives + False Positives)
False Positives Consequences
Psycological and Physical Stress
Unnecessary Treatment
Legal Action (illegal drug use)
Examples: Mammograms & Lung Cancer CT scans
False Negatives Consequences
Delay Treatment
STs
Worsening Disease
Why does HIV Screening Test has high sensitivity?
no false negatives
Why does a Western Blot that confirms an HIV Screening Result have high sensitivity?
no false positives
What happens when you increase a test value from 0.04 to 0.06 in this graph?
It likely increases the number of false negatives, which more individuals with the disease may go undetected by the test.
True positives (TP) may decrease
False negatives (FN) will increase
False positives (FP) will decrease
True negatives (TN) may increase

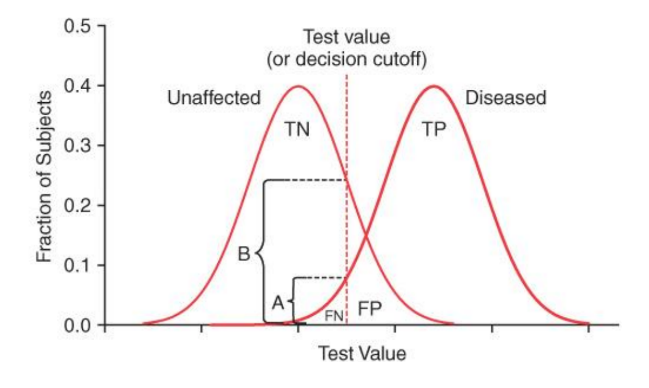
What happens when you decrease a test value to 0.03 from 0.04 in this graph?
It likely decreases the number of false negatives, resulting in more individuals with the disease being detected by the test. This may lead to an increase in true positives, while false positives might increase.
True positives (TP) may increase
False negatives (FN) will decrease
False positives (FP) will increase
True negatives (TN) may decrease

When you decrease a test value to 0.03 from 0.04 in this graph, it would ______ specificity, but ______ sensitivity.
decrease, increase
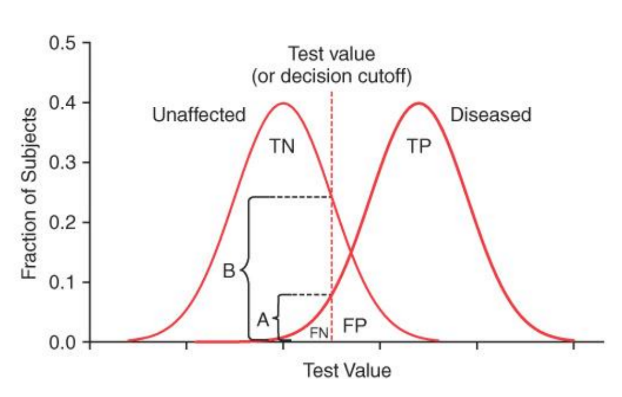
When you increase a test value from 0.04 to 0.06 in this graph, it would ______ specificity, but ______ sensitivity.
increase, decrease
Accuracy
Agreement between the measured value and the true value; overall correctness of a test.
Precision
Reproducibility of results; the spread of repeated measurements (smaller SD = better precision).
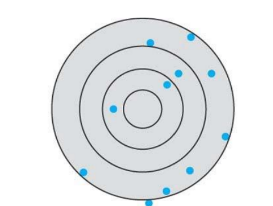
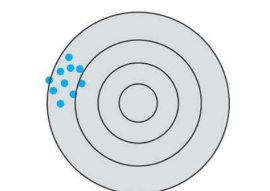
What kind of accuracy and precision is this in this systematic error?
low accuracy, low precision
What kind of accuracy and precision is this in this systematic error?
low accuracy, high precision
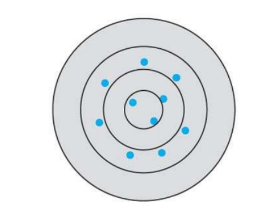
What kind of accuracy and precision is this in this systematic error?
high accuracy, low precision
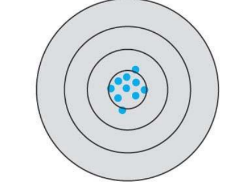
What kind of accuracy and precision is this in this systematic error?
high accuracy, high precision
Bias
Systematic difference between the measured value and the true value; a consistent offset from the true value; the amount by which an analysis varies from the correct result.
Random analytical error
Unpredictable variation causing scatter around the mean; due to random fluctuations in measurement.
Systematic analytical error
Consistent and predictable, time-dependent shift in measurements (calibration drift or consistent bias).
-constant
-proportional
Pre-analytical error
Errors that occur before analysis, e.g., test ordering, patient identification, specimen collection/transport.
Examples of Preanalytical Error
test order entry,
request completion,
patient identification,
specimen collection,
specimen transport,
specimen separation and
distribution into aliquots
What kind of error in clinical labs do most errors occur?
Pre-analytical error
Causes of Random Analytical Error
Air bubbles in reagent
Improperly mixed (dissolved) reagents
Improperly fitting pipette tips
Clogged or imprecise pipette
What causes systematic analytical error?
Caused frequently by a time-dependent change (in instrument calibration) that causes thecalibration curve to shift (the mean shifts)
Change in reagent or calibrator lot
numbers
Improper allocation of substance used
to calibrate (wrong amount, isotype
etc.)
Interfering substance
Deterioration of reagents or calibrators
Deterioration of photometric light
source
Inadequate sample blanks
Erroneous set point for cutoff value
Analytical error
associated with the performance of the
method/instrumen
Post-analytical error
Errors after analysis, such as transcription mistakes, wrong units or values, or delayed or missed reporting.
Calibration
Process of setting instrument response using standards to ensure accurate measurements.
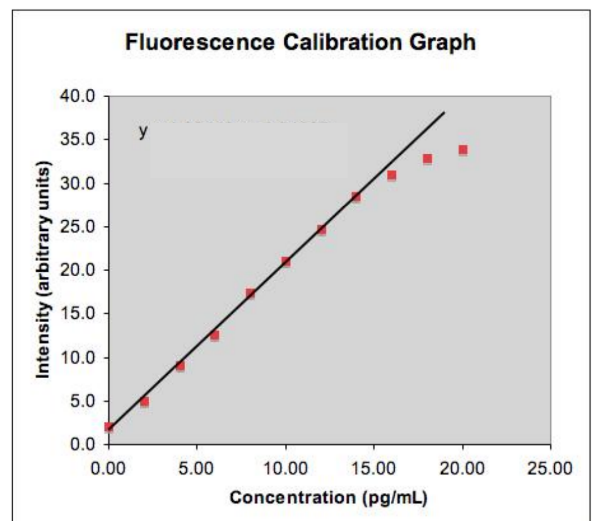
Linearity
Proportional relationship between measured and expected values across the analytical measurements’ range.
Analytical range of Method
Lowest to highest test results that can be reliably reported by a method.
Analytical validation
Process to verify that a method performs as intended, including linearity and range assessment.
Control material
Material used to monitor analytical performance; run in batch to establish a reference or QC range.
Analyte standard
known concentration for calibration
Analyte Control
run it and concentration is plotted on a chart
Known: whether it is a normal or abnormal
control
Unknown---if it will be correctly
identified as so
Delta checks
A patient result is compared to a previously determined value on the patient
In healthy or stable patients the difference between any two results of the same analyte should be small.
May be reported as absolute number or % change between values….regardless SMALL
Which of the following methods is most useful to detect sample misidentification ?
Delta checks
Levey-Jennings chart
A control material chart plotting QC results over time with mean and ±1–3 SD limits to assess process stability.
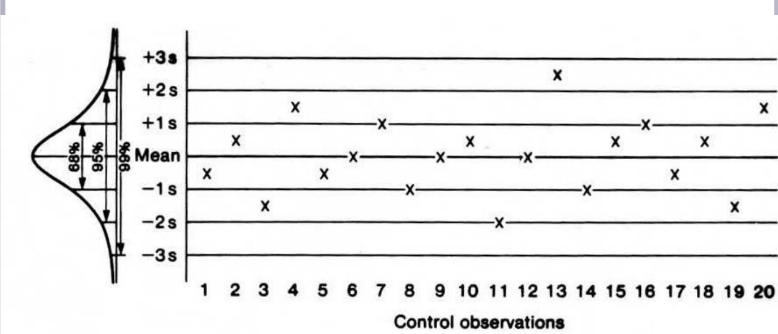
What is this Levey Jennings Chart portraying for the test?
The test is working well
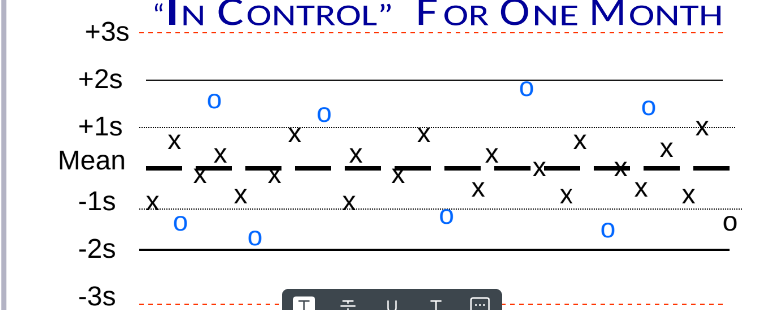
How is a Levey-Jenning Chart shown in control for one month?
It displays the QC results (8-9 points) plotted against the mean and control limits, showing all results within ±2 SD limits throughout the month.
How is a Levey-Jenning Chart shown a shift for one month?
An abrupt change in the pattern of data points on a plot, graph, or chart of data points
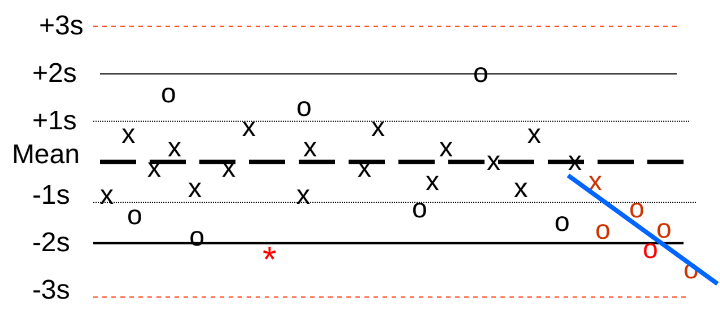
How is a Levey-Jenning Chart shown a trend for one month?
A gradual change in the pattern of data points on a plot, graph, or chart of data points.
Does a shift in the Levey-Jenning chart need attention?
Yes, there may be a systematic error in the testing process that requires investigation and corrective action.
Does a trend in Levey-Jenning chart need attention?
Yes, there may be a gradual change in the testing process, indicating potential issues that should be monitored and addressed.
Westgard rules
A set of QC decision rules using 2 controls to determine if a run is acceptable or out of control.
When both control observations (high and low) fall within the 2 s limits, the analytical run is _____ and patient results are _____
acceptable; reliable
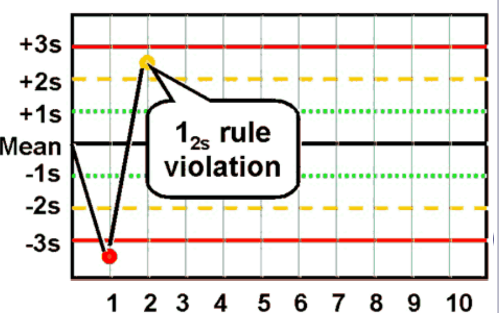
12s rule
A warning rule: one control exceeding mean ± 2 SD.
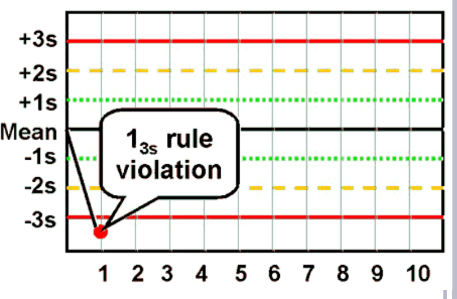
13S rule
A rejection rule: one control exceeding mean ± 3 SD; caused by random error.
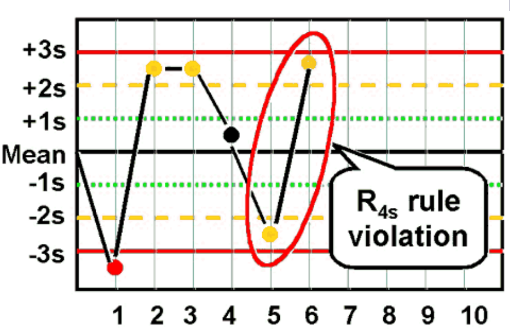
R4S rule
reject when One control above +2 SD and another below −2 SD; it is sensitive to random error within a run.
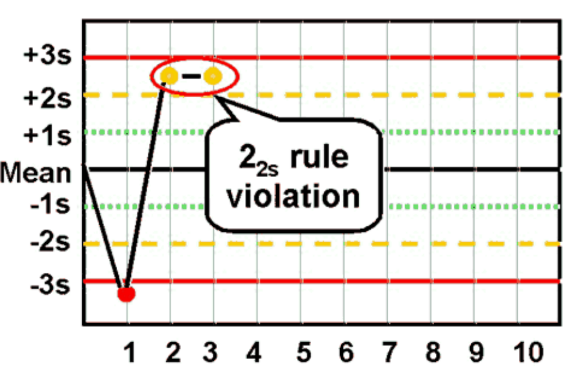
22S rule
Reject when Two consecutive control results exceeding the same mean ± 2 SD; it is sensitive to random error
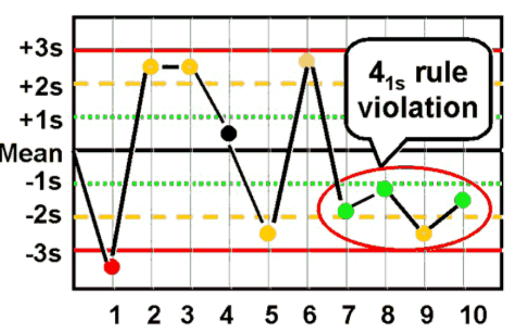
41S rule
reject when Four consecutive control results outside mean ± 1 SD on the same side; detects systematic error.
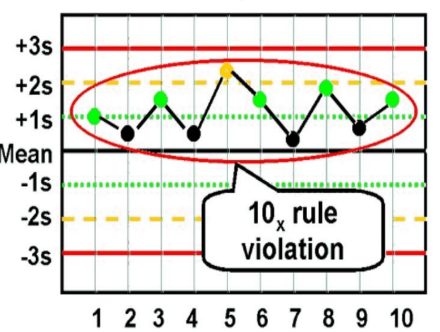
10× rule
Reject when Ten consecutive control results on one side of the mean; indicates systematic error.
In-control
QC data indicate the process is stable; no rule violations; patient results may be reported.
When will the detector be flagged for the amount of consecutive points fall onto one side of the mean, above or below?
The detector will be flagged when either the 41S rule or the 10× rule is violated, indicating potential systematic error in the control results.
Out-of-control
QC results violate Westgard or other rules; run is rejected and corrective action required.
Reference ranges
Clinical values considered normal for a healthy population; used to interpret patient results. Gender, age, sex plays a role in these ranges.
Cut-off value
A threshold used to decide positive vs. negative results or abnormal vs. normal.
Preanalytical, Analytical, Post-analytical error (labels)
Three stages in lab testing where errors can occur: before analysis, during analysis, and after analysis.
Types of QC
Internal and External
Internal QC
Daily runs
Establishment of reference ranges
Validation of a new reagent lot and/or
shipment
Following instrument repair message
External QC
Determination of laboratory testing performance via intra
laboratory comparisons
CAP, CLIA, The Joint Commission requirement
Ongoing evaluation of results to correct for unacceptable results
Used to access employee competency