brand perceptual map
1/17
There's no tags or description
Looks like no tags are added yet.
Name | Mastery | Learn | Test | Matching | Spaced | Call with Kai |
|---|
No study sessions yet.
18 Terms
graphical mapping
a solution to the data clutter
principal component analysis (PCA)
A mathematical transformation to convert a set of high-dimensional data (possibly correlated variables) into a set of linearly uncorrelated principal components
principal component analysis objective
PCA reduces larger number of variables to a smaller number of dimensions (dimension
reduction). So, there is no guarantee that the dimensions are interpretable in case of PCA
unsupervised learning method pca
looks into the greatest sources of variation of data
pca forms
orthogonal linear combinations of the original predictors such that
the first component accounts from the largest variance in the data;
the second component accounts for the second largest variance in the data
can be done by matrix decomposition of a data covariance (correlation) matrix
can identify these with eigenvalues and eigenvectors of the covariance matrix
assessing competition
firms should assess competitors with respect to objective attributes, as well as subjective perceptions from the voice/minds of consumers
firms should monitor
share of market(objective) competitor’s market share - sales data
top of mind awareness (subjective): “name the first company that comes to mind in this industry"
share of mind (subjective)- “name the company from whom you would prefer to buy the product
typical data sets
competitor x attribute matrix
customers comparative ratings in attributes across competitors

perceptual map is a
visual representation of how target customers view the competing alternatives in a Euclidean space
perceptual map characteristics
• The pair-wise distances between product alternatives directly indicate how close or far apart the products are in the minds of customers
• The axes of the map are a special set of vectors suggesting the underlying dimensions
(e.g., Principal Component1 or 2) that best characterize how customers differentiate between alternatives
car example perceptual map
From this perceptual map: 1. we can see how each car brand is
comparatively positioned in peoples’ mind.
2. This is helpful for developing marketing strategy for differentiating
from other competing car brands

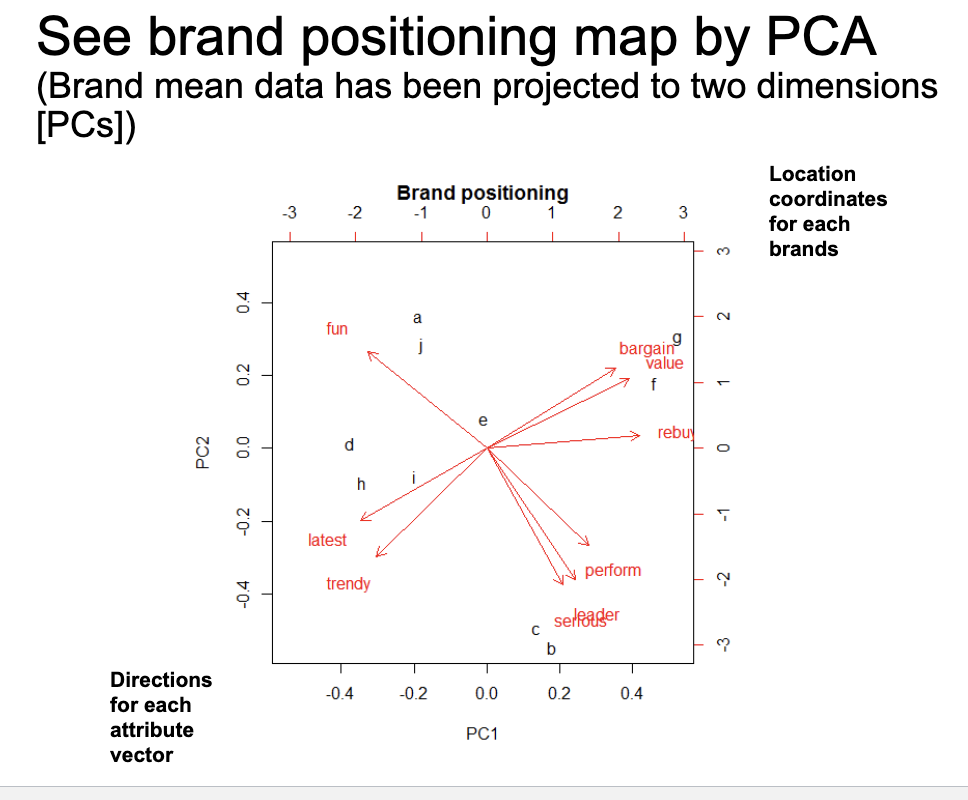
brand positioning map PCA
location coordinates for each brands
directions for each attribute vector
differentation
the creation of tangible or intangible differences on one or two key dimensions between a focal product and its main competitors
positioning
the set of strategies that firms develop and implement to ensure that the differences occupy a distinct an important position in the minds of consumers
good position strategy requires
An understanding of the dimensions along which the consumer perceives the product
identifying the brand position compared with other competitors brands
Considering a firm’s strengths and available resources, the firm can find the optimal positioning location and develop corresponding strategy.
knowing how competitors brands are perceived on these dimensions
multidimensional scaling mds
refers to class of mathematical procedures (algorithm) for representing perceptions and preferences of respondents spatially (i.e., in two-dimensional map).
• This is basically projecting high dimensional data to two dimensional space using “distances” between observations – identifying coordinates in 2-dimensional space...
• Note, we are interested in “Perceptual” and not necessarily Engineering attributes – focusing consumer’s perceptions..
• Data type examples:
Similarity
Attributes
data types/collection for MDS
can collect primary or secondary sources
1 .Collect pairwise (dis)similarities of competitive brands in a designated product
class from consumers.
2. Collect ratings for perceptions or beliefs of how much each brand has of
specific attributes from consumers – then we can compute distances.
3. Record objective attribute information from secondary sources (e.g., package
labels).
Then, construct brand maps via Multidimensional Scaling (MDS)
description of mds
• Input matrix of dissimilarities (e.g., distance) between pairs of items and outputs a coordinate matrix
• Computing distances between brands
• Searching coordinates in 2 dimensional-map to minimize gap/differences between observed distances and estimated distances in MDS space