12ECO EA
 Call Kai
 Learn
Learn Practice Test
 Spaced Repetition
 Match
Match Flashcards
 Knowt Play
1/72

Earn XP
Description and Tags
Topic 1 and 3 + assumed knowledge
Name | Mastery | Learn | Test | Matching | Spaced | Call with Kai | Chat |
|---|
No analytics yet
Send a link to your students to track their progress
73 Terms
Six goals of the government and RBA
OVERARCHING: Sustainable economic growth
Steady rise in real GDP that the economy can maintain over time
Macroeconomic objective 1: full employment
Everyone willing and able to work can find a job (low cyclical unemployment)
Macroeconomic objective 2: Price stability
Low, stable inflation that keeps money's purchasing power
Macroeconomic objective 3: external stability
A sustainable current account, foreign debt, and exchange rate
Macroeconomic objective 4: Sustainable development
Growth today that doesn't degrade the environment for the future
Macroeconomic objective 5: improved SOL
Higher real incomes plus better health, education and wellbeing
How we measure whether objectives are met
Objective | Target/benchmark | Key indicator | Latest (AU) |
Economic growth | 3-4% real GDP p.a. | Real GDP growth | 2.5% p.a. |
Full employment | 4-5% (NAIRU) | Unemployment rate | 4.5% |
Price stability | 2-3% inflation (RBA) | CPI/Inflation rate | 4.2% |
External stability | Sustainable CAD and debt | Current account, %GDP | Net foreign liabilities 24.5% |
Living standards | Rising real income | Real GDP per capita | +1.0% through the year |
Trade-off of Growth vs inflation
Strong AD lifts output and jobs
Near full capacity, demand-pull inflation rises
Fash growth strains price stability
If the economy is growing too fast, AD can increase faster than the economy's ability to produce goods and services and when demand exceeds supply, businesses may rise prices leading to inflation
Trade-off for unemployment vs price stability
Short-run Phillip’s curve: Lower unemployment causes inflation to rise because people have more income and therefore spending increases
Stimulating AD through the gov or RBA reduces unemployment (employment increases) but increases inflation
Long-run: no stable or permeant trade-off between inflation and unemployment due to the NAIRU -> This means that there is a level of unemployment that the economy naturally settles around
Trade-off for external stability vs domestic growth
Rising incomes pull in more imports -> if people earn more money some of that spending will likely be on imported goods and services
Current account deficit (CAD) widens -> occurs when the value of imports is greater than the value of exports and reduces external stability
Balance-of-payments constraint on growth -> a country can't increase imports if it is not earning enough from exports otherwise foreign debt may increase etc.
Therefore, strong economic growth increases incomes and spending, however, if that spending is on imported goods and services, the CAD can widen, reducing Aus' external stability, creating ad trade-off between domestic growth and a sustainable BoP
Unemployment and infaltion trade-off graph
If you want lower unemployment in the short run, you have to accept higher inflation
*IMPORTANT NOTE:
Unemployment increases ⟶ more people are without jobs
Unemployment decreases ⟶ more people are employed
READ THIS GRAPH RIGHT TO LEFT - as unemployment decreases (employment increases), inflation increases and visa versa; if unemployment increases (more people without a job) then inflation decreases

Calculating the inflation rate
Inflation rate = (new CPI - Old CPI) x 100
old CPI
Calculating the unemployment rate
Unemployment rate = unemployed x 100
labour force
Calculating CPI
CPI = cost of basket x 100
base-year basket
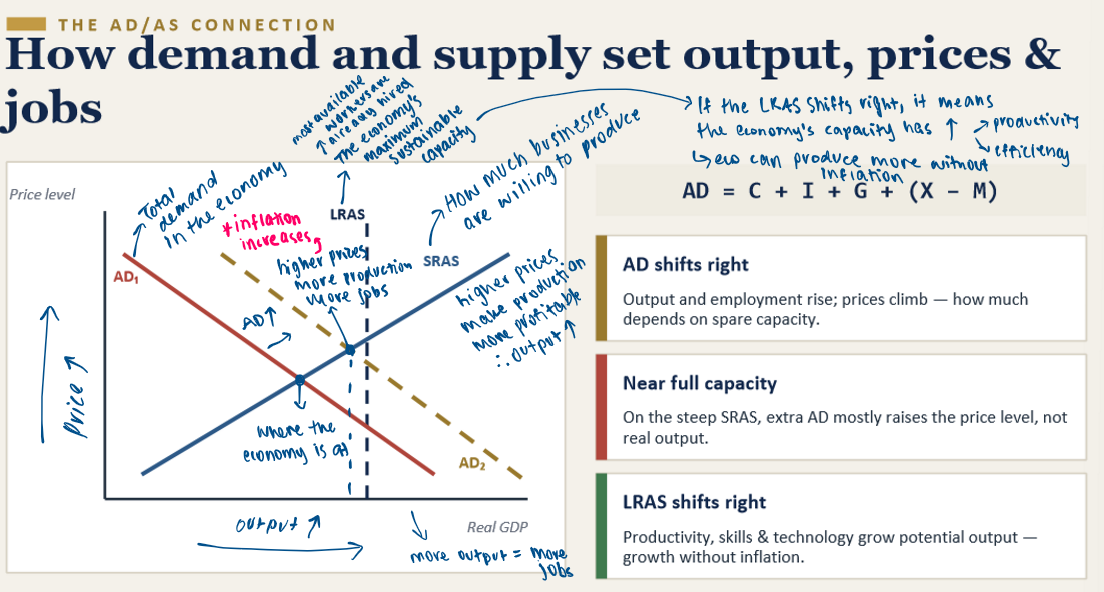
How demand and supply set output, prices, and jobs (graph)
Percentage change calculation
% change = (new - old) x 100
old
When to use it:
Economic (real GDP) growth rates
Inflation from a CPI series
Comparing any value across time
Points and Basis Points
Percentage point (pp):
The simple difference between two percentages
e.g. 4% to 4.5% = 0.5% pp (NOT +0.5%)
Basis point (bp):
One-hundredth of a percentage point.
100bp = 1pp
0.25pp = 25 bp
Conversions
1 pp = 100 bp
0.25 pp = 25 bp
0.5 pp = 50 bp
When to use it:
Interest rates (basis points)
Unemployment (percentage points)
Nominal vs Real
Nominal: measured at current prices - includes inflation
Real: adjusted for inflation - constant prices, true volume
Why this matters:
Strips out price changes to reveal real growth
Shows true purchasing power of incomes
Let's us compare fairly across years
Calculations:
Real GDP = Nominal GDP x 100
GDP deflator -> REAL GDP?
Real wage growth = nominal wage growth - inflation
Real interest rate = nominal interest rate - inflation
What moves the AD curve right (shift)
AD SHIFTS RIGHT
RBA cuts the cash rate -> C and I rise
$A depreciates -> X up, M down
Rising consumer/business confidence
What moves the AD curve left (shift)
AD SHIFTS LEFT
RBA raises the cash rate -> C and I fall
Government cuts spending (G decrease)
Falling confidence, higher taxes
SRAS vs LRAS: costs now vs capacity later
| SRAS | LRAS |
Slope | upwards | vertical - set at the economy's potential output |
Timeframe | short run - some input costs (wages) are sticky | long run: all costs adjusted; full employment |
Shifts with | input costs - wages, energy oil, the $A, productivity | resources, labour force, capital, technology, skills - if the LRAS shifts outwards then the economy's productive capacity has increased |
Exam cue | a cost sock moves SRAS (e.g. good price spike) | A capacity change moves LRAS (e.g. productivity gain) |
What shifts the SRAS supply curve LEFT?
COST-PUSH
Oil/energy price spike, drought, wage surge, or a weaker $A raising import costs -> production is dearer -> higher prices and lower output (stagflation risk)

What shifts the LRAS RIGHT?
CAPACITY INCREASE
New technology, more skilled workers, investment in capital, or migration -> potential output grows -> sustainable growth with little inflation

Macroeconomic equilibrium - how AD, AS price level and employment connect
Output (real GDP) - Y* is where AD meets SRAS which is the actual level of production this year
Price level - P* is the equilibrium price level; changes in it are inflation or deflation
Employment - more output needs more workers, so Y* sets the level of employment

Economic cycle and the multiplier
Connection: a spending injection sets off a multiplier ripple that lifts national income - and that’s what pushes the economy from one phase of the cycle to another.
Recovery
Boom
Contraction
Recession

Marginal Propensity to Consume (MPC)
Tracking the money in the economy
Consumers actual spending/incentive to send
Bakery example: someone spends which gives someone else money, so they spend and give someone else money
The amount the money grows is the multiplier (K)
Incitement for people to spend so that money can circulate through the economy
K (multiplier) = 1/(1-MPC)

Marginal Propensity to Save (MPS)
Government would add money into the economy to attempt to stimulate the economy but due to economic conditions e.g. uncertainty or instability, people would choose to save that money
Based on economic conditions
Leakage
K = 1/MPS
Cyclical unemployment
Caused by an economic downturn - too little AD. It is characterised by a decrease in demand for goods and services leading to job losses as companies reduce their workforce to cut costs.
DIRECTLY RELATES TO THE BUSINESS CYCLE → contraction
Structural unemployment
Long-term unemployment caused by economic changes or tech innovations that result in the skills of workers not aligning with the needs of employers.
Skills, industry or location mismatch as the economy changes
Frictional unemployment
Short-term unemployment that occurs when workers look for new employment or transition out of old jobs and into new ones.
Seasonal unemployment
Temporary job loss that occurs at predictable times of the year due to fluctuations in demand for labour in certain industries.
Common industries:
agriculture, tourism, retail, and construction
Hidden unemployment
Hidden unemployment includes people who are technically employed but not fully utilizing their skills or working fewer hours than desired, as well as those who have stopped seeking work due to discouragement
Long-term unemployment
Unemployed for 52 weeks or more -> skills erode
Under-employment
Employed, but wanting and available for more hours
Underutilisation of labour resources
Labour market concepts (4 main ideas)
Labour force: everyone of working age (15+) who is either employed or actively looking for work. Excludes students, retirees, and carers not seeking work
Participation rate: the share of the working-age population that is in the labour force -> a gauge of how engaged people are with work
Participation rate = labour force / working-age population x 100
Underutilisation: the unemployed PLUS the underemployed -> a broader measure of wasted labour capacity
NAIRU: the non-accelerating-inflation rate of unemployment -> the lowest jobless rate sustainable before inflation starts to rise
Unemployment/labour market calculations
Participation rate = labour force/working-age population x 100
Unemployment rate: unemployed/labour force x 100
Underutilisation rate = (U + UE) / labour force x 100
NAIRU
The lowest unemployment rate that can be sustained without causing inflation to accelerate.
Why isn't unemployment 0% at full employment?
Because even when the economy is strong, there will always be some people:
changing jobs → frictional unemployment
whose skills don't match available jobs → structural unemployment
NAIRU and cyclical unemployment
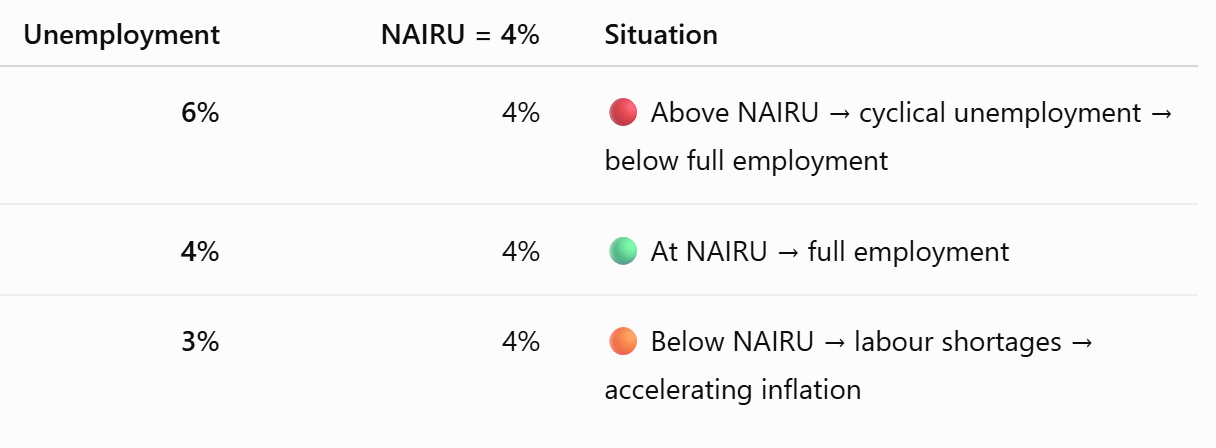
What happens when unemployment is above the NAIRU?
There is cyclical unemployment. The economy has spare labour resources, usually because aggregate demand is insufficient.
What happens when unemployment falls below the NAIRU?
Labour shortages increase → wages rise → production costs rise → inflationary pressure increases, causing inflation to accelerate if the situation persists.
*If there is no cyclical unemployment, the economy is at full employment

Three NAIRU situations
Recessionary Gap
A recessionary gap occurs when the economy is producing less than it could at full employment because aggregate demand is too low, leading to underutilised resources and higher unemployment.
relates to cyclical unemployment → therefore BUSINESS CYCLE
there is NO LONGER full employment
Recessionary gap diagram
Initial economy:
The economy starts at:
AD₁ + SRAS → Yf
Here, output is Yf, the full-employment level.
So, the economy is at full employment, with unemployment at approximately the NAIRU.
THEN
Something causes AD to fall for example:
Consumer confidence falls → households spend less → C ↓
Business confidence falls → firms invest less → I ↓
Exports fall → X ↓
Government spending falls → G ↓
Interest rates rise → consumption and investment fall
Therefore, AD curve shifts left.
SO
Consumers/businesses are buying fewer goods and services → businesses reduce production → they don't need as many workers which leads to higher unemployment
Unemployment increases above the NAIRU.
3. Businesses now sell fewer goo

NAIRU and AD curve movement
The key rule
AD falls → unemployment rises → unemployment goes ABOVE the NAIRU.
AD rises strongly → unemployment falls → unemployment can go BELOW the NAIRU.
Why lower unemployment creates inflation
If unemployment falls from 4% to 3% (below the NAIRU), there are more people employed and fewer unemployed workers available for businesses to hire.
Businesses then compete for workers by offering higher wages, which increases production costs. Businesses may then increase prices, creating upward pressure on inflation.
How to measure inflation
CPI
Headline and underlying inflation
Consumer Price Index (CPI)
The average price of a fixed basket of goods and services, set to 100 in a base year. Its % change is the inflation rate.
Percentage change = new-old/old x 100
Headline inflation
The % change in the whole CPI. It includes everything measured in the Consumer Price Index (CPI), including volatile things whose prices can jump around a lot, such as:
petrol
fruit and vegetables
electricity
other volatile items
Example:
Imagine the CPI basket costs $100 → then petrol prices suddenly rise and the basket costs $104.
➡ Headline inflation = 4%
It tells us about the actual overall change in the cost of the CPI basket.
Underlying inflation
A measure designed to remove temporary or unusually large price movements/volatile movements so we can see the more persistent inflation trend.
This is used, alongside headline inflation, to see whether inflation is between the target range of 2-3%.
Demand-pull inflation
This occurs when aggregate demand (AD) increases faster than the economy's ability to produce goods and services.
Triggers:
Rising C, I, G, or X
Tax cuts
Low interest rates
A spending or credit boom
Best cure:
Cool demand: higher interest rates or a contractionary fiscal policy
Cost-push inflation
This occurs when the costs of producing goods and services increase, causing businesses to raise their prices.
Triggers:
Oil/energy shocks, wage rises above productivity, dearer imports, a lower $AUD
Best cure:
Ease the cost pressure; supply-side reform (MICROECONOMIC REFORM). Demand policy alone can't win
Deflation and the deflationary spiral
Deflation is a sustained fall in the general price level - negative inflation.
A deflationary spiral is a self-reinforcing cycle where falling prices cause consumers to expect further price falls which delays spending.
This reduces AD and firms' revenue, causing firms to cut production and employment, reducing household incomes and spending further, leading to even lower prices.
Causes:
Deflation can happen when demand drops sharply. With fewer people buying goods and services, businesses lower their prices to attract customers.
Why is it dangerous:
Falling prices raise the real burden of debt and delayed spending deepens downturn
Policy difficulty:
Interest rates hit the zero lower bound (can't be lowered further), so cutting them further can't revive spending or stimulate AD
Stagflation
STAGFLATION = SUPPLY-SIDE
Stagflation is rising inflation and rising unemployment at the same time - stagnation plus inflation
Stagnation: a period of slow or no economic growth
Inflation: rising prices
e.g. businesses face higher production costs which leads to inflation but also has to produce less as they can’t afford to make more with inflation which leads to stagnation.
Cause:
A supply shock shifts SRAS left causing prices to increase and output to decrease at the same time
Dilemma:
Fight inflation and unemployment worsens; fight unemployment and inflation worsens. Needs supply-side intervention (MICROECONOMIC REFORM)
Types of fiscal policy
Expansionary fiscal policy - boosts AD through more spending or lower taxes to fight unemployment.
Contractionary fiscal policy - slows AD through less spending or higher taxes to fight inflation.
Budget revenue → how tax is raised
Most budget revenue is taxation. Tax is classified two ways: who collects it and how, and what happens to the tax rate as income rises
By collection point
Direct taxation: levied on income or wealth and is paid straight to the government - personal income tax, company tax
Indirect taxation: levied on transactions and passed on in prices - GST, excise on fuel, alcohol and tobacco
By rate structure:
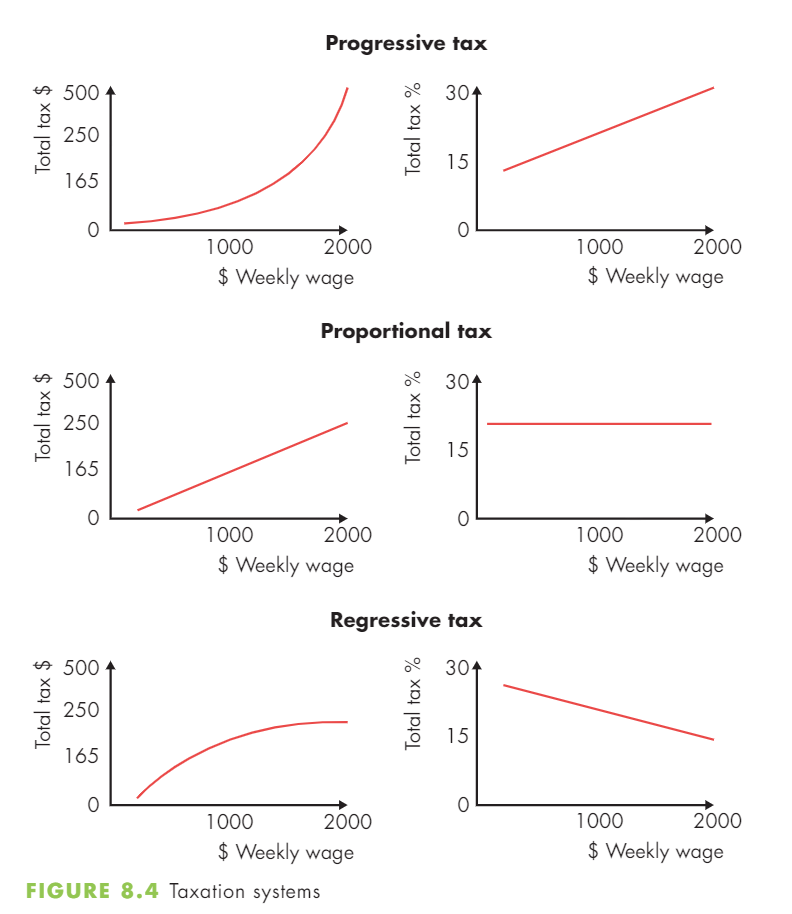
Progressive: average tax rate rises as income rises - aims at vertical equity - AUSTRALIA'S TAX SYSTEM
Proportional: same rate at every income - a flat tax e.g. the 2% Medicare levy, company tax
Regressive: average rate falls as income rises - flat taxes on spending like GST take a bigger share of low incomes
Types of tax graphs - progressive, proportional, regressive
Calculation for average tax rate
Average tax rate = tax paid/income x 100
Government expenditure: where tax goes
Current (recurrent) spending: day-to-day running costs - public sector wages, defence operations, service delivery
Capital spending: investment in long-term assets - roads, hospitals, schools and rail; builds capacity
Transfer payments: income support with no good or service in return - pensions, Jobseeker, family payments
Public utilities: provision of essential services - water, electricity, and public transport
Merit goods: goods society under-consumers if left to the market - education and healthcare
Automatic stabilisers - fiscal policy
How: built in features that adjust with no new policy decision - progressive tax and welfare
In a downturn: tax revenue falls and benefits rise, cushioning the fall in AD
In a boom: tax rises and benefits fall, dampening AD and inflation
Discretionary stabilisers - fiscal
How: deliberate changes announced in the budget - new spending or tax measures
Example: a stimulus package (stimulate the economy), and infrastructure program, or an income tax cut
Trade-off: powerful and target, but exposed to time lags and politics
Budget outcomes
The Budget outcome compares revenue with expenditure. Its direction of change - not just its sign reveals the fiscal stance.
Deficit - G > T (gov spending is greater than taxation revenue)
Spending exceeds revenue; financed by borrowing, adding to public debt
Balanced G = T (spending = tax)
Revenue equals spending; a neutral position over the year
Surplus T > G (tax is greater than spending)
Revenue exceeds spending; can repay debt or save for the future
Fiscal stances with the budget outcome
Expansionary stance: deficit rising or surplus shrinking as the gov is saving less (spending more) → net injection boosts AD. Used to fight unemployment and recession.
Contractionary stance: surplus rising or deficit shrinking as the gov is saving more → net leakage slows AD. Used to fight inflation and an overheating economy
*TRICK - opposite to what you would think
Expansionary fiscal policy on AD/AS
The mechanism: higher G (gov spending) or lower T (tax) injects spending; the multiplier re-spends it, so AD shifts right by a multiple
The effect: real output rises from Y1-Y2 towards full employment; jobs grow with a small rise in the price

Strengths of expansionary fiscal policy
Direct and target: Government spending injects straight into the economy and can be aimed at regions or sectors
Strong in deep recessions works when monetary policy is weak - rates near zero can't fall much further
The multiplier effect: the initial injection is re-spent, amplifying the impact on output and jobs
Limitations of expansionary fiscal policy
Time lags: recognition, decision (the Budget cycle) and implementation delay the impact
Crowding out: government borrowing can raise interest rates and lead to less private investments (due to less money available)
Crowding out occurs when increased government borrowing raises interest rates, making it more expensive for businesses to borrow and invest, reducing private sector investment.
Deficits and politics: raising debt and interest costs, and spending that is easy to start but hard to reverse
if the gov spends more money, then the budget deficit will increase
When expansionary fiscal policy should be used
Expansionary fiscal policy is most effective in a deep downturn with spare capacity and least effective when the economy is near full employment as this mainly adds to inflation and debt.
RBA role and goals → monetary policy
Role:
Sets the cash rate -> sets the overnight cash rate target at its monthly board meetings - the anchor for all interest rates
Acts independently -> operates at arm's length from the government, so decisions rest on economic not political grounds
Goals/objectives:
Price stability: keep consumer price inflation within the 2-3% target band
Full employment: support maximum sustainable employment - low unemployment without fuelling inflation
Economic prosperity: promote the economic welfare and prosperity of the Australian people over the medium term
Monetary policy → Inflation targeting
The target: keep annual CPI inflation between 2-3% over the medium term
Why a band not a point: a range gives flexibility to look through temporary price shocks without overreacting
On average, over time: met across the cycle, not every quarter, so short spikes need to trigger a move
Anchoring expectations: a credible target keeps household and business inflation expectations stable and self-fulfilling
Above the band: if inflation runs too high, the RBA tightens its policy by raisin the cash rate to cool demand back into the target
Loosening vs tightening monetary policy
Expansionary (loosening)
How: cut the cash rate so borrowing is cheaper and saving is less rewarding
Used when: the economy is weak - unemployment rising and inflation below target -> to stimulate the economy
Effect: spending and investment rise, lifting AD, output and jobs
Contractionary (tightening)
How: raise the cash rate so borrowing is more expensive and saving is more attractive
Used when: the economy is overheating - inflation above the 2-3% band
Effect: spending and investment fall, easing AD and cooling inflation
The transmission mechanism → monetary policy
A change in the cash rate does not hit output directly. It works through a chain of steps that takes 12-18 months to play out.
Step 1: cash rate
The RBA moves the cash rate; banks pass it on to lending and deposit rates
Step 2: behaviour
Cheaper credit lifts borrowing, consumption and investment; a lower dollar aids exports
Step 3: economy
AD shifts, changing output, employment, and finally inflation
*A rate cut: cash rate decreases, -> borrowing increases -> savings decrease -> the AUD depreciates -> C, I and net exports increase -> AD increase -> output and jobs increase
*a rate rise: cash rate increases -> borrowing decreases -> saving increases -> the AUD increases -> C, I, and net exports decrease -> AD decreases -> inflation eases
A cash rate cut on the AD/AS
The mechanism: a lower cash rate cuts borrowing costs, lifting consumption and investment so AD shifts right to AD2
The effect: real output rises from Y1->Y2 towards full employment; jobs grow, with a small rise in the price level

Strengths of monetary policy
Flexible and fast: the RBA board can change the cash rate every month - far quicker than the annual Budget
Independent and credible: free of the political cycle, so decisions target inflation and are trusted by markets
Broad reach: rate changes ripple through borrowing, spending, the AUD, and asset prices economy-wide
Limitations of monetary policy
Time lags: the full effect on inflation can take 12-18 months to arrive
Blunt instrument: one national cash rate cannot target particular regions or struggling sectors
Weak when rates are low: near zero, there is little room to cut, and low confidence may deter borrowing anyway.
Why do governments use supply-side policy
The goal: expand what the economy can produce
shift LRAS to the right
Supply-side and macroeconomic policies aim to lift the economy's productive capacity and its efficiency, shifting LRAS right rather than just managing demand.
Productivity: more output per worker and per unit of input - the engine of real income growth
Efficiency: resources flow to their most valued use; less waste in production and allocation
Competitiveness: lower costs and better-quality lift export capacity and international competitiveness
Long-run growth: a sustained rightward shift in the LRAS raises potential GDP without added inflation
SRAS
A rightward shift in SRAS occurs when production costs decrease or productivity increases, allowing firms to produce more at each price level.
Examples:
Lower wages
Lower energy costs
Lower business taxes
Improved productivity
LRAS
A rightward shift in LRAS occurs when the economy's productive capacity increases through growth in resources, skills, capital, or technology.
Examples:
More workers
Better education and training
Increased investment in capital
Technological advancements
Distinguishing between SRAS and LRAS
SRAS shift affects how much firms can produce now because production costs change.
LRAS shift increases the economy's potential/full-employment output and raises the economy's long-term "ceiling".
SRAS: upward sloping and shifts with current production costs. Moving it changes prices and output in the short run.
Trigger words:
Wages
Energy
Input prices
Business tax rates
Effect:
Prices and output move along the cycle for the short run
LRAS: vertical at potential output and shifts only when productive capacity changes. Moving it right is genuine, sustainable future economic growth
Trigger words:
Infrastructure
Education and skills
R&D
Innovation
Deregulation
Competition reform
Effect:
Potential GDP rises - sustainable, non-inflationary growth
Five supply-side levers - and the curve that it moves on the AD/AS
Infrastructure
Transport, energy, and digital networks cut logistic costs and unlock private investment
LRAS right shift - increased productive capacity
Education and training
A more skilled workforce raises labour productivity and the quality of human capital
LRAS right shift - increased productive capacity
Research and development
R&D grants and tax offsets expand the technology frontier and future output
LRAS right shift - increased productive capacity
Innovation
New products, processes and firms lift productivity and dynamic efficiency
LRAS right shift - increased productive capacity
Deregulation
Removing barriers boosts competition and allocative efficiency and can also ease current costs
LRAS right shift - increased productive capacity
Four reasons governments intervene → economic management
Efficiency: steer resources to their most valued use - productive and allocative efficiency
Equity: a fairer distribution of income and access to essential goods and services
Trade-offs: goals conflict - growth vs inflation, equity vs efficiency. Managing means choosing.
Stabilise the cycle: smooth booms and busts: contain unemployment and inflation over the business cycle
*Link between fiscal and monetary policy -> they both manage AD
Demand management vs supply-side policy
Demand management vs supply-side policy
Demand management manages AD
Tools: fiscal budget and monetary cash rate
Focus: the short-run business cycle
Targets: unemployment and inflation
Acts fast but effects can fade
Supply-side policy raises productive capacity and efficiency
Tools: infrastructure, education, R&D, deregulation
Focus: the long run (shifts LRAS right)
Targets: growth, productivity, competitiveness
Powerful but works with long lags
*For exam: use demand management to stabilise the cycle then use supply-side policy to lift the long-run growth ceiling