Supply and demand shifts
1/4
There's no tags or description
Looks like no tags are added yet.
Name | Mastery | Learn | Test | Matching | Spaced |
|---|
No study sessions yet.
5 Terms
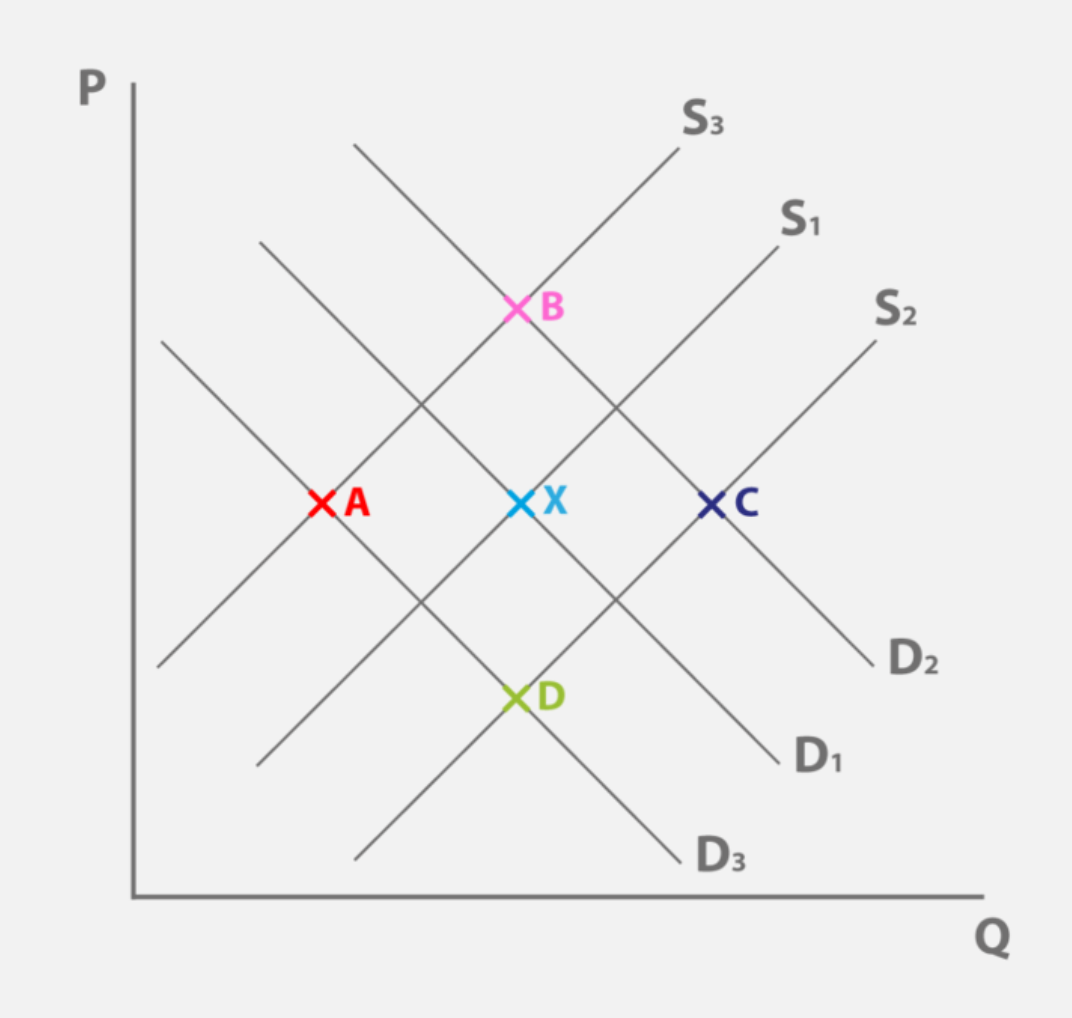
he diagram shows the supply and demand for Olympic T-shirts during the Rio Olympic Games. The government has lowered the cost of production for these T-shirts by providing machinery to improve the production process. There has also been a natural influx of tourists visiting Rio to watch the games and to enjoy the hot weather.
If the initial equilibrium is at X, which of the following points shows the likely new equilibrium point for Olympic T shirts:
C- Lower costs of production will increase supply to S2. More tourists will increase demand for Olympic T-Shirts increasing demand to D2. New equilibrium will be between D2 and S2 and C
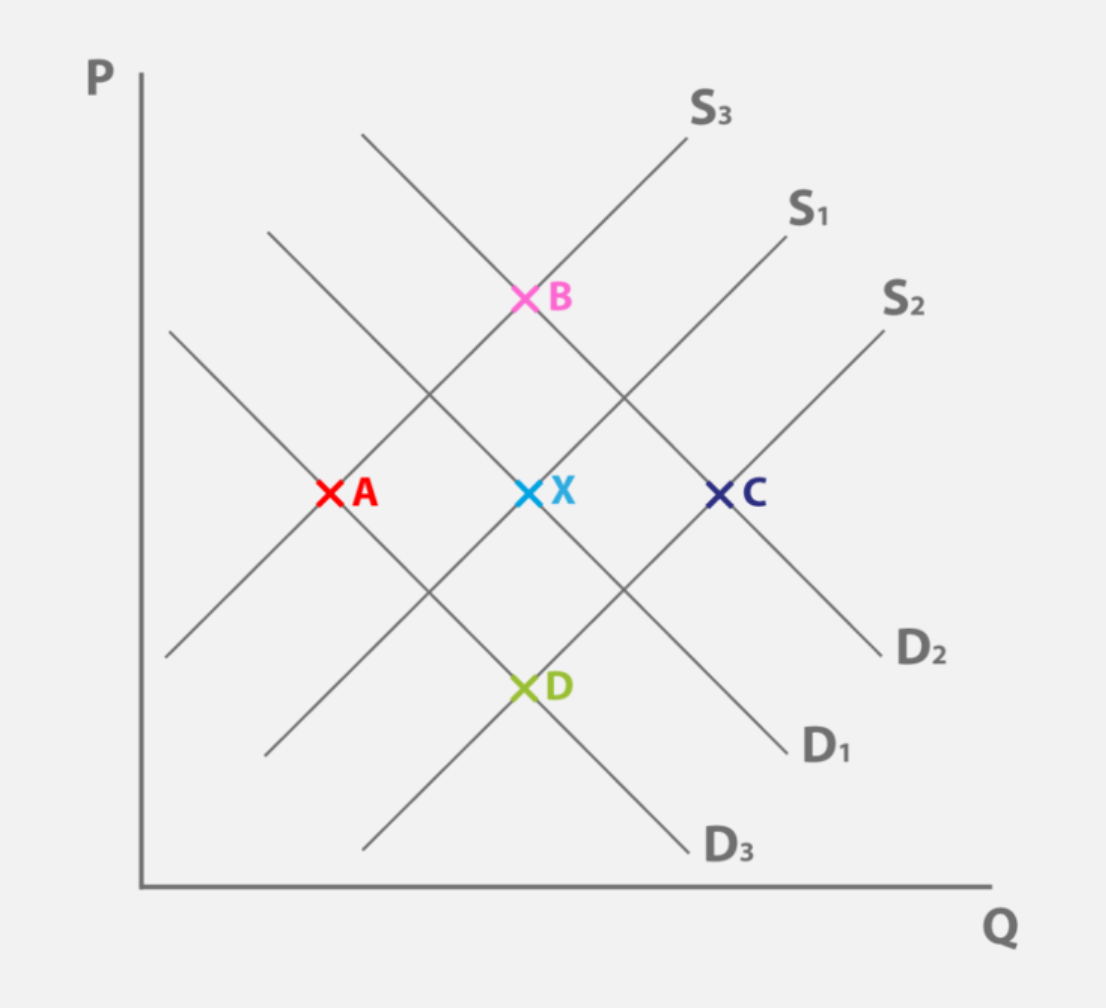
The diagram shows the supply and demand of oil in the United Kingdom. After Iran joined the global market for oil production in 2015, Saudi Arabia decided to increase their oil production to steal Iran’s revenues. Energy consumption has also increased in the UK during the winter months, as households become more reliant on heating.
If the initial equilibrium point is X, which of the following shows the likely new equilibrium point for oil:
C- If Iran joined the global market for oil production and started producing more oil and Saudi Arabia increased oil production, supply of oil will increase to S2. If energy consumption is increasing in the UK, energy companies will require more oil for electricity so demand for oil will increase to D2. New equilibrium will be between D2 and S2 at C
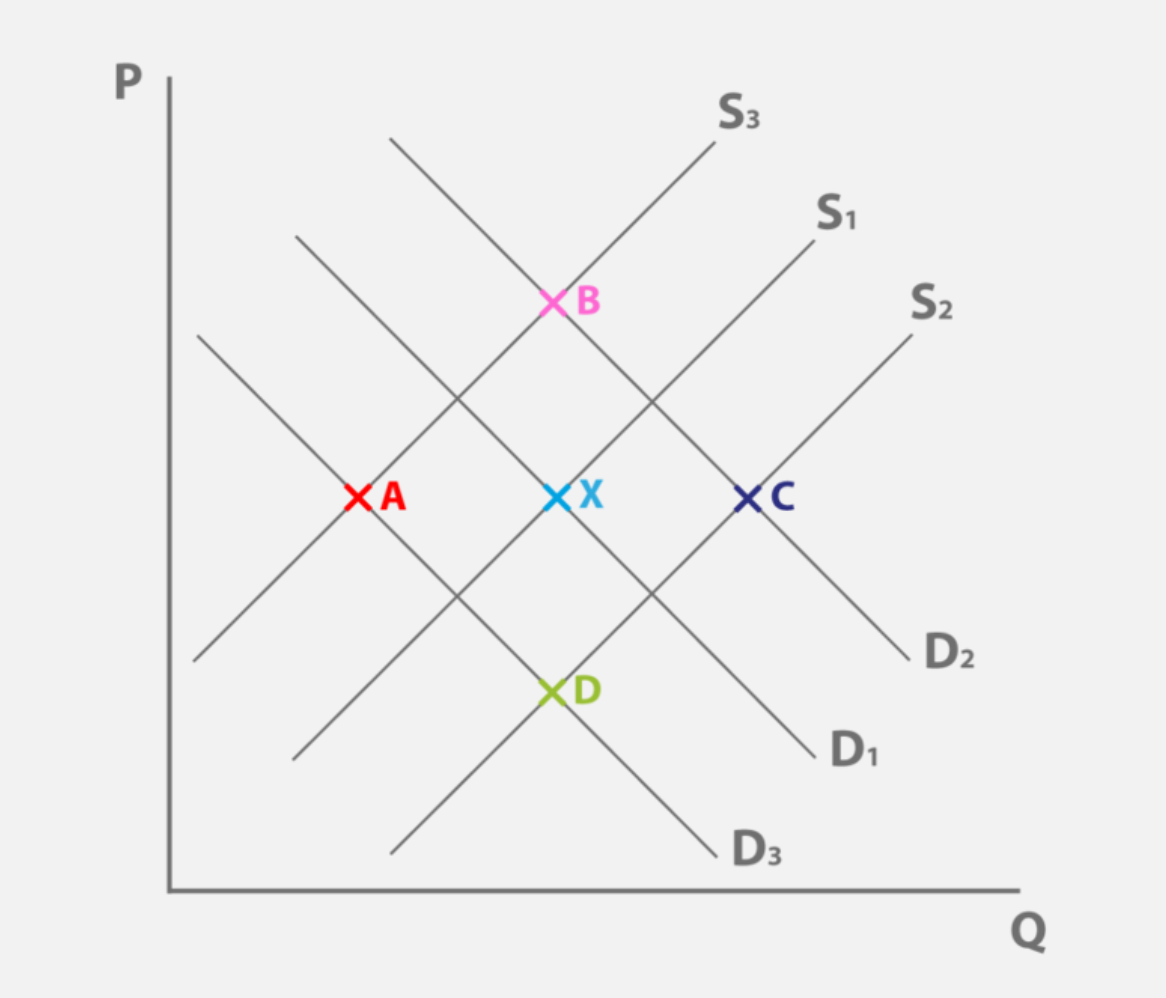
The diagram shows the demand and supply of cricket bats at a shop called Sports4u. They recently invented a new wood-sculpting process which can make cricket bats at 140% of the speed of their old machine. Sports4u have struggled to acquire new customers, however, as winter approaches and sports enthusiasts move away from summer sports like cricket.
If the initial equilibrium point is X, which of the following shows the likely new equilibrium point for cricket bats:
D- The new wood-sculpting process will increase productivity so supply will increase to S2. As sports enthusiasts switch away from cricket, demand will fall to D3. New equilibrium will be between D3 and S2 at point D.
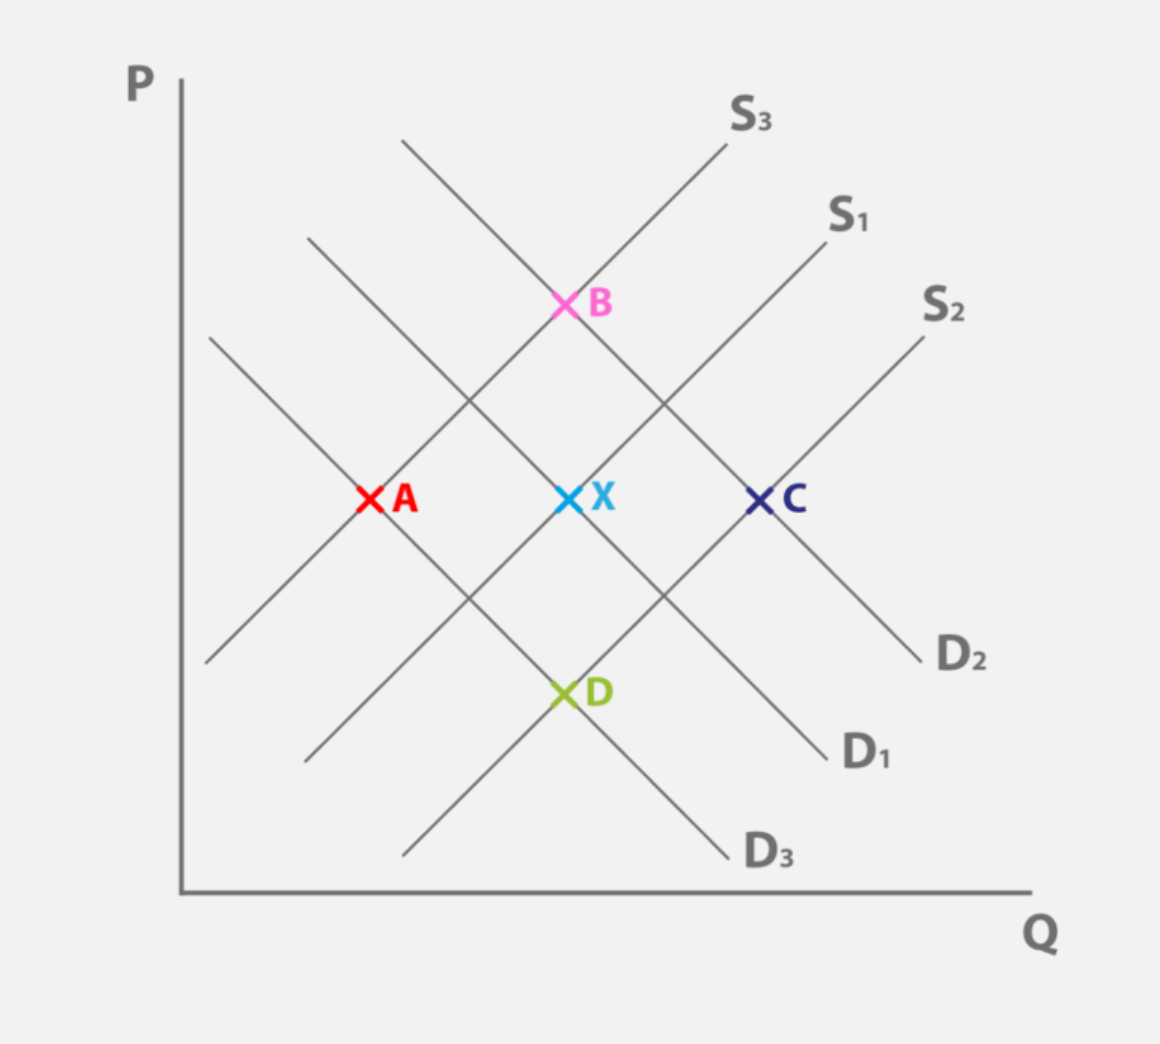
The diagram shows the demand and supply of corn. Due to poor weather conditions last year, production of corn has had one of its worst harvests to date. However, following a governmental health campaign, corn is now being seen as an increasingly healthy side dish.
If the initial equilibrium point is X, which of the following shows the likely new equilibrium point for the corn market:
B- Poor weather will reduce the supply of corn to S3. The government's health campaign will increase demand for corn to D2. New equilibrium will be between S3 and D2 at point
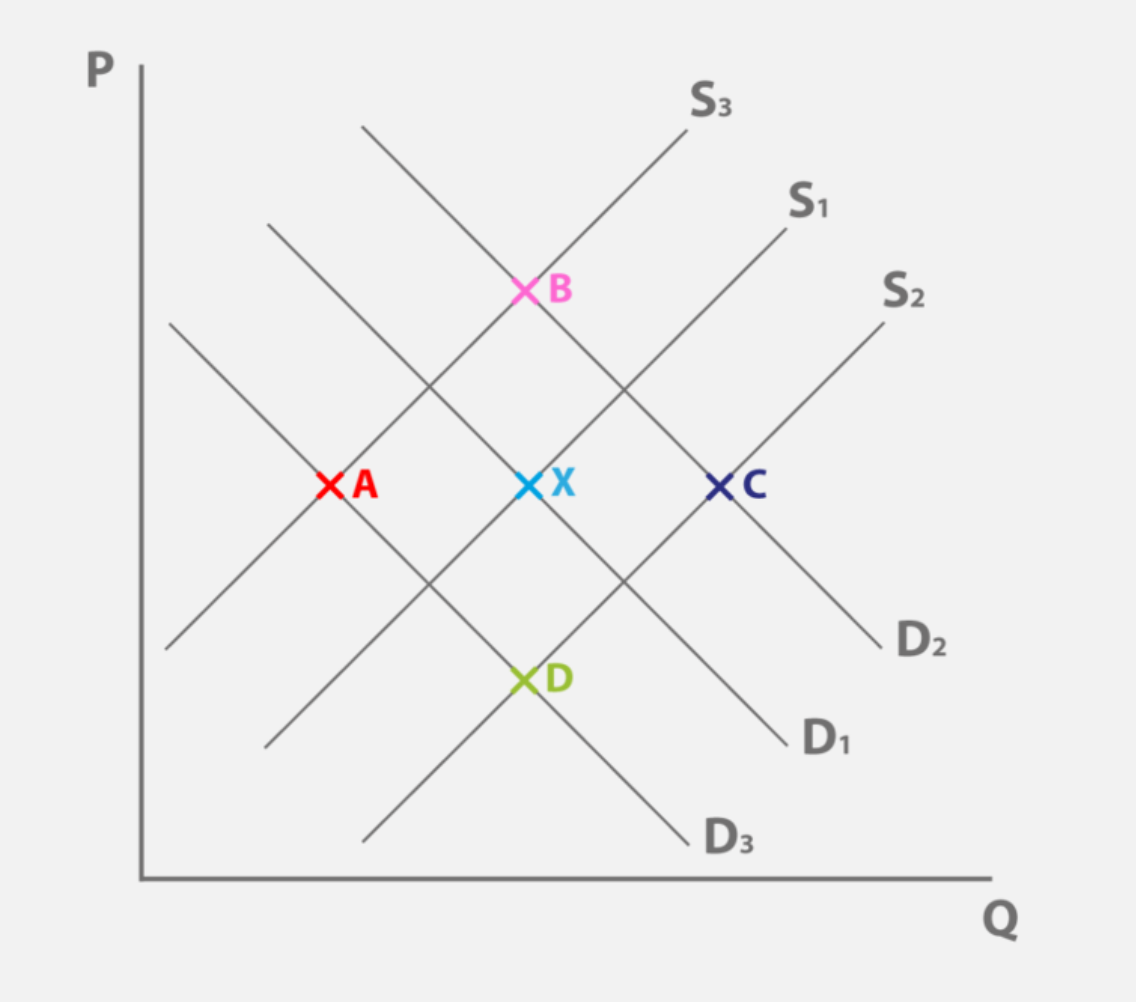
The diagram shows the demand and supply of chicken. Protests from animal rights campaigners have forced farms to increase the size of their cages for chickens to allow more freedom, while chicken has grown less popular as a food choice in light of the protesting.
If the initial equilibrium point is X, which of the following shows the likely new equilibrium point for chicken?
A- If farms have to increase their cage size, they will experience higher costs, reducing supply to S3. If chicken is less popular with consumers, demand will decrease to D3. New equilibrium will be between D3 and S3 at A.