8.1 Hypothesis Testing One Sample
1/16
There's no tags or description
Looks like no tags are added yet.
Name | Mastery | Learn | Test | Matching | Spaced |
|---|
No study sessions yet.
17 Terms
Steps for Hypothesis testing for Proportion
Assumptions
Stating Hypothesis
Test Statistic
Calculate P Value
Conclusion
Assumptions
Check what assumptions are needed for each specific significnace test
Hypothesis
Statement about a population, claiming that a parameter takes a particular numerical value or falls in a certain range of values
Null Hypothsis
Specifies a single value
Usually represents no effect
Alternative Hyphothesis
Specify a range of values
Usually represent some type of effect
Test’s Side
Not Equal = Both Sides
Larger = Right Sided
Smaller = Left Sided
Test Statistic
Describe how far the point estimate falls from the parameter value in the null hypothesis, measured by number of standard errors
P Value
Probability to receive the value equal to the test statistic or more extreme, given H0 is true.
If P value is small, H0 may be false or the sample is not representative of the population
Significant Level (\alpha)
If p value is <= \alpha reject H0, others H0 is true.
Propotion Assumptions
Variable measured is Categorical
Data obtained using randomization
np0(1-p0) >= 5
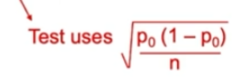
Proportion Test Statistics
Mean Assumption
Variable measured is quantitative
Data obtained using randomization
Population distribution is approximately normal (ignored when n > 30)
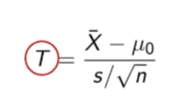
Mean Test Statistic Formula
Conditions where the Confidence Interval and Significance Test is Consistent
Confidence level, 95%, must match the significance level, 0.05
Test must be a 2-sided test
CI and test must use the same standard error (For proportion)
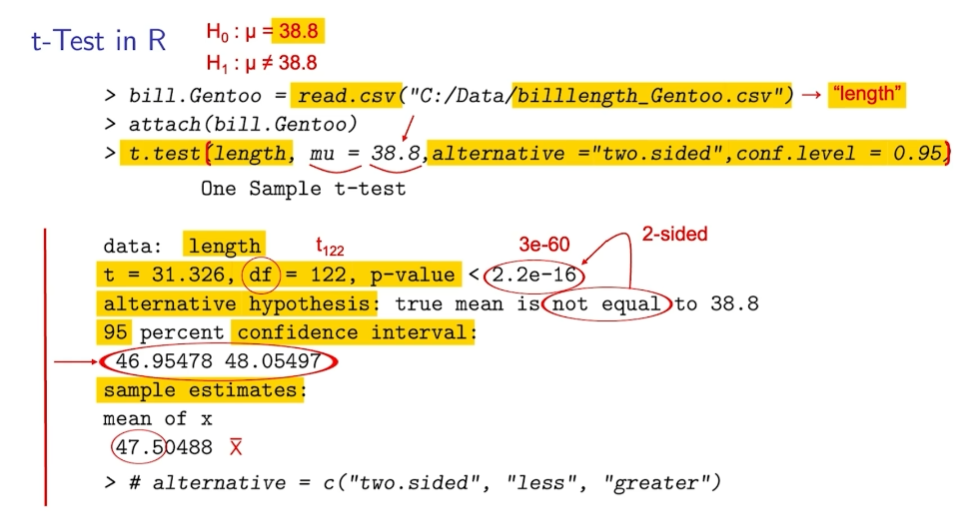
Obtaining T-Test in R
t.test(vector, mu=x)
Alternative = “two.sided”
conf.level = 0.95
Type 1 Error
Reject H0 when H0 is true. Probability of this is \alpha. Focus on type 1 error.
Type 2 Error
Fail to reject Ho even tho it is false. Probability is \beta, power of a test = 1 - \beta.