3.3 cost, revenue and profit
1/66
There's no tags or description
Looks like no tags are added yet.
Name | Mastery | Learn | Test | Matching | Spaced | Call with Kai |
|---|
No analytics yet
Send a link to your students to track their progress
67 Terms
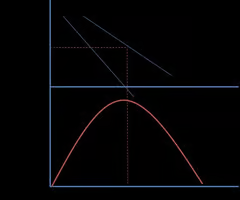
Total Revenue
Revenue from sales calculated as price x quantity.
Marginal Revenue
Extra revenue from selling one additional unit.
Average Revenue
Total revenue divided by quantity sold.
Price Elasticity of Demand (PED)
Measures responsiveness of quantity demanded to price changes.
Total Cost
Cost to produce a given level of output.
Total Fixed Cost
Costs that do not vary with output level.
Total Variable Cost
Costs that change with output level.
Average Total Cost (ATC)
Total costs divided by quantity produced.
Average Fixed Cost (AFC)
Total fixed costs divided by quantity produced.
Average Variable Cost (AVC)
Total variable costs divided by quantity produced.
Marginal Cost
Cost of producing one additional unit of output.
Demand Curve
Graph showing relationship between price and quantity demanded.
Price Takers
Firms that accept market price; horizontal AR curve.
Price Makers
Firms that set prices; downward sloping AR curve.
Diminishing Marginal Productivity
Decreasing additional output from increasing one input.
Elastic Demand
Demand where quantity changes significantly with price changes.
Inelastic Demand
Demand where quantity changes little with price changes.
Revenue Maximization
Occurs when marginal revenue equals zero.
Short Run
Period where at least one production factor is fixed.
Long Run
Period where all production factors can change.
Indirect Costs
Costs not directly tied to production, like rent.
Direct Costs
Costs directly associated with production, like materials.
AR Curve
Average revenue curve; represents price of goods.
Short Run
Period with some fixed costs in production.
Long Run
All costs are variable in production.
Very Long Run
State of technology can change significantly.
Diminishing Marginal Productivity
Output increases initially, then marginal output declines.
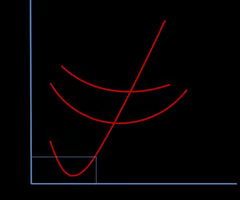
Marginal Cost (MC)
Cost of producing one additional unit of output.
Average Total Cost (ATC)
Total cost divided by quantity of output.
Average Variable Cost (AVC)
Variable cost per unit of output produced.
Average Fixed Cost (AFC)
Fixed cost per unit as output increases.
Minimum Efficient Scale
Lowest point on LRAC where costs are minimized.
Diseconomies of Scale
Average costs increase as production expands.
Economies of Scale
Average costs decrease as production increases.
Short-Run Average Cost (SRAC)
Average cost curve in the short run.
Long-Run Average Cost (LRAC)
Average cost curve in the long run.
Cost Curves
Graphical representation of costs at different outputs.

Marginal Output
Additional output resulting from one more input.
Total Costs
Sum of fixed and variable costs in production.
Macroeconomic Factors
External factors affecting a firm's production costs.
Competitiveness
Ability to compete based on cost and pricing.
Risk-Bearing Economies
Larger firms spread costs of uncertainty across products.
Financial Economies
Larger firms access cheaper loans and credit.
Managerial Economies
Specialization in larger firms reduces average costs.
Production Range Expansion
Larger firms can diversify product offerings effectively.
Diminishing Returns
Increased inputs lead to reduced marginal output.
Economies of Scale
Cost advantages as output increases for firms.
Technological Economies
Larger firms invest in advanced machinery, lowering costs.
Marketing Economies
Larger firms spread advertising costs over more units.
Purchasing Economies
Bulk-buying reduces cost per unit for larger firms.
Network Economies of Scale
Low-cost expansion through ecommerce for large retailers.
External Economies of Scale
Industry growth leads to lower costs for local firms.
Diseconomies of Scale
Increased costs per unit after optimal output level.
Control Issues
Monitoring productivity becomes challenging in larger firms.
Coordination Challenges
Managing thousands of employees complicates operations.
Communication Problems
Employee alienation can reduce motivation and productivity.
Long Run Average Cost Curve
Graph showing costs decrease then increase with output.
Normal Profit
Minimum profit to keep entrepreneurs in business long-term.
Supernormal Profit
Profit exceeding normal profit, above opportunity costs.
Losses
When total costs exceed total revenue for a firm.
Profit Maximization Condition
Occurs when marginal cost equals marginal revenue (MC=MR).
Short-Run Shutdown Point
Firm shuts down if price is below average variable cost.
Long-Run Shutdown Decision
Firm exits industry if total revenue is less than total costs.
Average Variable Cost (AVC)
Variable costs per unit of output produced.
Total Revenue (TR)
Total income from sales of goods or services.
Total Cost (TC)
Sum of fixed and variable costs for production.
Opportunity Cost
Cost of forgoing the next best alternative.